As 2024 passes its midpoint, the global climate continues to push into uncharted territory.
Carbon Brief’s analysis indicates a 95% probability that this year will surpass 2023 as the warmest year on record in the Copernicus/ECMWF ERA5 dataset.
This projection emerges amid a series of climate extremes that have marked the first half of 2024.
In the latest “state of the climate” quarterly update, Carbon Brief assesses the first full six months of 2024 and finds:
- The first six months of 2024 have each set new temperature records, extending an already remarkable streak of 13 consecutive record-breaking months dating back to 2023.
- On 22 July, the world experienced its highest absolute global daily temperature on record, reaching a scorching 17.15C.
- The heat has been felt globally, with 63 countries experiencing their warmest June on record. Over the past 12 months, a staggering 138 countries have recorded their hottest temperatures ever.
- July 2024 is very likely to be the first time in 13 months without a new record, coming in cooler than July 2023. However, it will still be more than 0.2C warmer than any July prior to 2023.
- With El Niño fading and modest La Niña conditions potentially developing later this year, it is unlikely that the extreme monthly temperature records set in the second half of 2023 will be surpassed in 2024.
- Antarctic sea ice extent has fallen to near 2023’s record lows in recent weeks, reflecting the broader trend of polar sea ice loss.
Record warm first half of the year
Global temperatures set a new record for each of the first six months of 2024, extending what was already a string of seven record setting months in 2023.
All in all, each of the last 13 months has been the warmest since records began in the mid-1850s.
The figure below shows how global temperature so far in 2024 (purple line) compares to each month in different years since 1940 (with lines coloured by the decade in which they occurred) in the Copernicus/ECMWF ERA5 surface temperature dataset.

Temperatures for each month from 1940 to 2024 from Copernicus/ECMWF ERA5. Anomalies plotted with respect to a 1850-1900 baseline. Chart by Carbon Brief.
Global temperatures in the latter half of 2023 exceeded prior records by at least 0.3C, peaking in September when 2023 surpassed the previous September record by 0.5C. While 2024 has continued to set records, the margins have been smaller:
- January to April 2024: About 0.1C above previous records (set in 2016)
- May 2024: About 0.2C above the previous record (set in 2020)
- June 2024: About 0.15C above the previous record (set in 2023)
It is important to note that June 2024 is being compared to the already high temperatures set in 2023. Compared to the last major El Niño event in 2016, June 2024 was about 0.4C warmer.
The figure below shows the margin by which global temperatures were set in each of the prior 13 record-setting months.

Margin by which new monthly temperature records have been set over the past 13 months. Using data from Copernicus/ECMWF ERA5. Chart by Carbon Brief.
In this latest quarterly state of the climate assessment, Carbon Brief analyses records from five different research groups that report global surface temperature records: NASA, NOAA, Met Office Hadley Centre/UEA, Berkeley Earth and Copernicus/ECMWF.
The figure below shows the annual temperatures from each of these groups since 1970, along with the average over the first six months of 2024. (Note: at the time of writing, June data was not yet available for the Hadley/UEA record.)

Annual global mean surface temperatures from NASA GISTEMP, NOAA GlobalTemp, Hadley/UEA HadCRUT5, Berkeley Earth and Copernicus/ECMWF (lines), along with 2024 temperatures so far (January-June, coloured dots). Anomalies plotted with respect to the 1981-2010 period, and shown relative to pre-industrial based on the average pre-industrial temperatures in the Hadley/UEA, NOAA and Berkeley datasets that extend back to 1850. Chart by Carbon Brief.
The globe, as a whole, has warmed more than 1C since 1970, with strong agreement between different global temperature records. However, there are larger differences between temperature records further back in time (particularly pre-1900) due to sparser observations and a resulting greater sensitivity to how gaps between measurements are filled in.
All show that the average global temperature for 2024 so far is higher than any prior annual record. However, annual temperatures may end up being a bit lower than those of the first six months of the year, as El Niño conditions have faded and a mild La Niña event is likely to develop later in the year.
The last two years – 2023 and 2024 – stand out as substantially warmer than any prior year in the temperature record. The chart below shows a heat map of daily global average temperatures in the Copernicus/ECMWF ERA5 dataset, with temperatures shown by colours ranging from blue (-2C) to red (+2C), with the pre-industrial average (1850-1900) set to 0C. The figure below shows each day since 1940 in the dataset.

A summer of temperature extremes
While global average surface temperature changes are an important indicator of long-term climate change, any month or year will have important regional warm or cool patterns in different parts of the world.
June 2024 saw particularly warm temperatures over much of South America, the southern US and Mexico, northern Africa, western Europe, central Asia and the Middle East among other regions.
The figure below shows the difference between temperatures in June 2024 and the baseline period of 1951-80, taken from Berkeley Earth (using their high-resolution temperature dataset). Red, orange and yellow shading indicate areas that have been warmer than average, while blue shows areas that have been cooler.

In total, 63 countries, mostly in Africa and South America, had their warmest national-average June on record. These included Brazil, Bulgaria, Cambodia, Colombia, Egypt, Ethiopia, Ghana, Greece, Israel, Ivory Coast, Jordan, Kenya, Lebanon, Libya, Nepal, Romania, Saudi Arabia, Somalia, South Africa, South Korea, Sudan, Syria, Turkey, Venezuela and Yemen.
The figure below shows which portions of the Earth’s surface experienced record high temperatures (deep red shading) in June 2024. It is noteworthy that almost no location on the planet experienced record cold temperatures.

Zooming out to the past 12 months (July 2023 to June 2024), 138 countries saw all-time records broken. This includes much of Central and South America, Canada, Africa, Europe, China, the Middle East and south-east Asia. Only an anomalous patch of east Antarctica saw record cold temperatures.

Very likely to be the warmest year on record
With half the year of data now available, Carbon Brief has determined that there is now an approximately 95% chance that 2024 will beat 2023 and be the warmest year on record, based on Copernicus/ECMWF’s ERA5 dataset. (Berkeley Earth separately estimated a 92% chance in their June update.)
By looking at the relationship between the first six months and the annual temperatures for every year since 1970 – as well as El Niño-Southern Oscillation conditions for the first six months of the year and projections for the remaining nine months – Carbon Brief has created a projection of what the final global average temperature for 2024 will likely turn out to be.
The analysis includes the estimated uncertainty in 2024 outcomes, given that temperatures from only the first half of the year are available so far.
The chart below shows the expected range of 2024 temperatures using the Copernicus/ECMWF global atmospheric reanalysis product (ERA5) – including a best-estimate (red) and year-to-date value (yellow). Temperatures are shown with respect to the pre-industrial baseline period (1850-1900).

Annual global average surface temperature anomalies from the Copernicus/ECMWF global atmospheric reanalysis product (ERA5) plotted with respect to a 1850-1900 baseline. To-date 2024 values include January-June. The estimated 2024 annual value is based on the relationship between the January-June temperatures and annual temperatures between 1970 and 2023. Chart by Carbon Brief.
Carbon Brief’s projection suggests that 2024 is very likely to be the warmest year on record, with a central estimate of 1.57C.
This is true even if – as the projection implicitly assumes – the remaining months in 2024 are below the records set in 2023. Because the first six months of the year were so warm – around 1.63C above pre-industrial levels – the second half of the year would have to be relatively cool (below 1.3C) for the year as a whole to not exceed 2023.
It is worth repeating that an individual year hitting 1.5C above pre-industrial levels is not equivalent to the 1.5C limit within the Paris Agreement. This limit refers to long-term warming, rather than an individual year that includes the short-term influence of natural fluctuations in the climate, such as El Niño. Even including data through to the present day, long-term global temperatures (excluding year-to-year variability) are unlikely to exceed 1.5C until the late 2020s or early 2030s.
The figure below shows Carbon Brief’s estimate of 2024 temperatures using ERA5, both at the beginning of the year and once each month’s data has come in. The central estimate remained relatively unchanged until June, after which it increased a bit as the month turned out a bit warmer than the model anticipated. The uncertainty has diminished with each additional month of data, as there are fewer remaining months in 2024 to substantially change the results.

Carbon Brief’s projection of global temperatures at the start of the year, and after January, February, March, April, May, and June ERA5 data became available. Chart by Carbon Brief.
There is reason to expect that global temperature anomalies will modestly decline over the remainder of the year as El Niño fades away and moderate La Niña conditions potentially develop. The figure below shows a range of different forecast models for ENSO for the rest of this year, produced by different scientific groups. The values shown are sea surface temperature variations in the tropical Pacific – the El Niño 3.4 region – for overlapping three-month periods.

There is a mix of projections across models, with many of the dynamical models expecting very modest La Niña conditions (<-0.5C Niño 3.4 sea surface temperature – SST – anomaly) to develop by October, while most of the statistical models expect ENSO-neutral conditions to persist.
July on track to end the record monthly streak
Global surface temperatures have set a 13-month streak of monthly records from June 2023 and June 2024. However, with more than two thirds of July temperature now available, it is looking increasingly likely that July 2024 will break that streak, coming in as the second warmest on record after July 2023.
The figure below shows daily temperature anomalies from the Copernicus/ECMWF ERA5 record for 2024 (purple line), 2023 (red line) and 1940-2022 (grey lines). It highlights that July 2024 has been at or below 2023 temperatures for all but the past few days.

Daily global temperature anomalies from 1940 to present (22 July 2024) from Copernicus/ECMWF ERA5, with daily values for each year plotted as a separate line. The colours indicate 2024 (purple), 2023 (red) and all other years (grey). Anomalies plotted with respect to a 1850-1900 baseline. Chart by Carbon Brief.
Current global temperature anomalies are back in record territory as of 22 July, at around 1.7C above pre-industrial levels.
This is still well below the anomalies of 2C or more briefly hit in late 2023 and early 2024. However, because the current temperature anomalies align with the warmest week of the year for global surface temperatures, they have resulted in a new record for absolute global temperatures. This is shown in the figure below, which features daily absolute global temperatures from the Copernicus/ECMWF ERA5.

Daily global absolute temperatures from 1940 to present (22 July 2024) from Copernicus/ECMWF ERA5, with daily values for each year plotted as a separate line. The colours indicate 2024 (purple), 2023 (red) and all other years (grey). Chart by Carbon Brief.
The prior daily absolute temperature record was 17.08C, set in early July 2023. This was exceeded both by 22 July (at 17.09C) and 22 July (at 17.15C).
While these daily absolute temperature records are not that climatically meaningful (and are only available in reanalysis data) – anomalies give a better sense of actual changes that are occurring – they nonetheless represent a symbolic milestone.
To determine where July 2024 temperatures will ultimately end up, Carbon Brief used a statistical model that extrapolates the final monthly temperatures based on the first 22 days of the month in all prior Julys since the ERA5 record began in 1940.
The figure below shows the expected range of July 2024 temperatures (black error bars) alongside a best-estimate (red diamond). Temperatures are shown with respect to the pre-industrial baseline period (1850-1900).

July global average surface temperature anomalies from the Copernicus/ECMWF global atmospheric reanalysis product (ERA5) plotted with respect to a 1850-1900 baseline. The estimated 2024 July value is based on the relationship between the first 21 days of the month and the final monthly temperatures between 1940 and 2023. Chart by Carbon Brief.
Here, Carbon Brief estimates that there is a very likely (>95%) chance that July 2024 comes in as the second-warmest July on record after 2023. However, it will still be quite warm, at more than 0.2C warmer than any July prior to 2023.
The extreme heat the world experienced in the latter half of 2023 makes setting new records over the remainder of the year less likely.
Low Antarctic sea ice extent
Antarctic sea ice extent spent much of early 2024 at the low end of the historical 1979-2010 range, though it has not quite exceeded record lows experienced in 2023.
However, in recent weeks Antarctic sea ice extent has rapidly dropped, and is now only modestly above 2023 levels.
Arctic sea ice extent has also spent most of this year at the low end of the historical range.
The figure below shows both Arctic and Antarctic sea ice extent in 2024 (solid red and blue lines), the historical range in the record between 1979 and 2010 (shaded areas) and the record lows (dotted black line). Unlike global temperature records (which only report monthly averages), sea ice data is collected and updated on a daily basis, allowing sea ice extent to be viewed up to the present.

Arctic and Antarctic daily sea ice extent from the US National Snow and Ice Data Center. The bold lines show daily 2024 values, the shaded area indicates the two standard deviation range in historical values between 1979 and 2010. The dotted black lines show the record lows for each pole. Chart by Carbon Brief.


The post State of the climate: 2024 now very likely to be warmest year on record appeared first on Carbon Brief.
State of the climate: 2024 now very likely to be warmest year on record

Drought and heatwaves occurring together – known as “compound” events – have “surged” across the world since the early 2000s, a new study shows.
Compound drought and heat events (CDHEs) can have devastating effects, creating the ideal conditions for intense wildfires, such as Australia’s “Black Summer” of 2019-20 where bushfires burned 24m hectares and killed 33 people.
The research, published in Science Advances, finds that the increase in CDHEs is predominantly being driven by events that start with a heatwave.
The global area affected by such “heatwave-led” compound events has more than doubled between 1980-2001 and 2002-23, the study says.
The rapid increase in these events over the last 23 years cannot be explained solely by global warming, the authors note.
Since the late 1990s, feedbacks between the land and the atmosphere have become stronger, making heatwaves more likely to trigger drought conditions, they explain.
One of the study authors tells Carbon Brief that societies must pay greater attention to compound events, which can “cause severe impacts on ecosystems, agriculture and society”.
Compound events
CDHEs are extreme weather events where drought and heatwave conditions occur simultaneously – or shortly after each other – in the same region.
These events are often triggered by large-scale weather patterns, such as “blocking” highs, which can produce “prolonged” hot and dry conditions, according to the study.
Prof Sang-Wook Yeh is one of the study authors and a professor at the Ewha Womans University in South Korea. He tells Carbon Brief:
“When heatwaves and droughts occur together, the two hazards reinforce each other through land-atmosphere interactions. This amplifies surface heating and soil moisture deficits, making compound events more intense and damaging than single hazards.”
CDHEs can begin with either a heatwave or a drought.
The sequence of these extremes is important, the study says, as they have different drivers and impacts.
For example, in a CDHE where the heatwave was the precursor, increased direct sunshine causes more moisture loss from soils and plants, leading to a drought.
Conversely, in an event where the drought was the precursor, the lack of soil moisture means that less of the sun’s energy goes into evaporation and more goes into warming the Earth’s surface. This produces favourable conditions for heatwaves.
The study shows that the majority of CDHEs globally start out as a drought.
In recent years, there has been increasing focus on these events due to the devastating impact they have on agriculture, ecosystems and public health.
In Russia in the summer of 2010, a compound drought-heatwave event – and the associated wildfires – caused the death of nearly 55,000 people, the study notes.

The record-breaking Pacific north-west “heat dome” in 2021 triggered extreme drought conditions that caused “significant declines” in wheat yields, as well as in barley, canola and fruit production in British Columbia and Alberta, Canada, says the study.
Increasing events
To assess how CDHEs are changing, the researchers use daily reanalysis data to identify droughts and heatwaves events. (Reanalysis data combines past observations with climate models to create a historical climate record.) Then, using an algorithm, they analyse how these events overlap in both time and space.
The study covers the period from 1980 to 2023 and the world’s land surface, excluding polar regions where CDHEs are rare.
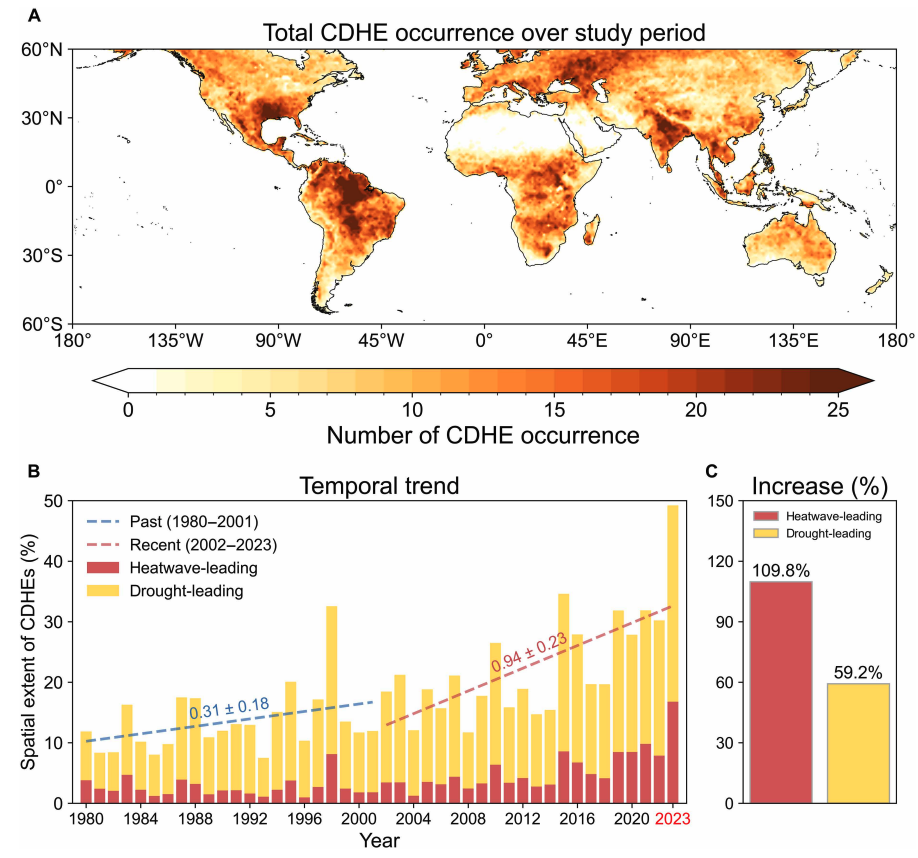
The research finds that the area of land affected by CDHEs has “increased substantially” since the early 2000s.
Heatwave-led events have been the main contributor to this increase, the study says, with their spatial extent rising 110% between 1980-2001 and 2002-23, compared to a 59% increase for drought-led events.
The map below shows the global distribution of CDHEs over 1980-2023. The charts show the percentage of the land surface affected by a heatwave-led CDHE (red) or a drought-led CDHE (yellow) in a given year (left) and relative increase in each CDHE type (right).
The study finds that CDHEs have occurred most frequently in northern South America, the southern US, eastern Europe, central Africa and south Asia.
Threshold passed
The authors explain that the increase in heatwave-led CDHEs is related to rising global temperatures, but that this does not tell the whole story.
In the earlier 22-year period of 1980-2001, the study finds that the spatial extent of heatwave-led CDHEs rises by 1.6% per 1C of global temperature rise. For the more-recent period of 2022-23, this increases “nearly eightfold” to 13.1%.
The change suggests that the rapid increase in the heatwave-led CDHEs occurred after the global average temperature “surpasse[d] a certain temperature threshold”, the paper says.
This threshold is an absolute global average temperature of 14.3C, the authors estimate (based on an 11-year average), which the world passed around the year 2000.
Investigating the recent surge in heatwave-leading CDHEs further, the researchers find a “regime shift” in land-atmosphere dynamics “toward a persistently intensified state after the late 1990s”.
In other words, the way that drier soils drive higher surface temperatures, and vice versa, is becoming stronger, resulting in more heatwave-led compound events.
Daily data
The research has some advantages over other previous studies, Yeh says. For instance, the new work uses daily estimations of CDHEs, compared to monthly data used in past research. This is “important for capturing the detailed occurrence” of these events, says Yeh.
He adds that another advantage of their study is that it distinguishes the sequence of droughts and heatwaves, which allows them to “better understand the differences” in the characteristics of CDHEs.
Dr Meryem Tanarhte is a climate scientist at the University Hassan II in Morocco, and Dr Ruth Cerezo Mota is a climatologist and a researcher at the National Autonomous University of Mexico. Both scientists, who were not involved in the study, agree that the daily estimations give a clearer picture of how CDHEs are changing.
Cerezo-Mota adds that another major contribution of the study is its global focus. She tells Carbon Brief that in some regions, such as Mexico and Africa, there is a lack of studies on CDHEs:
“Not because the events do not occur, but perhaps because [these regions] do not have all the data or the expertise to do so.”
However, she notes that the reanalysis data used by the study does have limitations with how it represents rainfall in some parts of the world.
Compound impacts
The study notes that if CDHEs continue to intensify – particularly events where heatwaves are the precursors – they could drive declining crop productivity, increased wildfire frequency and severe public health crises.
These impacts could be “much more rapid and severe as global warming continues”, Yeh tells Carbon Brief.
Tanarhte notes that these events can be forecasted up to 10 days ahead in many regions. Furthermore, she says, the strongest impacts can be prevented “through preparedness and adaptation”, including through “water management for agriculture, heatwave mitigation measures and wildfire mitigation”.
The study recommends reassessing current risk management strategies for these compound events. It also suggests incorporating the sequences of drought and heatwaves into compound event analysis frameworks “to enhance climate risk management”.
Cerezo-Mota says that it is clear that the world needs to be prepared for the increased occurrence of these events. She tells Carbon Brief:
“These [risk assessments and strategies] need to be carried out at the local level to understand the complexities of each region.”