

Rio Tinto has taken a decisive step toward reshaping the future of copper supply. The mining major announced a strategic collaboration with Amazon Web Services (AWS) that connects breakthrough mining technology with surging demand from data centers and artificial intelligence. Under the agreement, AWS became the first customer of Nuton® Technology following its successful industrial-scale deployment at the Johnson Camp copper mine in the United States.
The deal links cleaner copper production with the digital infrastructure powering the global AI economy.
How AWS Cloud Technology Is Powering Nuton’s Bioleaching Breakthrough
Nuton, a Rio Tinto venture, focuses on nature-based bioleaching technologies designed to extract copper from low-grade and previously uneconomic ores. Last month, the company achieved a major milestone by deploying its proprietary system at an industrial scale at Gunnison Copper’s Johnson Camp mine in Arizona.

The press release highlights that under the two-year agreement, AWS will use the first Nuton-produced copper in components across its U.S. data centers. Copper is essential to these facilities, playing a critical role in electrical cables, busbars, transformers, motors, printed circuit boards, and processor heat sinks.
At the same time, AWS will also provide cloud-based data and analytics to support Nuton’s operations. This digital support will speed up process optimization and improve copper recovery.
AWS platforms will simulate heap-leach performance and feed advanced analytics into Nuton’s decision systems. As a result, the company can fine-tune acid and water use. It can also better predict copper recovery.
“This collaboration with Nuton Technology represents exactly the kind of breakthrough we need—a fundamentally different approach to copper production that helps reduce carbon emissions and water use. As we continue to invest in next-generation carbon-free energy technology and expand our data centre operations, securing access to lower-carbon materials produced close to home strengthens both our supply chain resilience and our ability to decarbonize at scale.”
Microbe-Driven Copper, Digitally Scaled
Nuton’s modular bioleaching system uses naturally occurring microorganisms to extract copper from primary sulphide ores. Unlike traditional mining methods, the process avoids energy-intensive crushing, concentrating, and smelting.
When combined with digital tools, the technology can scale faster and adapt to different ore bodies. Overall, this approach shortens the path from pilot testing to full production. At the same time, it lowers environmental impact.
Shorter Supply Chains and Cleaner Copper
Additionally, Nuton’s process produces 99.99% pure copper cathode directly at the mine gate. This eliminates the need for concentrators, smelters, and refineries, significantly shortening the mine-to-market supply chain.
Compared with traditional processing routes, Nuton is expected to use substantially less water and generate lower carbon emissions. The system also recovers copper from material previously classified as waste, improving overall resource efficiency.
At Johnson Camp, these benefits are already material. The mine is now the lowest-carbon primary copper producer in the United States on a mine-to-refined-metal basis commonly used by the industry.

Verified Low Carbon and Water Footprints
A third-party life cycle assessment confirmed that Nuton copper from Johnson Camp is expected to have a full-scope carbon footprint of 2.82 kg CO₂e per kilogram of copper, covering Scope 1, 2, and 3 emissions. By comparison, global primary copper production typically ranges from about 1.5 to 8.0 kg CO₂e per kilogram, depending on technology and location.
Nuton has also matched 100% of the site’s electricity consumption by purchasing 134,000 Green-e Energy certified renewable energy certificates. Water intensity is expected to be 71 liters per kilogram of copper, well below the global industry average of roughly 130 liters.
Skarn Associates independently validated both the carbon and water intensity data. Additional environmental benefits include lower energy use, on-site clean energy generation, and zero tailings, removing the risk of tailings dam failures.
A Strategic Copper Asset for the United States
Johnson Camp is one of the largest open-pit copper projects in the U.S., with measured and indicated resources of 551 million tons at an average grade of 0.35% copper. At scale, it could supply around 8% of recent annual U.S. domestic copper production.
The project is targeting production of approximately 30,000 tonnes of refined copper over a four-year deployment period. This comes as the U.S. has formally designated copper as a critical mineral due to its importance for energy systems, digital infrastructure, and national security.

IEA and S&P Global Warn of Surging Demand and Supply Risks
The International Energy Agency (IEA) has highlighted that the rapid growth of artificial intelligence is driving a sharp expansion of data centers worldwide. While estimates vary widely, the IEA notes that copper use in data centers could reach 250,000 to 550,000 tonnes by 2030, accounting for up to 12% of global copper demand, depending on how quickly AI adoption accelerates.

At the same time, a fresh analysis from S&P Global has warned that growth in artificial intelligence, electrification, and defense could push global copper demand up by 50% by 2040. However, without major investment in new mining projects and recycling, supply is expected to fall short.

Yet, as existing copper resources age and ore grades decline, the market could face a 10 million metric ton annual supply shortfall by 2040.

Why the Rio Tinto–AWS Deal Matters
Against this backdrop, the collaboration between Rio Tinto and AWS carries strategic weight. It connects low-carbon copper supply directly with one of the world’s fastest-growing sources of demand. It also shows how digital infrastructure and nature-based mining solutions can work together to reduce emissions while expanding supply.
As AI, electrification, and energy transition pressures continue to build, innovations like Nuton’s bioleaching technology could play a critical role in closing the global copper gap—cleanly, efficiently, and at scale.
To summarize the importance of this deal, Rio Tinto Copper Chief Executive Katie Jackson said,
“This collaboration is a powerful example of how industrial innovation and cloud technology can combine to deliver cleaner, lower-carbon materials at scale. Nuton has already proven its ability to rapidly move from idea to industrial production, and AWS’s data and analytics expertise will help us to accelerate optimisation and verification across operations.
She further added:
“Importantly, by bringing Nuton copper into AWS’s U.S. data-centre supply chain, we’re helping to strengthen domestic resilience and secure the critical materials those facilities need, closer to where they’re used. Together we can supply the copper critical to modern data infrastructure while demonstrating how mining can contribute to more sustainable supply chains.”
The post Rio Tinto and Amazon Web Services (AWS) Join Forces to Supply Low-Carbon Copper for U.S. Data Centers appeared first on Carbon Credits.
Carbon tends to sit at the forefront of climate considerations, but there’s another important, interconnected piece of the sustainability puzzle that often gets overlooked: water.
Globally, 4 billion people face severe water scarcity for at least one month out of every year, according to the United Nations University Institute for Water, Environment and Health (UNU-INWEH).
Like with global warming, human activities have had a major impact on water systems. Not only are we often using too much water, but issues like land use change and rising temperatures also stress freshwater ecosystems and the water cycle.
If we ignore these issues, more water systems will be permanently damaged. That likely means more people will live with insufficient access to clean water, agricultural production will become more difficult and expensive, and many businesses will face economic risks, like supply chain delays and shortages.
Fortunately, there are ways to reduce water risks and even improve water systems.
One option is to purchase water credits. Similar to how carbon credits emerged as a solution for offsetting hard-to-avoid greenhouse gas emissions, water credits provide a market-based solution for conserving and restoring water systems.
Here, we’ll take a deeper dive into:
- What are Water Credits?
- How do Water Credit Projects Work?
- Water Credit Project Types and Examples
- Benefits of Water Credits
- Why Individuals and Businesses Should Buy Water Credits
What Are Water Credits?
If you’re familiar with carbon credits, you already get the gist of water credits.
Similar to how one carbon credit represents one metric ton of carbon dioxide equivalent avoided or removed from the atmosphere, one water credit represents 1,000 gallons of natural freshwater flow that has been improved or restored.
Water credit projects involve protecting, restoring, or conserving water flows to ultimately help natural systems like rivers, wetlands, and aquifers, along with the communities that rely on them.
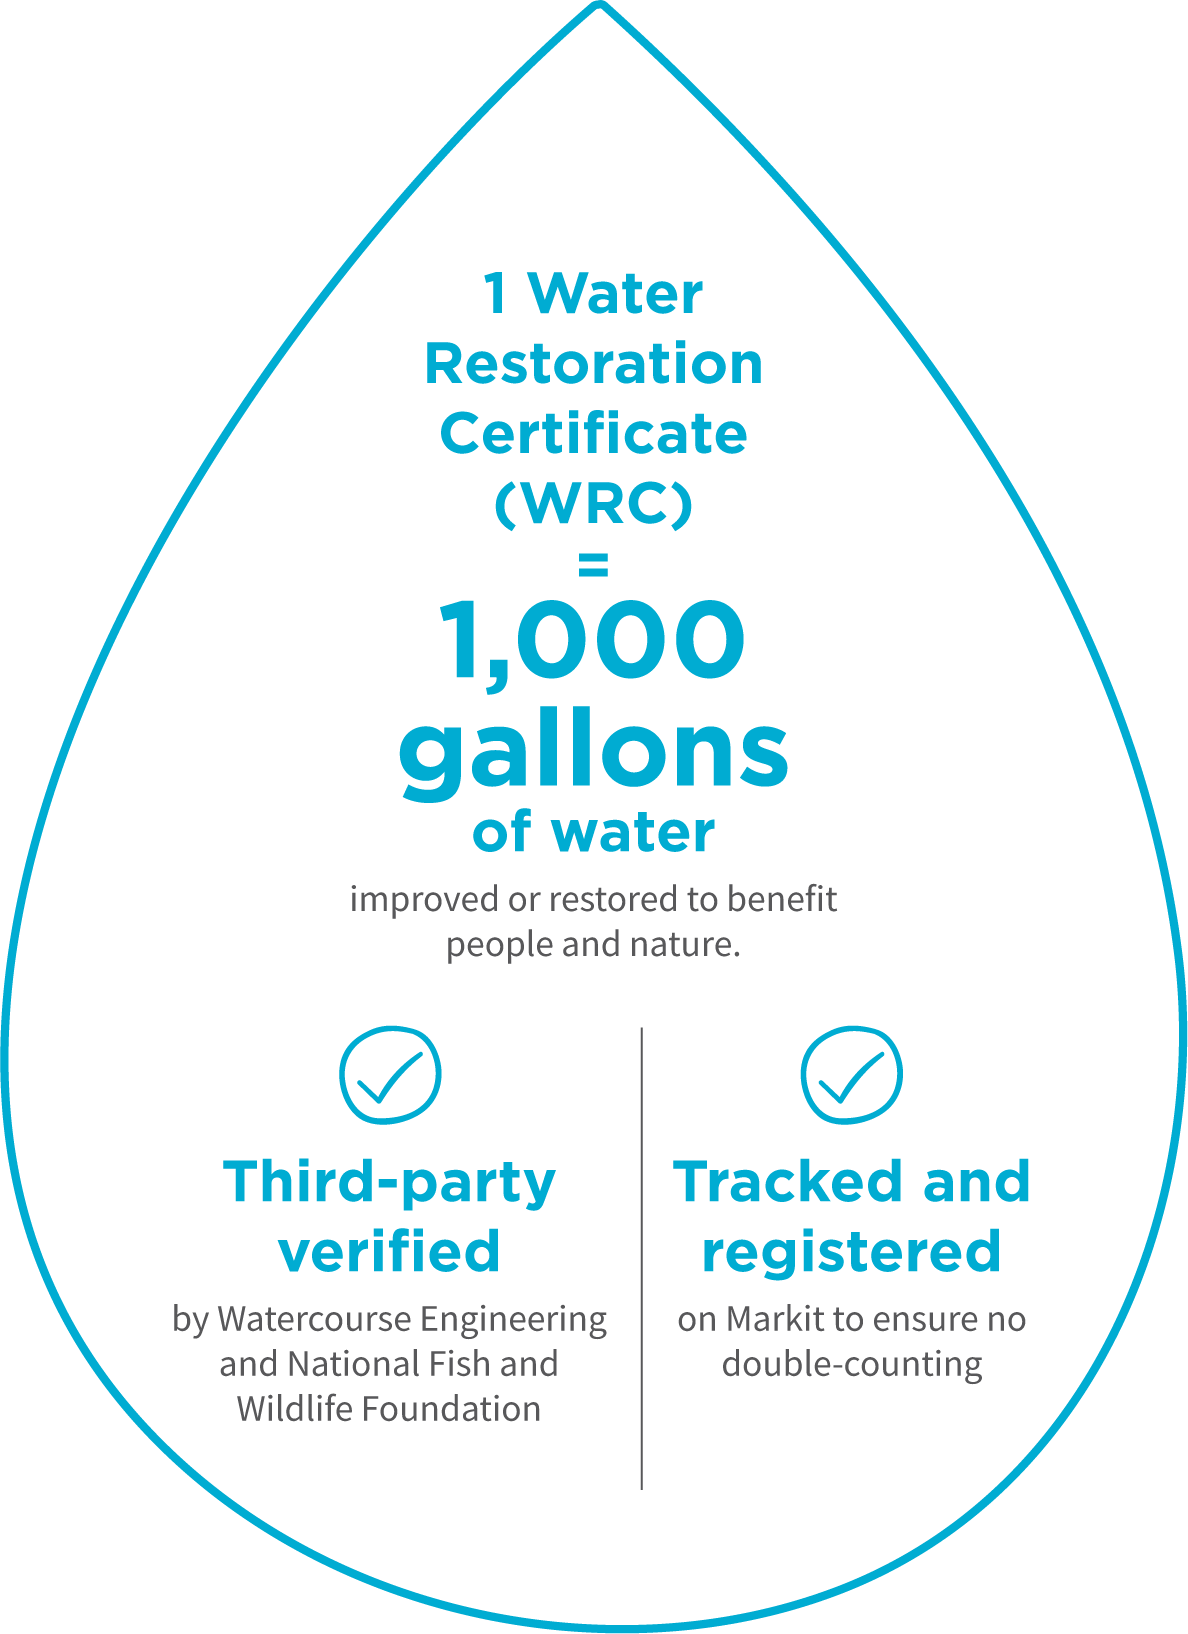
Source: Bonneville Environmental Foundation
For example, leading project developer Bonneville Environmental Foundation (BEF) issues Water Restoration Certificates® that are third-party verified, namely by Watercourse Engineering or the National Fish and Wildlife Foundation. All BEF WRC® projects are also tracked and registered on S&P Global’s Markit registry to avoid double-counting.
Other water credit programs exist, but BEF WRCs® are arguably the most established market-based solution for addressing your water footprint.
Terrapass offers BEF WRC® certificates that support projects like the Middle Deschutes River Flow Restoration project in Oregon, which in turn helps support a healthy ecosystem for local wildlife and communities.
Buy BEF WRCs® through Terrapass today.
How Do Water Credit Projects Work?
Water credit projects work similarly to carbon credit projects in terms of directing financing toward initiatives that support the restoration of natural freshwater flows and ecosystems.
Water restoration project developers like BEF work with farmers, conservation groups, and local irrigation districts to identify these opportunities and manage the projects. Water restoration projects also meet additionality requirements, meaning that without the funding from water credits, the projects would not be possible.
For example, funding might go towards the cost and effort of securing legal agreements that help restore river flows. This is necessary to help overcome challenges like “use it or lose it” water rights policies in the Western U.S. By maintaining a water source for ecological purposes, water rights holders can maintain their water rights while addressing old and inefficient requirements like the obligation to use all of their allotted water.
Note that since water issues are largely regional, best practice is to purchase credits from water restoration projects that help relieve water stress in the same basins where you’re using water. However, water credit projects are mostly concentrated in the Western U.S. where water stress is more severe, so matching projects to your location isn’t always possible. If that’s the case, buying a mixed portfolio of water credits can still compensate for your impact, it just might not directly address water issues in the areas you operate.
Water Credit Timing
Each water credit directly translates to 1,000 gallons of natural freshwater improved or restored over an 18-month cycle.
Note that while these projects might provide long-lasting water benefits, along with other associated environmental and social benefits, best practice is for buyers to only count water credits against their water footprint for the year in which these certificates are purchased.
To address your water footprint for multiple years, buyers can purchase water credits for each year they want to balance their water impact, similar to how you would purchase carbon credits corresponding to each year’s emissions.
Also note that water credits have vintages, which refer to the primary year when the water restoration took place. Like with carbon credits, best practice for water credits is to buy ones with recent vintages — generally within the last five years, but ideally within the past three. However, you don’t have to match vintages with the year of your own water consumption, as you’re still funding water improvements that help balance your own footprint.
Water Credit Project Types and Examples
BEF WRC® projects fall into one of three main categories:
- Restoring Flows: These projects often involve legal transactions like water rights transfers and partnerships with local groups to help keep water flowing in rivers and streams, rather than overly diverted, like for inefficient agricultural practices.
Example — Jordan River Flow Restoration: This project uses Environmental Water Transactions (EWTs) to help secure more water flowing from the Jordan River into the Great Salt Lake in Utah, which helps address the critical shrinking of this lake.
- Restoring Natural Systems: While similar to restoring flows, this project category focuses more on physical interventions to help restore freshwater systems like rivers and wetlands to their natural state, thereby increasing freshwater and potentially providing co-benefits like cleaner water.
Example — Pine Tree Brook Dam Removal: This project removes dams in the Pine Tree Brook in the Boston area to support the movement of local trout and improve water quality. For example, one of the dams on this brook was previously put in place to create a local ice rink, but that was no longer needed due to the 1950s construction of a nearby ice rink facility that does not rely on this water source. So, removing it helped return the brook to more of its natural order.
- Improving Efficiency: Some water credit projects focus more on conservation and efficient water use, which can thereby help retain or restore water in natural systems.
Example — Mason Lane Headgate: In Arizona, the Mason Lane Ditch diverts a tributary of the Verde River to irrigate agricultural land. This project funds the replacement of an inefficient headgate system with a modern, automated one to enable more precise control of the diverted water.
Benefits of Water Credits
In addition to directly supporting freshwater restoration, water credits provide a wide range of co-benefits, such as supporting:
- Groundwater conservation: Projects that minimize groundwater usage not only can improve water volume but also provide benefits like stabilization of river beds. That helps to avoid problems like sinking land and enables water systems to maintain natural filtration capabilities.
- Biodiversity: Water restoration projects often support biodiversity, like providing a healthier habitat for local fish and bird populations. That can provide associated environmental and economic benefits, like supporting pollinators and keeping local fisheries well-stocked.
One example of biodiversity co-benefits can be seen in the Merced County Seasonal Wetland Habitat project, which aims to provide an annual spring habitat for migratory birds in central California.
You can support projects like these by buying BEF WRCs® through Terrapass today.
- Recreation: Maintaining freshwater ecosystems helps provide communities with recreational opportunities, such as fishing, boating, and hiking. That can correlate with economic opportunities for these areas, while also supporting the health of local populations.
- Agricultural economies: The funding from water credits can directly support farmers and ranchers, providing an important income stream that can help mitigate issues like crop shortages. Long term, water credits can also support a more stable water supply that sustains these agricultural businesses season after season, even amidst increasing floods and droughts caused by climate change.
- Community empowerment: Water credits often involve working with tribal groups and other local communities. The economic, ecological, and recreational benefits can help protect these communities’ cultures and rights.
- Lower emissions: While water credits are separate from carbon credits, there can be interconnected benefits. For example, more efficient irrigation systems can use less water and energy. More reliable water supplies can also reduce the need for high-emitting fertilizers.
Why Individuals and Businesses Should Buy Water Credits
Water risk sometimes gets overshadowed by carbon emissions risk, but it’s important for both individuals and businesses to consider their water footprints. Buying water credits enables you to account for the impact of your water usage while supporting a broad range of environmental, economic, and social benefits.
In particular, consider the following:
For Individuals
You likely use far more water than you assume, particularly when accounting for indirect usage, like the water that went into making the jeans you bought. One survey from American Water found that most Americans think they use less than 100 gallons of water per day, when really total usage adds up to over 2,000 gallons daily, based on data from Water Footprint Network.
While it’s important to be mindful of your water usage, we’re all inevitably going to use water throughout our daily lives. So, purchasing water credits helps you take responsibility for the impact of this water usage while funding projects that have a wide range of co-benefits you may value.
For Businesses
Just as many companies acknowledge climate risk and commit to addressing greenhouse gas emissions, water scarcity and overuse can have direct economic effects on businesses, along with creating risks like reputational damage. By 2050, 31% of global GDP is projected to be exposed to high water stress, according to the World Resources Institute.
So, buying water credits can address your company’s direct water footprint and contribute to solving water scarcity and quality issues that can harm your operations going forward. Meanwhile, businesses can potentially increase goodwill with customers, employees, and the local communities where they operate by supporting water credit projects that have meaningful co-benefits.
Buying water credits can also align with other standards and certifications that many businesses value. Some examples include:
- WRI’s Volumetric Water Benefit (VWB) Accounting 2.0: Water credit projects can potentially align with this VWB accounting standard, and Bonneville Environmental Foundation was one of WRI’s partners involved in creating it. Still, consider looking into the details of this accounting standard and project specifics to determine alignment.
- UN Sustainable Development Goals (SDGs): Depending on the specific project, there can be benefits that align with multiple SDGs. For example, a project might align with SDG 6: Clean Water and Sanitation, while also supporting local economic development that aligns with SDG 11: Sustainable Cities and Communities.
- LEED Certification: Water credits can be matched to a building’s annual water usage and counted toward this green building certification.
- 1% for the Planet: BEF is an environmental partner of 1% for the Planet, so buying BEF WRCs® can qualify a company for membership.
- B Corp: Buying water credits can also count toward earning B Corp certification.
Ready to Support Water Restoration?
Terrapass makes it easy for you to balance your water footprint while supporting sustainable ecosystems and community development.
You can directly purchase BEF WRCs® through Terrapass today or reach out to speak with one of our sustainability experts who can help you build a custom portfolio of carbon credits and water credits that align with your sustainability goals.
Talk to a Sustainability Expert
The post The 2026 Complete Guide to Water Credits (WRCs) appeared first on Terrapass.
Carbon Footprint
Trump Admin Pays TotalEnegries $1B to Scrap Wind Projects, Putting a Hold on America’s Clean Energy Plans
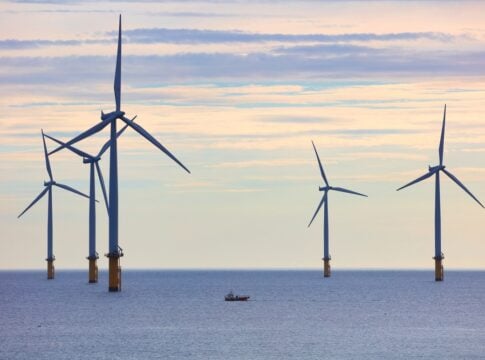
The U.S. government has agreed to pay nearly $1 billion to the French energy company TotalEnergies to cancel major offshore wind projects planned on the East Coast. The deal was announced by the Department of the Interior and represents a major shift in federal energy policy.
TotalEnergies will give up its lease holdings and invest in fossil fuel development instead. Meanwhile, the U.S. will reimburse the company for lease fees it has already paid.
This move comes as offshore wind was expected to become a key part of America’s renewable energy future. Now, it raises new questions about the future of offshore wind, the role of the federal government, and broader energy and climate strategies.
The Deal: What Happened and What It Means
Officials from the Department of the Interior and TotalEnergies announced that the company will abandon two planned offshore wind projects. These leases were located off the coasts of New York and North Carolina.
TotalEnergies will get back up to $928 million. This amount covers the money it spent on lease rights.
In return, the energy giant plans to redirect that capital toward fossil fuel development. This includes investing in liquefied natural gas (LNG) infrastructure in Texas. It also covers expanded oil and gas activities in the Gulf of Mexico and U.S. shale regions.
TotalEnergies Chair and CEO Patrick Pouyanné said:
“TotalEnergies is pleased to sign these settlement agreements with the DOI and to support the Administration’s Energy Policy. Considering that the development of offshore wind projects is not in the country’s interest, we have decided to renounce offshore wind development in the United States, in exchange for the reimbursement of the lease fees.”
The government framed the deal as a way to reduce federal exposure to expensive and “unreliable” offshore wind projects. The Interior Department described the agreement as an efficient way to shift resources toward energy sources they view as more cost‑effective.
US Interior Secretary Doug Burgum noted:
“We welcome TotalEnergies’ commitment to developing projects that produce dependable, affordable power to lower Americans’ monthly bills while providing secure US baseload power today—and in the future.”
On Hold: Offshore Wind’s Place in U.S. Energy Plans
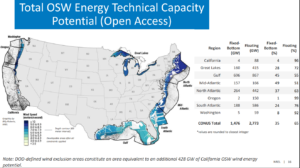
Offshore wind power has been part of U.S. climate and energy planning for years. The National Renewable Energy Laboratory (NREL) has estimated that the United States has a technical potential of:
- 1,476 GW of fixed‑bottom offshore wind resources
- 2,773 GW of floating offshore wind resources
These resources could be developed off the coasts of the Atlantic, Pacific, and Gulf of Mexico.
Despite this potential, the industry is still in its early stages. As of early 2025, the U.S. had just 174 megawatts (MW) of installed offshore wind capacity.
Several major projects were in development and construction before the recent policy shift. These included:
- Vineyard Wind 1, near Massachusetts
- Empire Wind 1, near New York
- Coastal Virginia Offshore Wind (CVOW)
- Revolution Wind
- Sunrise Wind
These projects were expected to add several gigawatts of clean energy to U.S. grids in the coming years. The federal government considered this one way to help meet broader climate goals. This was part of U.S. commitments under the Inflation Reduction Act and other climate legislation.
Now, the cancellation of TotalEnergies’ projects marks a notable change in that trajectory.
Costs, Risks, and Market Headwinds
Offshore wind is capital‑intensive and technically complex. The industry has faced cost pressures in recent years. Offshore wind development in the U.S. has high costs. Often, these expenses are several times greater than those for onshore wind installations.
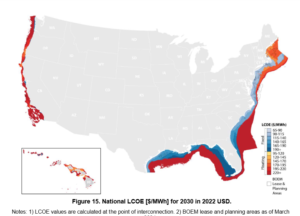
In a 2025 study, fixed-bottom projects cost about $72 to $140 per MWh, while floating wind often exceeds $150 per MWh. Capital costs range from $3,000 to $6,000 per kW, with early floating projects higher. Over time, costs may fall to $50 to $100 per MWh by 2050.
In addition to costs, developers have faced supply chain issues, regulatory delays, and scaling challenges. These factors have slowed project timelines and increased financial risk.
However, offshore wind has continued to be a key part of long‑term clean energy forecasts. A 2023 U.S. Department of Energy outlook estimates up to 30 GW of offshore wind capacity by 2030. By 2050, this could reach 110 GW if policies support growth.
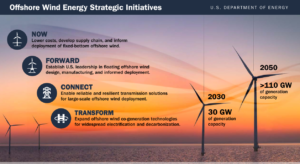
These capacity levels would help support decarbonization efforts in the power sector and contribute to electricity market diversification. Offshore wind resources are generally strongest and most consistent offshore, offering high capacity factors compared to some onshore renewables. But now that wind projects are cancelled, these clean energy goals are under strain.
Is This a Fossil Fuel Pivot?
Offshore wind is just one piece of a larger clean energy landscape. The U.S. has significantly expanded onshore wind and solar capacity in recent years, driven by federal tax incentives in the Inflation Reduction Act.
Offshore wind infrastructure includes large turbine components, subsea cabling, and port facilities. These elements have economic multipliers that can support regional supply chains and workforce development.
At the same time, fossil fuels remain a significant part of the U.S. energy mix. The Trump administration’s deal with TotalEnergies reflects federal policy that prioritizes traditional energy sources, such as natural gas and oil, alongside efforts to support domestic energy security.
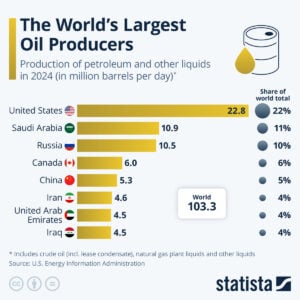
U.S. fossil fuel production remains high. In 2025, the U.S. was the world’s largest producer of crude oil and natural gas liquids combined. The country’s energy exports, including LNG, also rose sharply in recent years as global markets shifted.
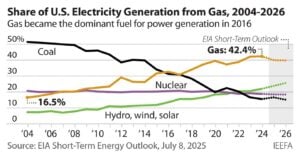
Natural gas accounts for a large share of U.S. electricity generation, usually around 40% of net generation, providing a flexible baseload power source for grids.
Global Offshore Wind Snapshot
Offshore wind development continues globally, particularly in Europe and Asia. Countries such as the United Kingdom, Germany, China, and Taiwan have deployed substantial offshore wind capacity.
Europe, for example, exceeded 30 GW of installed offshore wind capacity by the end of 2025, with continual growth projected. The global pipeline includes tens of gigawatts under development, driven by policy support and falling technology costs.
Cost reductions in turbine technology, floating wind platforms, and installation methods are expected to continue. Global forecasts project offshore wind capacity reaching 234 GW by 2030 and 2,000 GW by 2050 under the 1.5°C scenario.
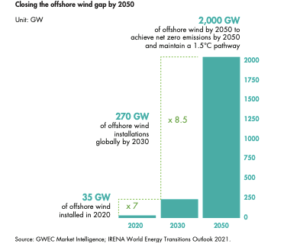
These figures indicate that offshore wind could play a major role in the energy transition worldwide — even as policies vary by region.
America’s Clean Energy Goals in Flux
The TotalEnergies deal marks a clear shift in federal energy policy. It reflects a calculated decision by the current administration to redirect capital and incentives away from offshore wind.
This decision could affect investor confidence, supply chains, and future project pipelines. Offshore wind developers have warned that a lack of federal support and policy uncertainty may hinder industry growth.
Elizabeth Klein, former director of the Department of the Interior’s Bureau of Ocean Energy Management under the Biden administration, remarked in a CNN interview that the move:
“…will actually cause a further energy deficit in our country and increase the cost of energy certainly along the East Coast… For the current administration to be cutting that off makes no sense at all.”
For states with clean energy goals, reliance on offshore wind as part of a diversified renewable portfolio may now require adjustments.
The broader climate context remains focused on reducing emissions from the power sector. Renewable energy deployment, grid modernization, and clean energy innovation continue to be key strategies for long-term decarbonization.
As the energy landscape evolves, market participants and policymakers are watching closely. What unfolds next will shape not only the offshore wind sector but the broader clean energy transition in the United States.
The post Trump Admin Pays TotalEnegries $1B to Scrap Wind Projects, Putting a Hold on America’s Clean Energy Plans appeared first on Carbon Credits.
A new beer is turning carbon removal into a real-world product. U.S.-based Aircapture and Almanac Beer have launched what they call the world’s first commercial beer carbonated using (carbon dioxide) CO₂ captured directly from the atmosphere.
The system uses direct air capture (DAC) technology. It pulls carbon dioxide from ambient air and delivers it on-site for use in brewing. The captured CO₂ replaces conventional industrial CO₂, which is usually sourced from fossil fuel processes.
The DAC unit is installed at Almanac’s brewery in California. It captures CO₂ from the air and feeds it directly into the beer carbonation process. This removes the need to transport CO₂ from external suppliers and reduces the carbon footprint of production.
While the volume of CO₂ used in beer is small, the concept is significant. It shows how captured carbon can move beyond storage and into everyday consumer products.
How Direct Air Capture Works in Practice
Direct air capture is a technology that removes CO₂ directly from the atmosphere. Unlike traditional carbon capture, which targets emissions at industrial sources, DAC works anywhere.
The process uses chemical materials to bind CO₂ from the air. The captured gas is then purified and either stored or reused. In this case, it is reused in beverage production.
Globally, DAC is still at an early stage. According to the International Energy Agency, only 27 DAC plants are operating worldwide, capturing about 0.01 million tonnes of CO₂ per year.
However, the pipeline is growing. More than 130 DAC facilities are in development, including large-scale plants that could capture over 1,000 tonnes of CO₂ per year each.
Aircapture’s model is different from many large DAC projects. Instead of building centralized plants, it installs modular units directly at industrial sites. This allows companies to use captured CO₂ on-site, reducing transport costs and emissions.
This approach fits well with industries like food and beverage, where CO₂ is already used as an input.
Why CO₂ Matters in Beer Production
Carbon dioxide plays a key role in brewing. It creates the bubbles in beer and affects taste, texture, and shelf life. Most breweries rely on industrial CO₂ supplies, often sourced from fossil fuel processes or as a byproduct of fertilizer production.
This supply chain has faced disruptions in recent years. CO₂ shortages have affected breweries across the U.S. and Europe, highlighting the risks of relying on centralized supply.
Using DAC changes this model. Breweries can produce CO₂ on-site, reducing supply risks and emissions. It also provides a way to use carbon that would otherwise remain in the atmosphere.
Damian Fagan, CEO of Almanac Beer Co., stated:
“Brewing is both science and craft. By integrating direct air capture into our production floor, we’re rethinking one of our essential ingredients and contributing to carbon-removal efforts. Instead of relying on distant industrial supply, we’re sourcing CO₂ from the air right here in Alameda. It’s local, circular, and a glimpse of what the future will look like.”
This does not make beer carbon-negative on its own. But it reduces reliance on fossil-derived CO₂ and shows how carbon can be reused in circular systems.
Almanac’s DAC unit captures 50-100 tCO₂/year, small volume, massive market signal. On-site generation cuts fossil CO₂ emissions from trucking by 20-30% in the supply chain. It also creates premium utilization credits for beverage Scope 3 or supply chain emissions.
DAC Market Set for Explosive Growth
The launch comes as interest in carbon removal technologies is rising. Governments and companies are investing in solutions that remove CO₂ from the atmosphere, not just reduce emissions.
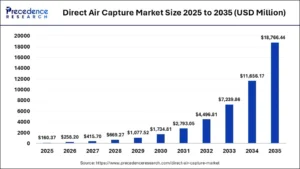
The DAC market is still small but growing fast. One estimate values the market at about $160 million in 2025, with projections reaching nearly $18.7 billion by 2035, growing at a 61% annual rate.
Other forecasts show similar trends. The market could reach over $9 billion by 2033, driven by corporate climate targets and government incentives.
This growth is supported by key factors, including:
- Net-zero commitments from major companies,
- Carbon pricing systems and policy support,
- Demand for high-quality carbon removal credits, and
- Advances in carbon capture technology.
North America currently leads the DAC market, accounting for a large share of global deployment. However, scaling remains a challenge. DAC systems require energy and infrastructure, and costs are still high compared to other climate solutions.
- SEE MORE: Deep Sky and Skyrenu Launch North America’s First Direct Air Capture (DAC) Storage Facility
From Storage to Utilization: A New Carbon Economy
Most DAC projects focus on storing CO₂ underground. This is known as carbon dioxide removal (CDR). It is essential for reaching global climate targets, especially for hard-to-abate sectors.
But there is growing interest in carbon utilization. This means using captured CO₂ as a resource rather than storing it. Common applications include:
- Synthetic fuels
- Building materials
- Chemicals
- Food and beverages
The beer project shows a simple but visible example of this shift. It turns captured carbon into a product that consumers can see and use.
While the scale is small, it helps build awareness and demand for carbon removal technologies. It also shows that DAC can integrate into existing industries without major changes to production systems.
Corporate Climate Strategies Drive Innovation
Projects like this are also linked to corporate climate goals. Many companies are looking for ways to reduce emissions across their operations and supply chains. Carbon removal is becoming part of these strategies.
Using captured CO₂ in products supports these goals. It reduces reliance on fossil inputs and creates new pathways for decarbonization.
More notably, in sectors like food and beverage, where emissions are harder to eliminate completely, these solutions can play a supporting role.
Carbon Markets Expand Beyond Offsets
The launch of a DAC-based beer highlights a broader shift in carbon markets. The focus is expanding from reducing emissions to actively removing and reusing carbon.
Carbon markets are expected to grow as demand for high-quality carbon credits increases. Many experts see carbon removal as essential for meeting global climate targets.
At the same time, new use cases for CO₂ could create additional value streams. Instead of treating carbon only as a cost, companies can use it as an input for products.
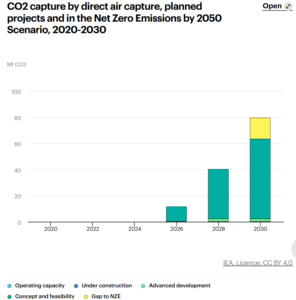
However, scale remains the key challenge. Current DAC capacity is far below what is needed. The IEA notes that global DAC deployment must reach around 65 million tonnes of CO₂ per year by 2030 to align with net-zero pathways. This will require major investment, policy support, and technological progress.
A Small Beer with a Big Climate Message
The beer itself is a niche product, but the idea behind it is larger. It shows how carbon removal can move into everyday life and consumer markets.
By turning captured CO₂ into a usable product, companies can demonstrate the value of climate technologies in simple terms. This can help build public support and encourage further investment.
The project also highlights a key trend. Climate solutions are becoming more integrated into business operations, not just separate offset programs.
For now, a single beer will not change global emissions. But it offers a glimpse of how carbon could be managed differently in the future, not just emitted or stored, but reused in practical ways.
The post From Air to Ale: Introducing the First-of-its-Kind Beer Made with Captured Carbon appeared first on Carbon Credits.


-
Greenhouse Gases8 months ago
Guest post: Why China is still building new coal – and when it might stop
-
Climate Change8 months ago
Guest post: Why China is still building new coal – and when it might stop
-

 Greenhouse Gases2 years ago
嘉宾来稿:满足中国增长的用电需求 光伏加储能“比新建煤电更实惠”
-
Climate Change2 years ago
Bill Discounting Climate Change in Florida’s Energy Policy Awaits DeSantis’ Approval
-

 Climate Change2 years ago
嘉宾来稿:满足中国增长的用电需求 光伏加储能“比新建煤电更实惠”
-
Climate Change Videos2 years ago
The toxic gas flares fuelling Nigeria’s climate change – BBC News
-

 Carbon Footprint2 years ago
US SEC’s Climate Disclosure Rules Spur Renewed Interest in Carbon Credits
-

 Renewable Energy5 months ago
Sending Progressive Philanthropist George Soros to Prison?