Recent weeks have seen a flurry of reports from public health authorities and scientists that estimate the deaths caused by Europe’s record-breaking summer heatwaves.
In France, the national public health agency reported 2,025 excess deaths over the week where the heatwave peaked in June.
Authorities in Germany and Netherlands put the excess death toll during the same seven-day period at 5,753 and 533, respectively.
An analysis from climate scientists in Carbon Brief found that France saw more than 2,700 heat-related deaths over 17 days in June.
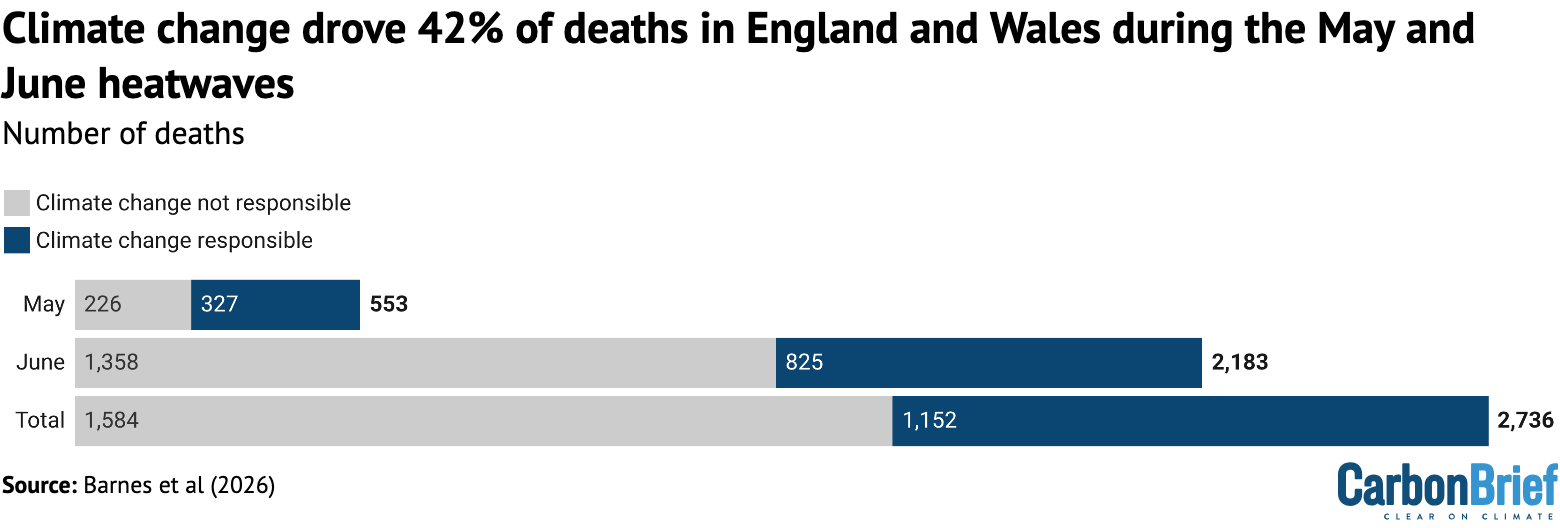
Separate research estimated there had been 2,700 heat-related deaths in the UK’s May and June heatwaves – 42% of which had been caused by human-caused climate change.
There are a number of methods for how academics and governments tally deaths caused by extreme heat, each with their own advantages and drawbacks.
Here, Carbon Brief looks at the different ways scientists and public health authorities have calculated the death toll of Europe’s record-breaking summer heat.
- How established is the science of calculating heat deaths?
- What are the different approaches to counting heat deaths?
- What do the latest figures show for Europe’s May and June heatwaves?
- What are the pros and cons of the ‘excess deaths’ method?
- What are the pros and cons of the ‘statistical modelling’ method?
How established is the science of calculating heat deaths?
Economists and epidemiologists have been studying the relationship between heat and mortality for nearly a century.
A pioneering study published in 1923 by geographer Ellsworth Huntington and economist Margaret Justin that looked at mortality data for New York City over 1882-88 found that deaths increased rapidly as temperatures rose above 17C.
As global temperatures have risen in response to human-caused carbon emissions, scientists have increasingly sought to understand how warming could impact mortality.
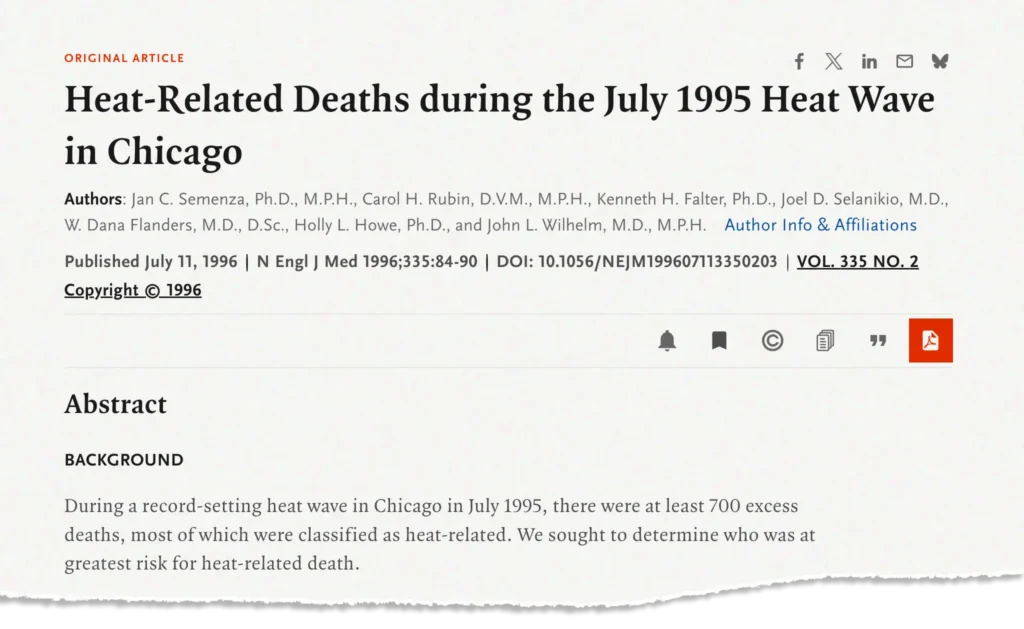
The study of mortality caused by specific heatwave events dates back a few decades, with a 1995 heatwave in Chicago among the earliest events to be studied in detail.
Over the past decade, a growing number of studies have gone a step further, by estimating the number of deaths caused by a specific heatwave event and then attributing a percentage or number of those deaths to human-caused climate change.
Carbon Brief covered the first study of this type, which was published in Environmental Research Letters in 2016 and focused on a 2003 summer heatwave that caused tens of thousands of deaths across Europe.
The study estimated that 506 of the 735 summer fatalities in Paris and 64 of the 315 in London were a result of human influence on the climate.
More recently, a study in Climatic Change found that 27% of deaths in a 2018 heatwave in Zurich, Switzerland were linked to human-caused climate change and a paper in Science Advances estimated that 11-15% of deaths in a 2021 heatwave in British Columbia were attributable to global warming.
Dr Christopher Callahan, assistant professor at the O’Neill School of Public and Environmental Affairs at Indiana University, tells Carbon Brief this type of “two-step” study has “really exploded” in recent years:
“It is really only in the last five to 10 years that we have seen this, partly because it does require interdisciplinary expertise. You need people who know how to run the epidemiological models and you need a climate analysis of the counterfactual [world] without climate change, which is its own effort.”
What are the different approaches to counting heat deaths?
A central challenge in estimating deaths from a heatwave is that heat is rarely recorded as the primary cause of death on death certificates.
However, exposure to high temperatures has wide-ranging effects on the human body, including the strain of keeping cool. This effort places pressure on the heart and kidneys.
As a result, heat extremes can worsen health risks from chronic conditions and cause acute kidney injury. Researchers have linked heat to increased mortality from respiratory and cardiovascular diseases, as well as dementia and Alzheimer’s.
As a result, public health authorities and scientists cannot depend on death certificates for a full count of heat-related deaths. They instead estimate heat deaths using a number of different approaches, each with assumptions baked into their calculations.
Dr Garyfallos Konstantinoudis, who researches methods for calculating excess mortality due to extreme events at the Grantham Institute for Climate Change and the Environment at Imperial College, tells Carbon Brief there is “no ground truth” when it comes to tallying heat-related deaths:
“We don’t know what the heat-related deaths are, so we rely on different models to describe the picture.”
This makes the study of deaths from heatwaves similar to those from air pollution, he says:
“This sort of health-impact assessment has been done for years on studies related to deaths from air pollution, which have the same problem. Air pollution, until very recently, was not recorded on death certificates.
“[However], for air pollution, the [scientific] literature is much larger, so no one questions that air pollution is toxic and kills. This sort of messaging for heat is more recent.”
There are, broadly speaking, two approaches to calculating deaths during a heatwave.
The first involves counting the number of excess deaths relative to a period in the past.
This method – often referred to as an “excess deaths” approach – looks at how many people died during a particular time period compared to a baseline period where there was no heatwave.
To do this, public health authorities and researchers rely on official death figures reported by country authorities.
The heat death tolls published in recent weeks by public health agencies in Belgium, France, Germany and the Netherlands relied on this approach.
(For more, see: What are the pros and cons of the ‘excess deaths’ method?)
The second method uses long-term mortality data to understand the statistical relationship between temperature and mortality in a given place. The model that emerges can be used to infer the number of deaths from a heatwave in that place.
In a rapid analysis published this week, researchers at Imperial College London, the London School of Hygiene and Tropical Medicine (LSHTM) and the Met Office used this approach to estimate that the May and June heatwaves in the UK caused the deaths of 2,700 people.
Dr Callahan – working with Prof Andrew Dessler, director of the Texas Center for Extreme Weather at Texas A&M University – used this method to estimate that more than 2,700 people had died in France over a 17-day period in June in an analysis for Carbon Brief.
(For more: see: What are the pros and cons of the ‘statistical modelling’ method?)
The majority of the figures released in the wake of Europe’s June heatwave have relied on these two methods.
There is a third way to calculate heat deaths, which is to look at official counts of deaths attributed on death certificates to heatstroke.
Callahan tells Carbon Brief that the “death-certificate coding” appears to have fallen out of favour in Europe – which he says is a “smart move” given that it does not provide a “full accounting”.
Nevertheless, some public health authorities are still using this method. For example, in the wake of the heatwave in the US earlier this month, public health data showed 29 people in New Jersey and three people in New York had died from “heat-related illnesses”.
Scientists tell Carbon Brief the excess deaths and statistical modelling approaches both have advantages and drawbacks. These are explored below.
What do the latest figures show for Europe’s May and June heatwaves?
The table below shows the death numbers that have been reported by governments and researchers for Europe’s May and June heatwaves, including the approach used to reach the figures.
It suggests that multiple countries in Europe experienced more than 1,000 heat-related deaths during the late June heatwave, with authorities in Germany counting more than 5,000.
Meanwhile, the EuroMoMo mortality monitoring system estimated there were more than 10,500 excess deaths across 27 countries during the June heatwave.
| Reported | Source | Country / region | Dates | Days | Deaths | Link | Approach |
|---|---|---|---|---|---|---|---|
| 28/06/2026 | Public Health France | France | 22-27 June | 6 | 1,000 | santepubliquefrance.fr | Excess deaths |
| 29/06/2026 | World Health Organization | Europe | 21-28 June | 8 | 1,300 | x.com/DrTedros/status | Excess deaths |
| 01/07/2026 | Carlos III Health Institute (MoMo) | Spain | 1-30 June | 30 | 1,033 | dw.com | Excess deaths (all-cause and temperature-attributable) |
| 02/07/2026 | National Institute for Public Health and the Environment | Netherlands | 22-28 June | 7 | 480 | rivm.nl | Excess deaths |
| 03/07/2026 | Public Health France | France | 22-28 June | 7 | 2,025 | santepubliquefrance.fr | Excess deaths |
| 07/07/2026 | Chris Callahan/Andrew Dessler | France | 12-29 June | 18 | 2,766 | carbonbrief.org | Statistical modelling |
| 08/07/2026 | Chris Callahan | Europe | 15-28 June | 14 | 13,975 | zenodo.org | Statistical modelling |
| 08/07/2026 | Sciensano | Belgium | 18 June – 1 July | 14 | 1,747 | brusselstimes.com | Excess deaths |
| 09/07/2026 | Robert Koch Institute | Germany | 22-28 June | 7 | 5,120 | rki.de | Statistical modelling |
| 13/07/2026 | Met Office/LSHTM/Imperial | England and Wales | 22-27 June | 6 | 2,183 | drive.google.com | Statistical modelling |
| 13/07/2026 | Met Office/LSHTM/Imperial | England and Wales | 24-26 May | 3 | 553 | drive.google.com | Statistical modelling |
| 13/07/2026 | EURO Mo/Mo | 27 European countries | 22-28 June | 7 | 10,650 | reuters.com | Excess deaths |
| 07/07/2025 | National Institute for Public Health and the Environment | Netherlands | 22-28 June | 7 | 577 | archive.ph | Excess deaths |
| 14/07/2026 | Germany Federal Statistical Office (Destatis) | Germany | 22-28 June | 7 | 5,753 | destatis.de | Excess deaths |
In most instances, Carbon Brief has linked to the figures published by public health authorities, where numbers were first reported. In some instances, figures were released on dashboards or webpages that are updated weekly. In these cases, Carbon Brief has linked to media reports or archived web content.
What are the pros and cons of the ‘excess deaths’ method?
The excess deaths approach looks at how many more people died during a particular time period compared to a baseline period of the same length.
For instance, on 14 July, Germany’s federal statistics agency, Destatis, published figures showing Germany saw 32% more deaths than the average in the week of 22-28 June, which was dominated by the heatwave.
Specifically, the agency said that 23,932 deaths had been recorded that week, compared to an average of 18,179 in that calendar week across the years 2022-25.
This suggests there were 5,753 excess deaths during the heatwave week. (This was a slight increase from preliminary Destatis figures released a week earlier, covered by Bloomberg.)
The Netherlands similarly calculates excess deaths by comparing death figures against an average of deaths in a similar period during unspecified “previous years”.
Data published by the country’s National Institute for Public Health and the Environment (RIVM) shows that, during the week of 22-28 June, an estimated 3,626 people died in total in the northern European country.
This is 577 more deaths than the 3,049 expected at that time of year, it said. (This is a slight revision upwards from the 480 excess deaths reported on 4 July by NL Times based on preliminary figures from NVIM.)
Callahan says that the excess deaths approach has the benefit of being rapid and relatively uncomplicated:
“It is something that public health authorities can put out fairly quickly without having to run a fancy model and do coding like the academic scientists do. It is a short-term, high-impact, rapid estimate of mortality.”
The drawback to the approach is that it is impossible to decipher what percentage of these “all-mortality” excess deaths are, in fact, heat-related.
Imperial College’s Konstantinoudis notes that the public often “feels more comfortable” with the excess deaths approach over the statistical modelling approach because the data it is using – the official death numbers – is based on real-world data.
However, he stresses that excess deaths figures are based on a series of assumptions, including the reference period picked by researchers and how the numbers are interpreted.
Statisticians and researchers have to make a series of decisions, including what period to use as a comparative baseline. For example, the baseline period could be the week before a heatwave, the same week a year before – or an average of the same week across multiple years in the past. If averaging mortality of a similar period across a number of previous years, they must decide how much “weight”, or influence, each year should have.
They must also decide how to account for spikes in deaths during the Covid-19 pandemic years, as well as the gradual rise in average temperatures due to global warming.
During the pandemic, many governments and the World Health Organization (WHO) used the excess deaths approach to count deaths. The WHO said this metric was more “comparable” and “objective” than relying on national reports of Covid-19 deaths, given that different countries used different criteria for this classification.
A notable example of how assumptions can skew excess death figures came during this period, when the WHO estimated in 2022 that Germany had seen 195,000 excess deaths over two years of pandemic.
However, after statisticians and epidemiologists pointed out the assumptions in the model were not suited to Germany’s demographics, the WHO retracted the figure and eventually reduced it to 122,000 and then later to 102,000.
Konstantinoudis explains:
“Covid taught us that it is complicated. Depending on the different assumptions used in the excess-mortality approach, you get different results…There is a scientific basis, but we should acknowledge the assumptions.”
What are the pros and cons of the ‘statistical modelling’ method?
In the statistical modelling approach, researchers use models to determine the specific relationship between mortality and temperature for a particular location and then apply it to temperatures observed during a heatwave.
This allows them to estimate the overall number of deaths that were caused by a heatwave.
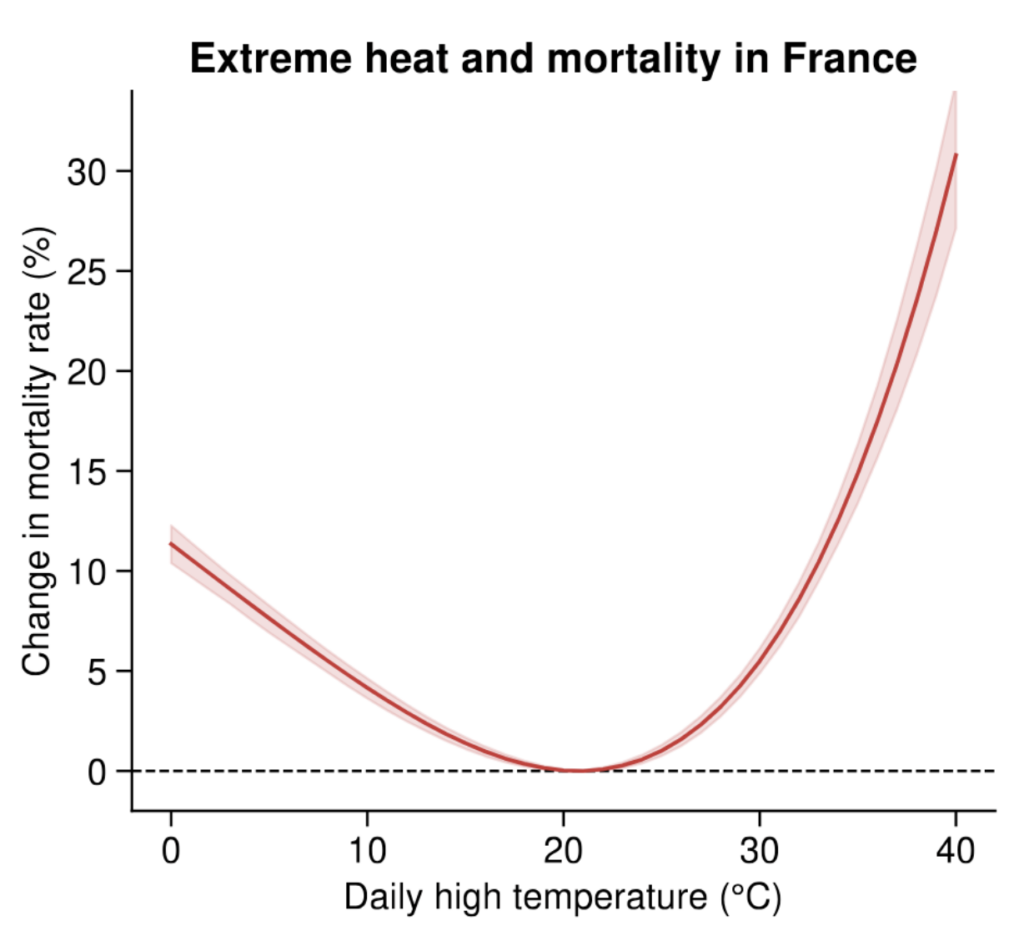
Previous research has revealed that, in most places of the world, there is a U-shaped response of mortality to temperature – where deaths increase rapidly in cold or hot conditions as daily maximum temperatures depart further from an “optimum temperature”.
For example, research published in Proceedings of the National Academy of Sciences in 2025 found that mortality rates in France rise as daily maximum temperatures move away from approximately 20C. This is shown in the chart below.
Indiana University’s Callahan say this approach allows scientists to “formally establish a relationship between the temperature and the mortality”, adding:
“If you do these calculations right, you can credibly say your entire estimate of mortality is heat-related.”
Prof Antonio Gasparrini, biostatistician and epidemiologist at LSHTM, explains the method relies on “timeseries models that apply relatively sophisticated statistical methods in which you ‘smooth’ trends occurring in time, so you control for long-term trends and seasonality”.
He says that these models also allow researchers to “remove” trends affecting mortality that are unrelated to heat – for instance, the impacts of the pandemic. They can also “add” other information, such as around how air pollution combines with heat to threaten vulnerable populations.
Gasparrini adds:
“What statistical modelling can bring is that it is more refined. It can link specific temperatures to specific impacts rather than just looking at the event [in the whole]. And also, it can be localised – [data] can be stratified at a fine scale and we can look at impacts at different scales.
“So, it is more informative. But, at the same time, of course, it’s based on more assumptions than the [excess deaths approach] and, of course, needs to be checked and compared.”
The approach depends on a number of judgment calls from scientists and statisticians, including the years picked to underpin the model and how to capture the lag in deaths in the days and weeks after a heatwave event.
They must also decide at what threshold to start counting deaths – in other words, whether to count all deaths above the “optimum temperature” or set a higher, more extreme value – and whether and how to account for any adaptation to heat extremes that may have been put in place in the study area.
A benefit of the statistical modelling approach is that it opens the door for being able to attribute a specific number of deaths to human-caused climate change.
By applying the temperature-mortality curve to both the temperatures of the recent heatwave and a counterfactual world without climate change, scientists can estimate what proportion of estimated deaths only occurred because the world is warming.
For instance, Imperial College, LSHTM and Met Office researchers found that 59% and 38% of heat-related deaths in the UK’s May and June heatwaves, respectively, could be attributed to climate change. Their findings are shown in the chart below.
Some climate-sceptic commentators have argued that modelled estimates are hypotheses and should therefore be treated with caution.
On 13 July, climate-sceptic news website GB News covered a blog post by Oxford academics that argued the figure that 2,700 people had died in the UK’s May and June heatwaves was not reflected in the provisional “all-mortality” data put out by the UK’s Office for National Statistics (ONS). Quoting the blog, GB News said:
“Modelling tells us nothing. Models explore possibilities; surveillance tells us what happened. When the two disagree, our instinct should be to investigate the data rather than simply trust the model.”
However, Imperial’s Konstantinoudis – who worked on the models behind the 2,700 figure – says it is important to await the UK Health and Security Agency (UKHSA)’s annual heat mortality report before arriving at any conclusions. He explains:
“While we are entirely clear that our current findings are modelled estimates, this methodology has consistently delivered comparable results to the UKHSA’s own official analyses of observed deaths for past heat events.”
(The UKHSA report will include updated figures and estimate excess deaths from heat based on specific periods of heat in different regions, whereas the provisional ONS figures cover all national deaths during a full-week period.)
Konstantinoudis says both the excess deaths and statistical modelling approaches have been the subject of extensive peer-reviewed scientific study and can provide a “holistic view of what is happening” when used together.
Studies that have compared statistical modelling approaches for estimating heatwave deaths with excess death figures in the UK have found they yield broadly similar results.



The post Q&A: Europe’s May and June heatwave deaths – and how they were counted appeared first on Carbon Brief.
Q&A: Europe’s May and June heatwave deaths – and how they were counted

Three countries have been named by the Paris Agreement’s compliance committee for failing to submit a nationally determined contribution (NDC) and repeatedly snubbing offers of help with their climate plans.
After months of internal debate over whether to identify serial non-responders, the Paris Agreement’s Implementation and Compliance Committee (PAICC) named the three countries which have failed to engage with it over their NDCs on Friday.
It named Democratic Republic of Congo, Senegal and North Korea in a footnote of its annual report, adding that it decided to name them “with a view to facilitating engagement”, adding that representatives of the three nations had been invited to its meeting in early 2027 “with the purpose of identifying any challenges and constraints”.
“The Committee noted the importance of Parties engaging with the Committee in a timely manner, while noting that some delays may be due to the national capabilities and circumstances of the Parties”, the report said.
-
Under US pressure, World Bank says it will back gas “where appropriate”
The US wants the World Bank to expand its gas support while climate campaigners are pushing for it to end – its head spoke this week of limited backing for the fossil fuel -
IPCC scientists vow to press on with climate reports despite political deadlock
After governments again failed to agree a timeline, nearly 120 IPCC authors pledged to complete their assessment on time and with full scientific rigour