

Hundreds of scientists in dozens of institutions are embarking on the next phase of the world’s largest coordinated climate-modelling effort.
Climate-modelling groups use supercomputers to run climate models that simulate the physics, chemistry and biology of the Earth’s atmosphere, land and oceans.
These models play a crucial role in helping scientists understand how the climate is responding as greenhouse gases build up in the atmosphere.
For four decades, the Coupled Model Intercomparison Project (CMIP) has guided the work of the climate-modelling community by providing a framework that allows for millions of results to be collected together and compared.
The resulting projections are used extensively in climate science and policy and underpin the landmark reports of the Intergovernmental Panel on Climate Change (IPCC).
Now, the seventh phase of CMIP – CMIP7 – is underway, with more than 30 climate-modelling centres expected to contribute more than five million gigabytes of data – so much that downloading it using a fast internet connection would take two and a half years.
Here, we look at what is new for CMIP7, including its model experiments, updated emissions scenarios and “assessment fast track” process.
What is CMIP?
Around the world, climate models are developed by different institutions and groups, known as modelling centres.
Each model is built differently and, therefore, produces slightly different results.
To better understand these differences, CMIP coordinates a common set of climate-model experiments.
These are simulations that use the same inputs and conditions, allowing scientists to compare the results and see where models agree or differ.
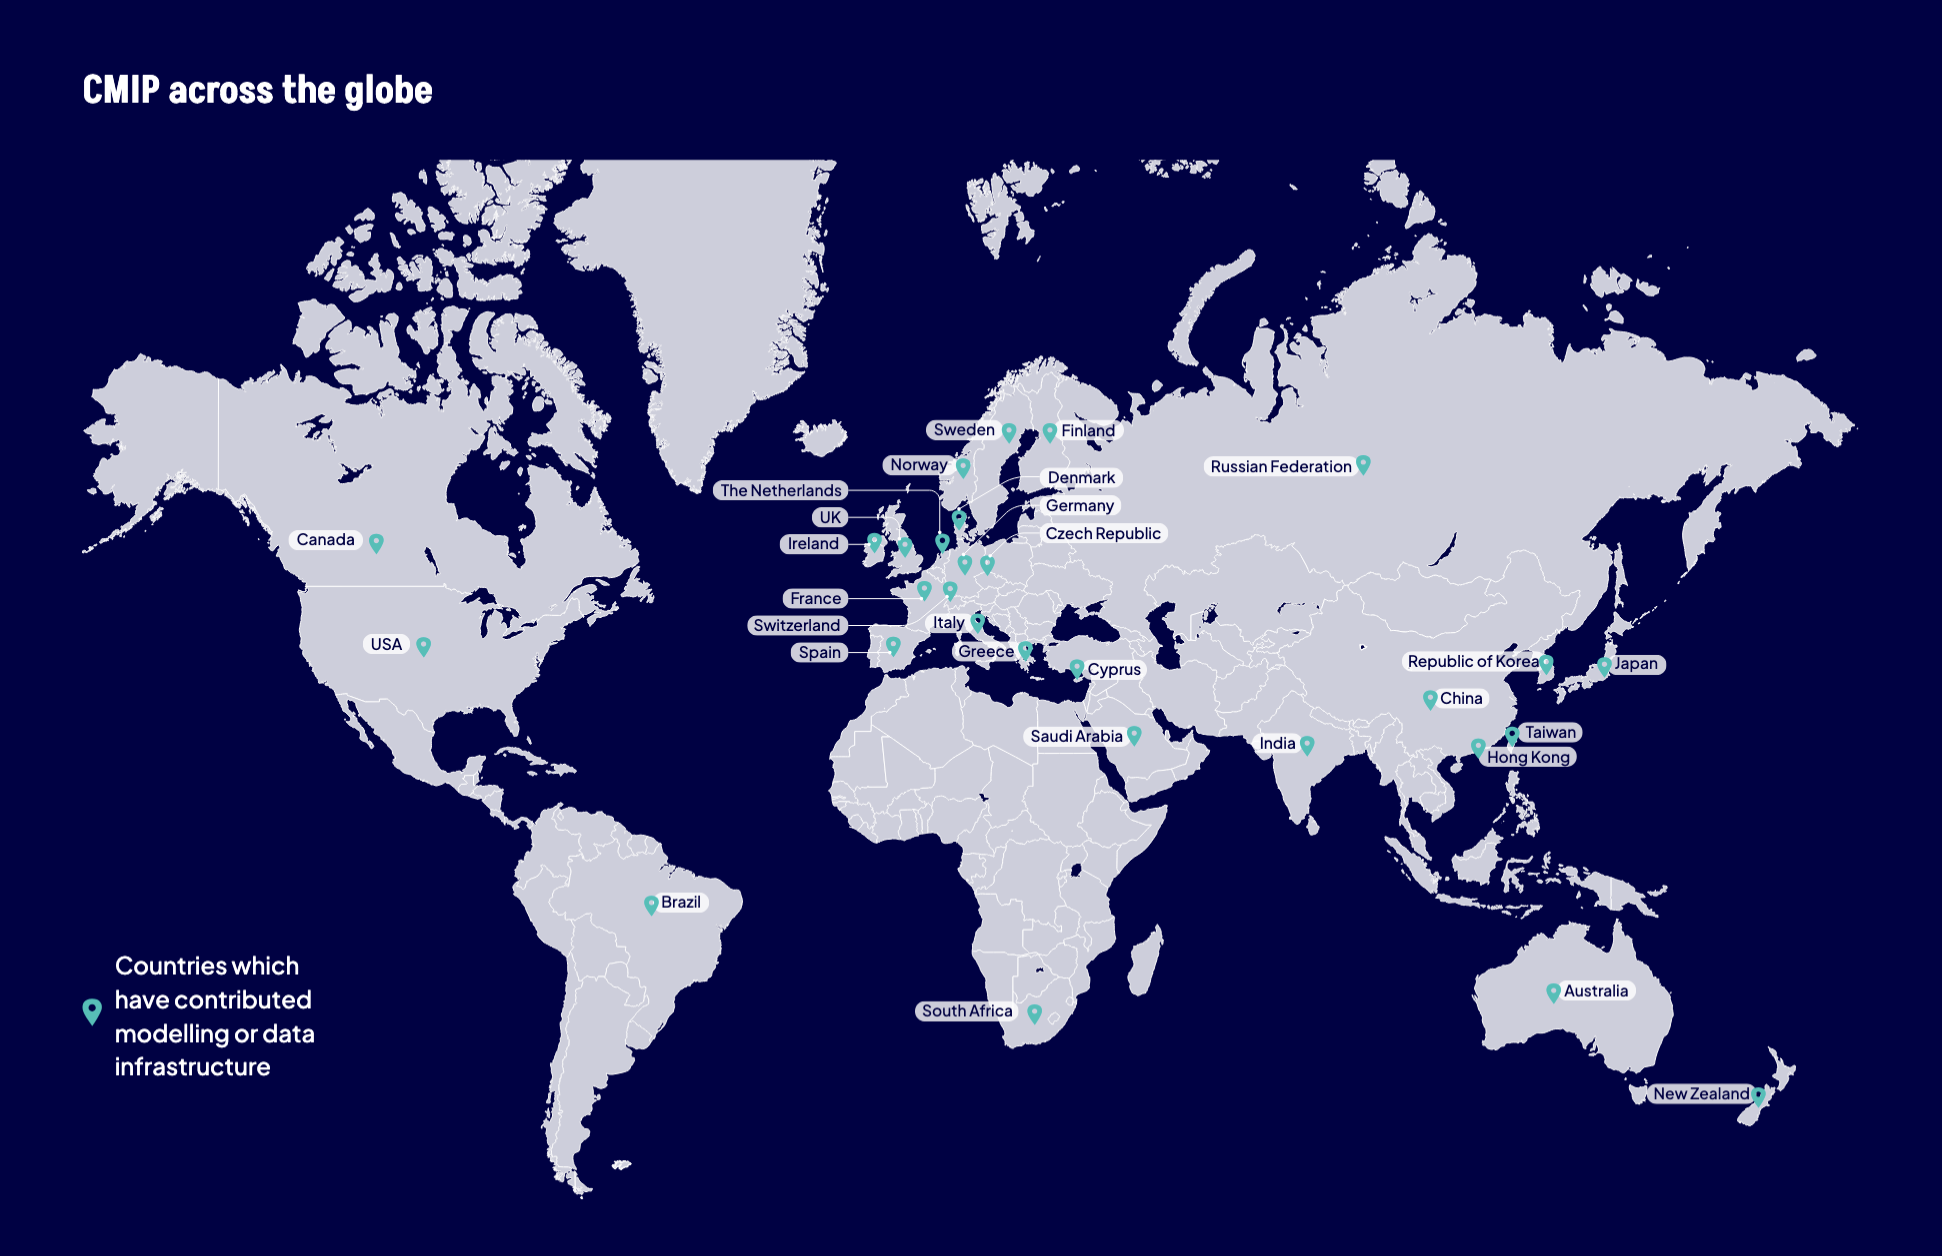
The figure below shows the countries that have either produced or published CMIP simulations.
During this time, scientists use new and improved models to run experiments from previous CMIP phases for consistency, as well as new experiments to investigate fresh scientific questions.
These simulations produce a trove of data, in the form of variables – such as temperature, rainfall, winds, sea ice extent and ocean currents. This information helps scientists study past, present and future climate change.
As scientific understanding and technical capabilities improve, models are refined. As a result, each CMIP phase incorporates higher spatial resolutions, larger ensembles, improved representations of key processes and more efficient model designs.
CMIP7 objectives
Each CMIP phase has an “experimental design” that outlines which climate-model experiments should be run and their technical specifications, including the time period the models should simulate.
The CMIP7 experimental design has several components.
As in CMIP6, for a modelling centre to contribute, they are asked to produce a suite of experiments that maintain continuity across past and future CMIP phases.
This suite of experiments is known as the “diagnostic, evaluation and characterisation of klima” (DECK) and is used to understand how their model “behaves” under simple, standard conditions. These experiments are designed and requested directly by CMIP’s scientific governing panel.
Alongside the DECK, CMIP also incorporates experiments developed by model intercomparison projects (MIPs) run by different research communities. For example, experiments exploring what the climate could look like under different levels of emissions or those that explore how sea ice might have changed between the last two ice-ages.
Currently, CMIP is working with 40 MIPs. These groups investigate specific scientific questions at their own pace, rather than on timelines prescribed by CMIP.
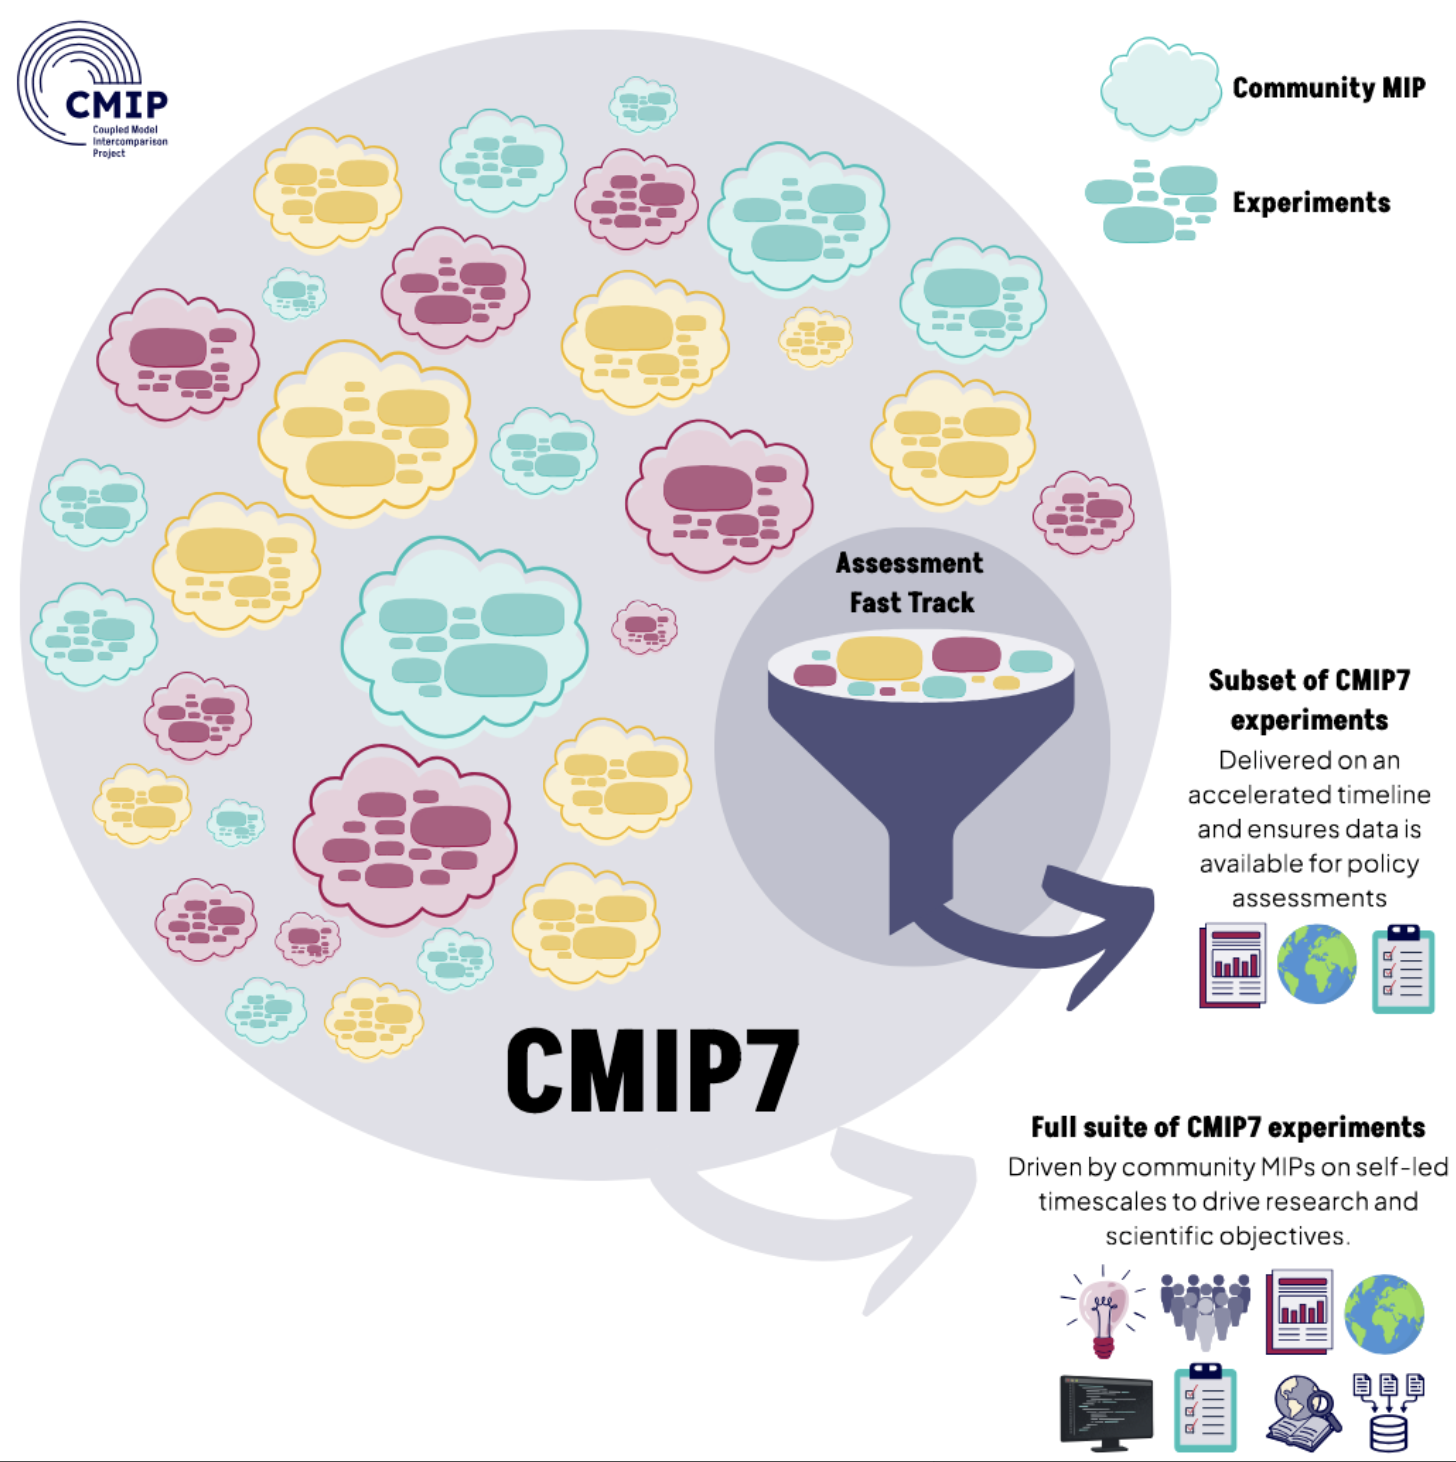
Running a large number of simulations can take modelling centres a long time. To speed up the process, CMIP7 has launched the “assessment fast track”.
This is a small subset of CMIP7 experiments, drawn from past and present community MIPs, identified through community consultation as being critical for scientific and policy assessments.
Data from the assessment fast track will be used in the reports that will together form the seventh assessment (AR7) of the IPCC.
It will also be used as an input by other groups that create climate information, including organisations involved in regional downscaling and modelling climate impacts and ice-sheet changes.
The figure below shows the different components of CMIP7. It shows how a subset of CMIP7 experiments will be delivered on an accelerated timeline, while the majority of experiments will be led by MIPs.
CMIP7 experiments
There are three categories of experiments set to take place in CMIP7:
- Historical experiments, which are designed to improve scientific understanding of past climates. Model runs exploring the recent historical period also allow scientists to evaluate the performance of models by checking how well they replicate real-world observations.
- Prediction and projection experiments, which allow scientists to analyse what different climates could look like under varying levels of greenhouse gas emissions, as well as near-term (10-year) prediction experiments.
- Process understanding experiments, which are designed to better understand specific processes and isolate cause-and-effect relationships. For example, a set of experiments might change the emissions of one greenhouse gas at a time to see how much each pollutant contributes to warming or cooling the climate.
Modelling centres typically produce and publish their data for the historical and projection experiments first.
CMIP expects the first datasets to be available by this summer, with broader publication recommended by the end of the year, in time to be assessed by IPCC AR7 authors.
Drafting of the reports of AR7 is currently underway. However, countries are yet to agree on the timeline for when they will be published. This presents a challenge for the climate-modelling community, given the difficulties of working with a moving deadline.
(For more on the ongoing standoff between countries around the timing of publication of the reports, read Carbon Brief’s explainer.)
New emissions scenarios
Scientists use emissions scenarios to simulate the future climate according to how global energy systems and land use might change over the next century.
Crucially, these scenarios – also known as “pathways” – are not forecasts or predictions of the future.
The group tasked with designing the scenarios for CMIP phases, as well as producing the “input files” for climate models, is the “scenario model intercomparison project”, or ScenarioMIP.
In a new paper, the group has set out the new set of scenarios for CMIP7:
- High (H): Emissions grow to as high as deemed plausibly possible, consistent with a rollback of current climate policies. This scenario will result in strong warming.
- High-to-low (HL): Emissions rise as in the high scenario at first, but are cut sharply in the second half of the century to reach net-zero by 2100.
- Medium (M): Emissions consistent with current policies, frozen as of 2025, leading to a moderate level of warming.
- Medium-to-low (ML): Emissions are slowly reduced, eventually reaching net-zero emissions by the end of the century.
- Low (L): Emissions consistent with likely keeping warming below 2C and not returning to 1.5C before the end of the century.
- Very low (VL): Emissions are cut to keep temperatures “as low as plausible”, according to the paper. This scenario limits warming to close to 1.5C by the end of the century, with limited overshoot beforehand.
- Low-to-negative (LN): Emissions fall slightly slower than in the VL scenario, with temperatures just rising above 1.5C. Emissions then rapidly drop to negative to bring warming back down.
The figures below show the emissions (left) and the estimated global temperature changes (right) under the seven new scenarios for CMIP7, from the low-to-negative emissions scenario (turquoise) to a high-emissions scenario (brown).
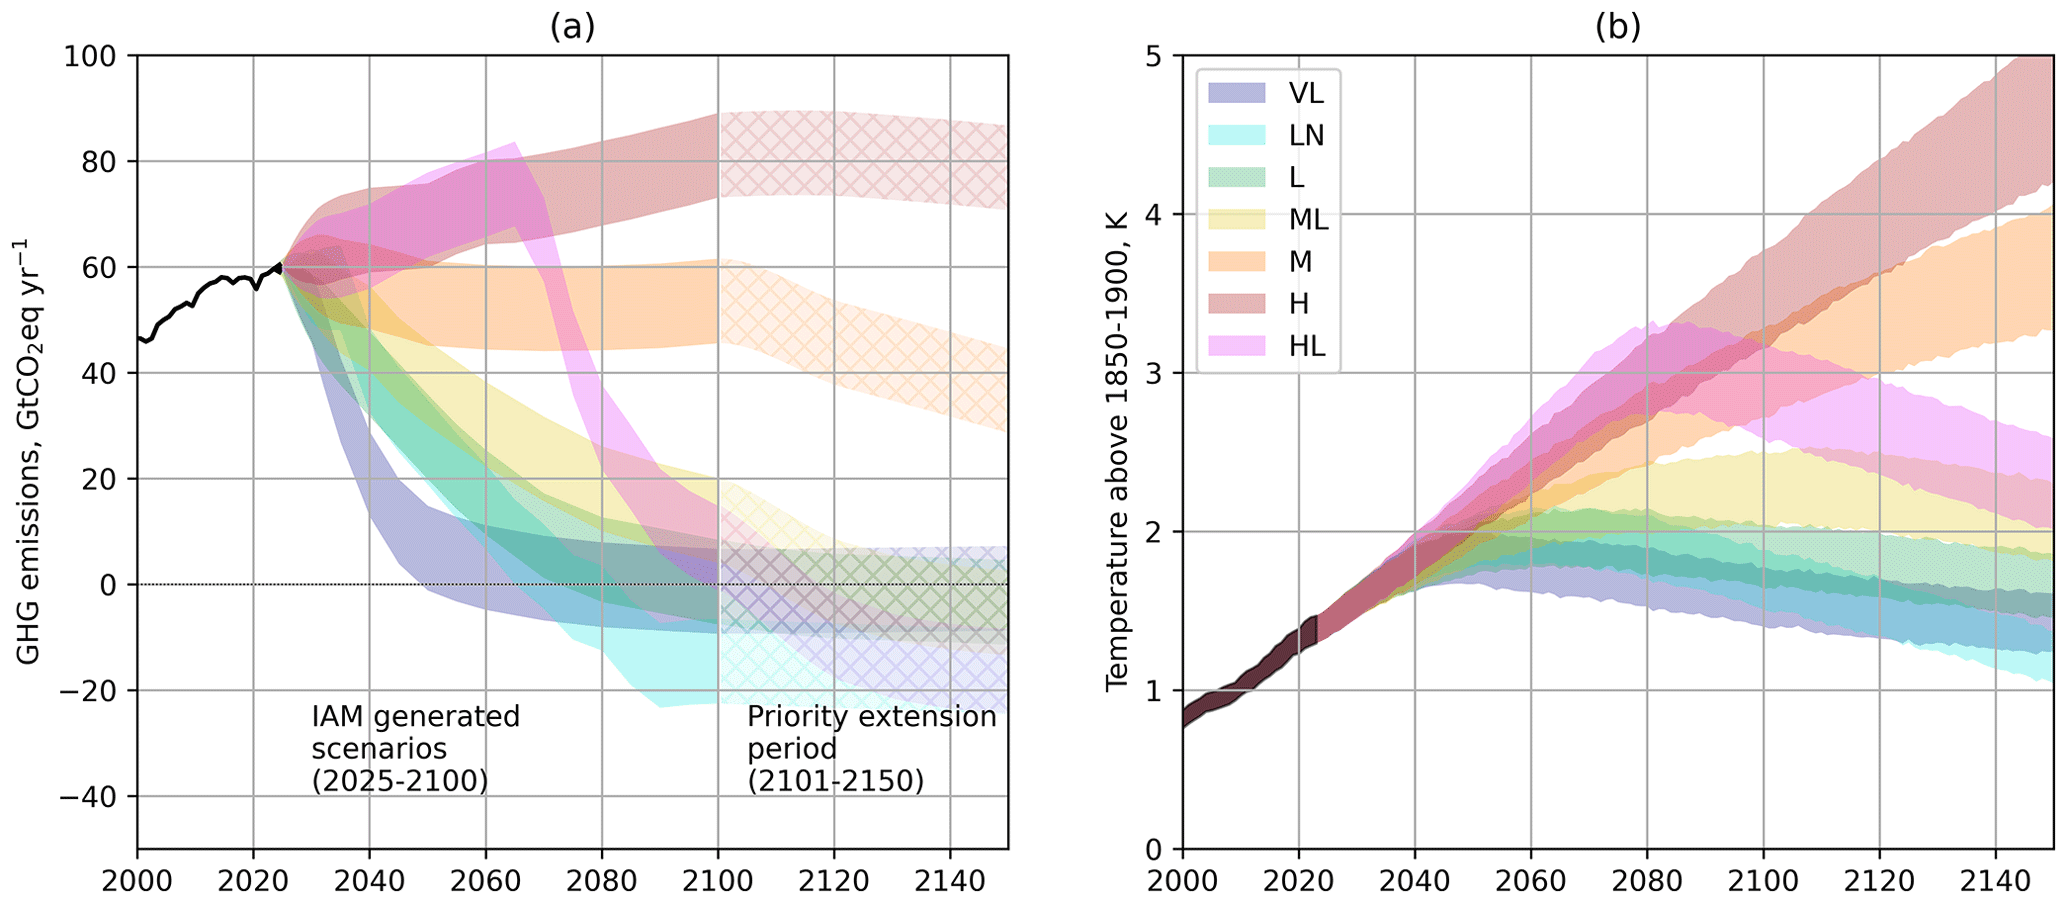
As a set, the ScenarioMIP scenarios “cover plausible outcomes ranging from a high level of climate change (in the case of policy failure) to low levels of climate change resulting from stringent policies”, the paper says.
Compared to the scenarios in CMIP6, the range in future emissions they cover is now narrower, the authors say:
“On the high-end of the range, the CMIP6 high emission levels (quantified by SSP5-8.5) have become implausible, based on trends in the costs of renewables, the emergence of climate policy and recent emission trends…At the low end, many CMIP6 emission trajectories have become inconsistent with observed trends during the 2020-30 period.”
Put simply, progress on climate policies and cheaper renewable technologies means that scenarios of very high emissions have now been ruled out.
However, this progress has not been sufficient to keep society on track for the Paris Agreement’s 1.5C goal. The paper notes that, “at this point of time, some overshoot of the 1.5C seems unavoidable”.
The change to the high end of the scenarios has sparked misleading commentary in the media and on social media – even from US president Donald Trump. A Carbon Brief factcheck unpacks the debate.
Also notable in the new scenarios is the “low-to-negative” pathway, which has the explicit feature of emissions becoming “net-negative”. In other words, through carbon dioxide removal (CDR) techniques, society reaches the point at which more carbon is being taken out of the atmosphere than is being added through greenhouse gas emissions.
Reaching net-negative emissions is fundamental to “overshoot scenarios”, where global warming passes a target and then is brought back down by large-scale CDR.
Overshoot scenarios allow scientists and policymakers to investigate the impacts of a delay to emissions reductions and better understand how the world might respond to passing a warming target. This includes the question of whether some impacts of climate change, such as ice sheet melt, are reversible.
CMIP has encouraged modelling centres to run simulations using the “high” and “very low” scenarios first to ensure downstream users of the data – including groups working on regional climate projections (CORDEX), climate impacts modelling (ISIMIP) and ice-sheet modelling (ISMIP) – have enough time to produce their data for IPCC reports.
These two scenarios were selected as they sit at opposite ends of the spectrum of climate outcomes. The high scenario will demonstrate how models behave under high emissions, while the very low scenario will demonstrate how models behave when emissions are rapidly reduced.
CMIP has recommended that modelling centres then run the “medium” and “high-to-low” scenarios. The remaining scenarios should then follow and no official recommendation has been made yet on their production order.
Other new features
In addition to the assessment fast track and new scenarios, CMIP7 has a number of other new developments.
Updated data for simulations
Climate models use input datasets to define the set of external drivers – or “forcings” – that have caused the global warming observed so far. These drivers include greenhouse gases, changes to incoming solar radiation and volcanic eruptions.
CMIP recommends modelling groups use the same input datasets, as this makes it easier to compare model results.
In CMIP7, the historical forcing datasets available for modelling groups to use have been improved to better represent real-world changes and extended closer to the present day. The historical simulations will be able to simulate the past climate from 1850 through to the end of 2021, whereas CMIP6 only simulated the past climate through to 2014.
CMIP is also planning to extend these historical datasets through to 2025 and maybe further throughout the course of CMIP7.
Emissions-driven simulations
CMIP7 introduces a new focus on CO2 emissions-driven simulations, providing a more realistic representation of how the climate responds to changes in emissions.
In older generations of climate models, atmospheric levels of CO2 and other greenhouse gas concentrations have been needed as an input to the model. These levels would be produced by running scenarios of CO2 emissions through separate carbon cycle models. The resulting climate-model runs were known as “concentration-driven simulations”.
However, many of the latest generation of models are now able to run in “emissions-driven mode”. This means that they receive CO2 emissions as an input and the model itself simulates the carbon cycle and the resulting levels of CO2 in the atmosphere.
This development is important, as climate policies are typically defined in terms of emissions, rather than overall atmospheric concentrations.
This new development in modelling will enable a more realistic representation of the carbon cycle and a better understanding of how it might change under different levels of warming.
Enhanced model documentation and evaluation
All CMIP7 models will be required to supply standardised model documentation that ensures consistency across model descriptions and makes it easier for end users to understand the data.
Additionally, CMIP scientists have developed a new open-access tool that dramatically speeds up the evaluation of climate models.
This “rapid evaluation framework” allows researchers to compare model outputs with real-world observations, providing immediate insight into model performance.




The post Guest post: How CMIP7 will shape the next wave of climate science appeared first on Carbon Brief.
Guest post: How CMIP7 will shape the next wave of climate science

This year’s so-called “super El Niño” is entering into record-breaking territory.
Sea surface temperatures in the tropical Pacific now equal the previous daily record set in 2015 and will likely keep rising in the days ahead.
El Niño is a naturally occurring climate phenomenon in the Pacific that reshapes weather patterns around the world and temporarily boosts global temperatures.
The current El Niño event – which has been underway since June and is expected to last until next year – has been developing faster than any previous event on record.
The strength of an event is tracked using the “Niño 3.4 anomaly”, which measures how much warmer sea surface temperatures in a section of the central Pacific are than average.
As of 19 September, the daily anomaly in the Niño 3.4 region stands at 3.07C, putting it in a statistical tie with the previous record of 3.08C.
Some scientists, using a different baseline for calculating the anomaly, have already called the new record.
Either way, this is remarkable, in part because of how early in the calendar year it is occurring. El Niño typically peaks in the winter months, most commonly in November or December.
Every strong El Niño on record has continued to strengthen after mid-September – and there is every reason to think that this one will as well.
(For more on El Niño, see Carbon Brief’s recent interactive explainer.)
Record territory
El Niño events are typically classed as “weak” when the Niño 3.4 anomaly reaches 0.5C, “moderate” above 1C, “strong” above 1.5C and “very strong” above 2.0C.
For this year’s event, the Niño 3.4 anomaly has now reached 3.07C, which puts it in a statistical tie with the record set on 18 November 2015, set during a “very strong” El Nino event.
The chart below shows how the strength of the current El Niño (red line) is dramatically outpacing both 2015-16 (blue) and another “very strong” event in 1997-98 (light blue).
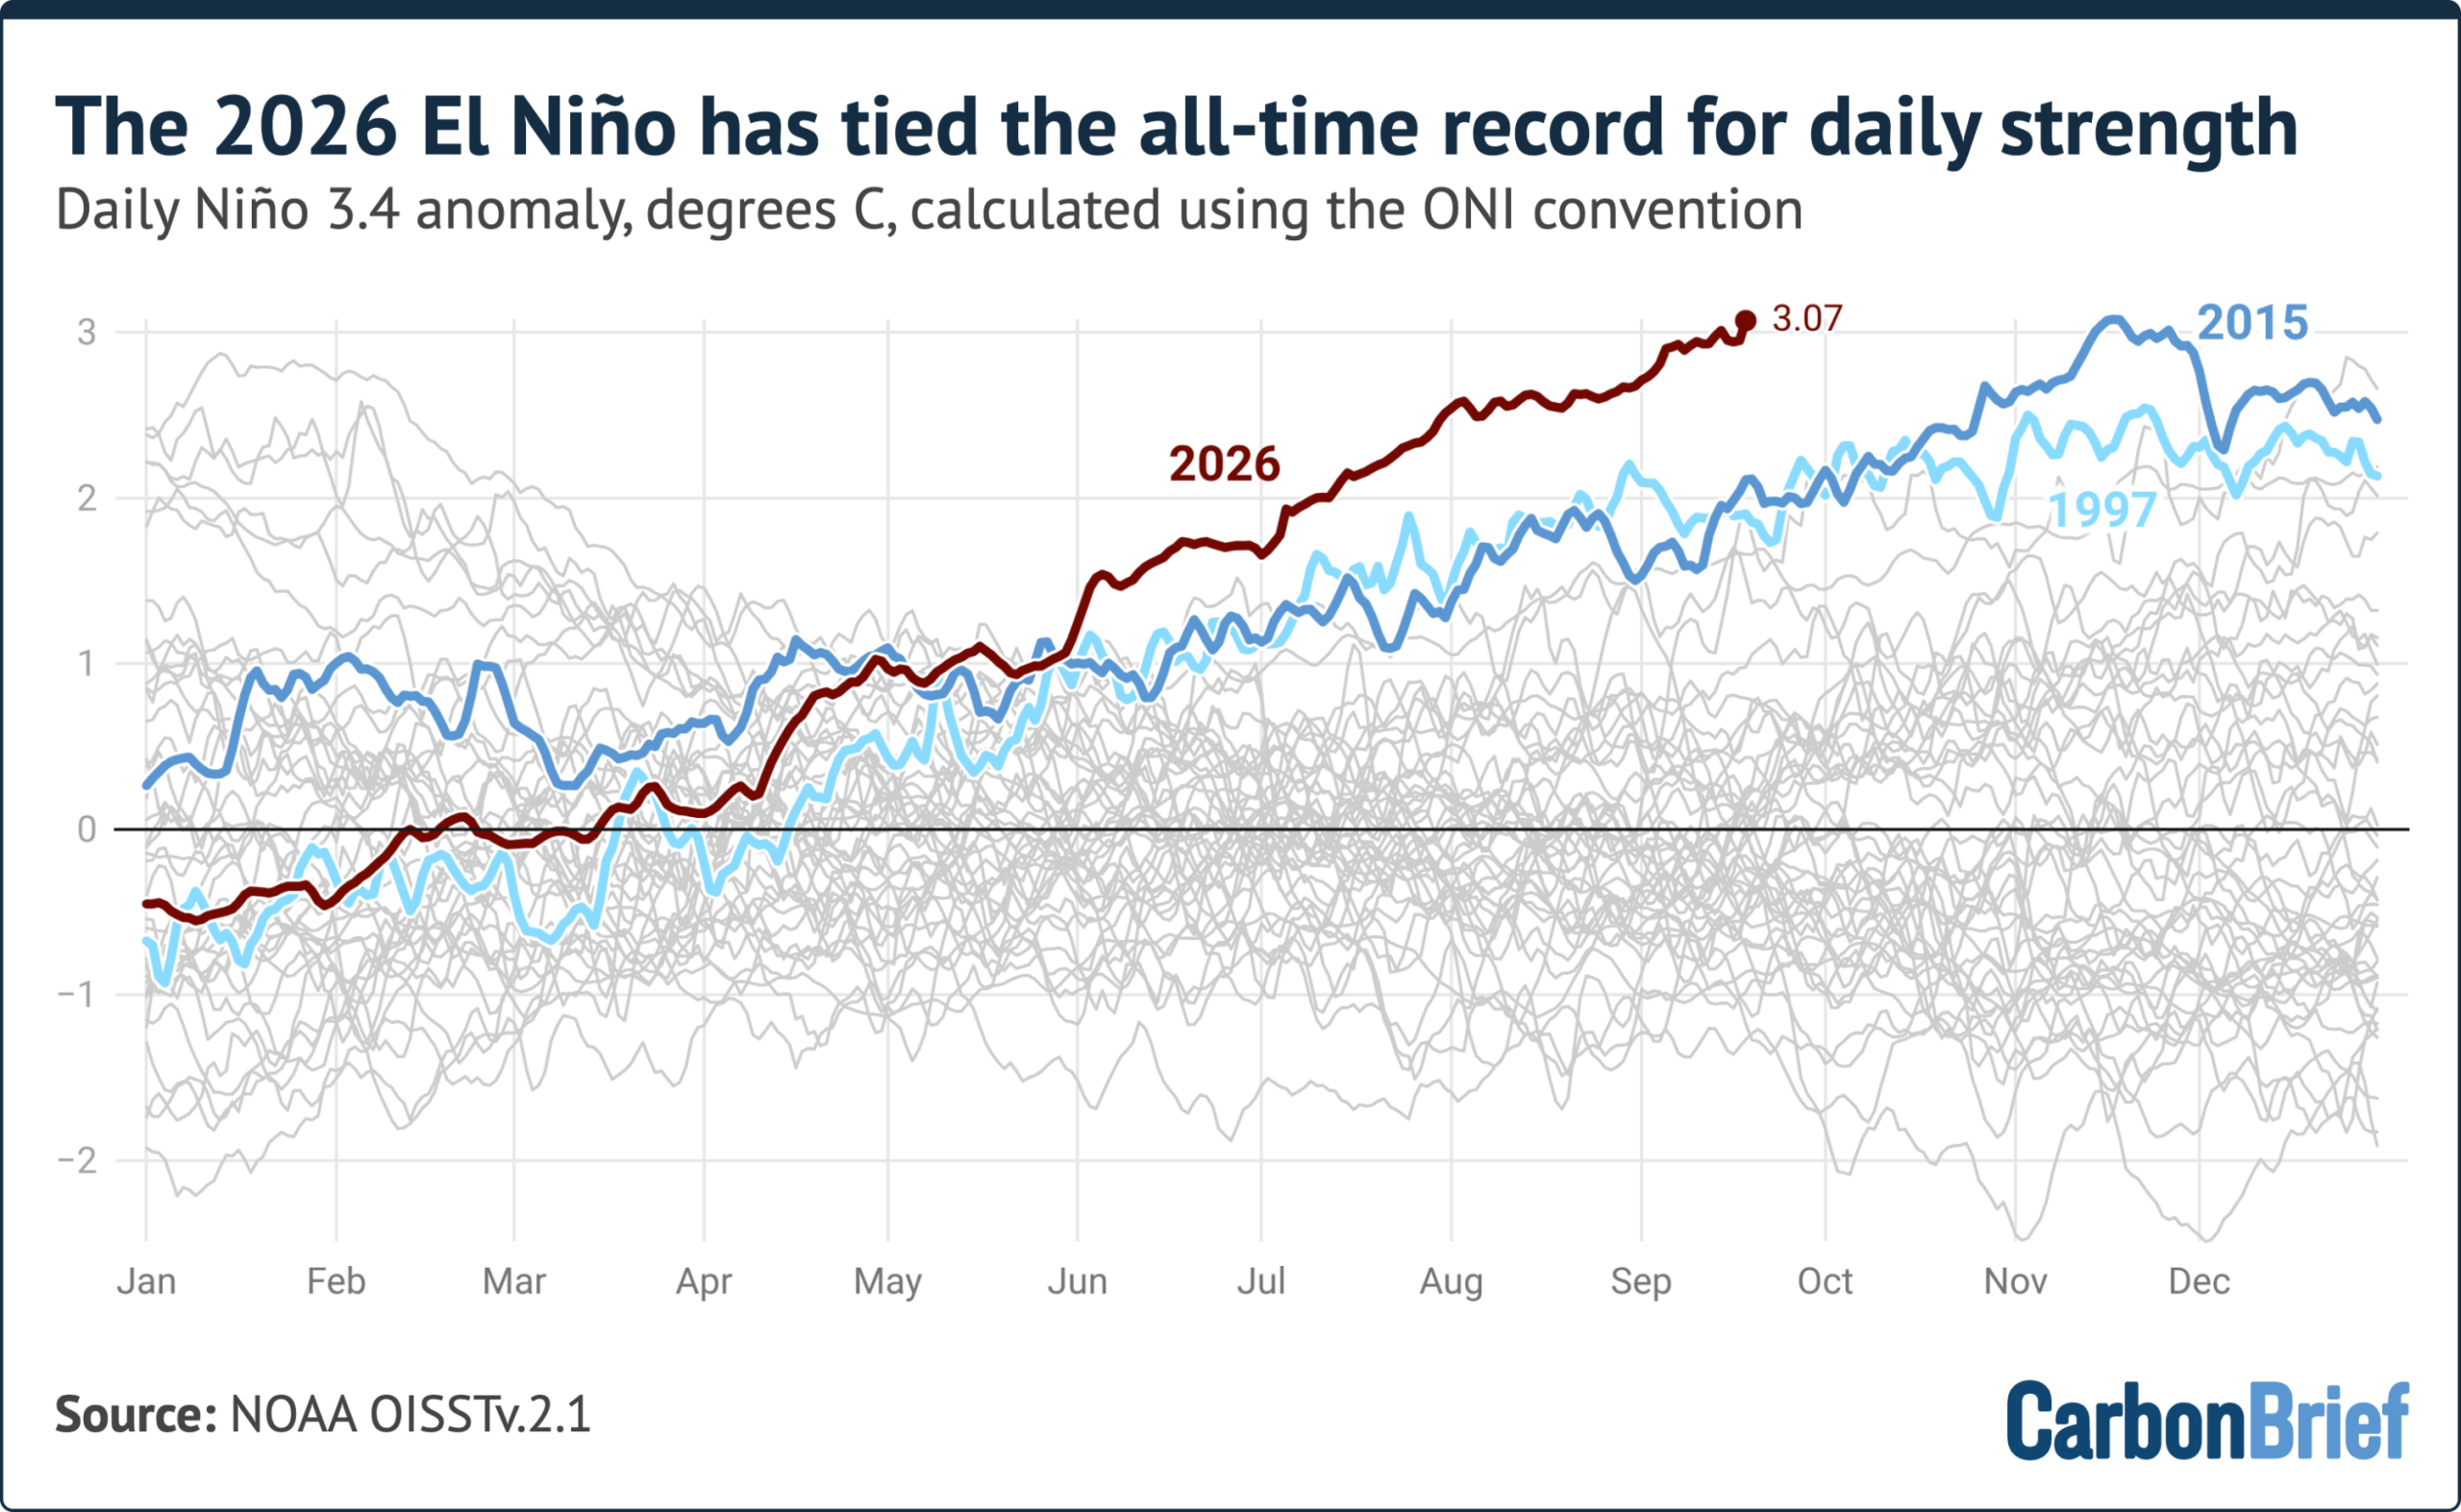
To analyse the developing El Niño, Carbon Brief followed the convention of the US National Oceanic and Atmospheric Administration’s (NOAA) Oceanic Niño index (ONI).
ONI is calculated by subtracting the latest 30-year average temperature in the Nino 3.4 region from daily sea surface temperatures. This approach allows for the most recent years to be compared against the most recent 30-year period. It removes much of the influence of longer-term, human-driven warming from the index.
(While meteorological organisations typically track changes to ONI on a three-month rolling average basis, Carbon Brief’s analysis looked at how the metric is changing on a daily basis.)
If ONI is calculated using a baseline of 1991-2020 then the current El Niño has already set a new record.
Since the start of June, El Niño’s strength has been greater than any other year. In early September in both 1997 and 2015, anomalies were around 1.9C – more than one degree below where they are this year.
An alternative index
There is another commonly used metric – the relative Oceanic Niño index (RONI) – used to study El Niño.
Introduced by NOAA in 2024, the RONI index adjusts for tropical ocean warming linked to human-caused climate change. To do this, it takes sea surface averages in the Nino 3.4 region and subtracts out temperature anomalies observed across the tropical oceans (between the latitudes of 20 degrees north and south).
This approach may better remove the influence of climate change in this specific region, but can also diminish the apparent strength of strong El Niño events, such as the current one, which extend well outside the Niño 3.4 region.
The chart below shows daily RONI values, which are record setting for this time of year, but remain below an all-time daily record set during the 1982-83 El Niño event.
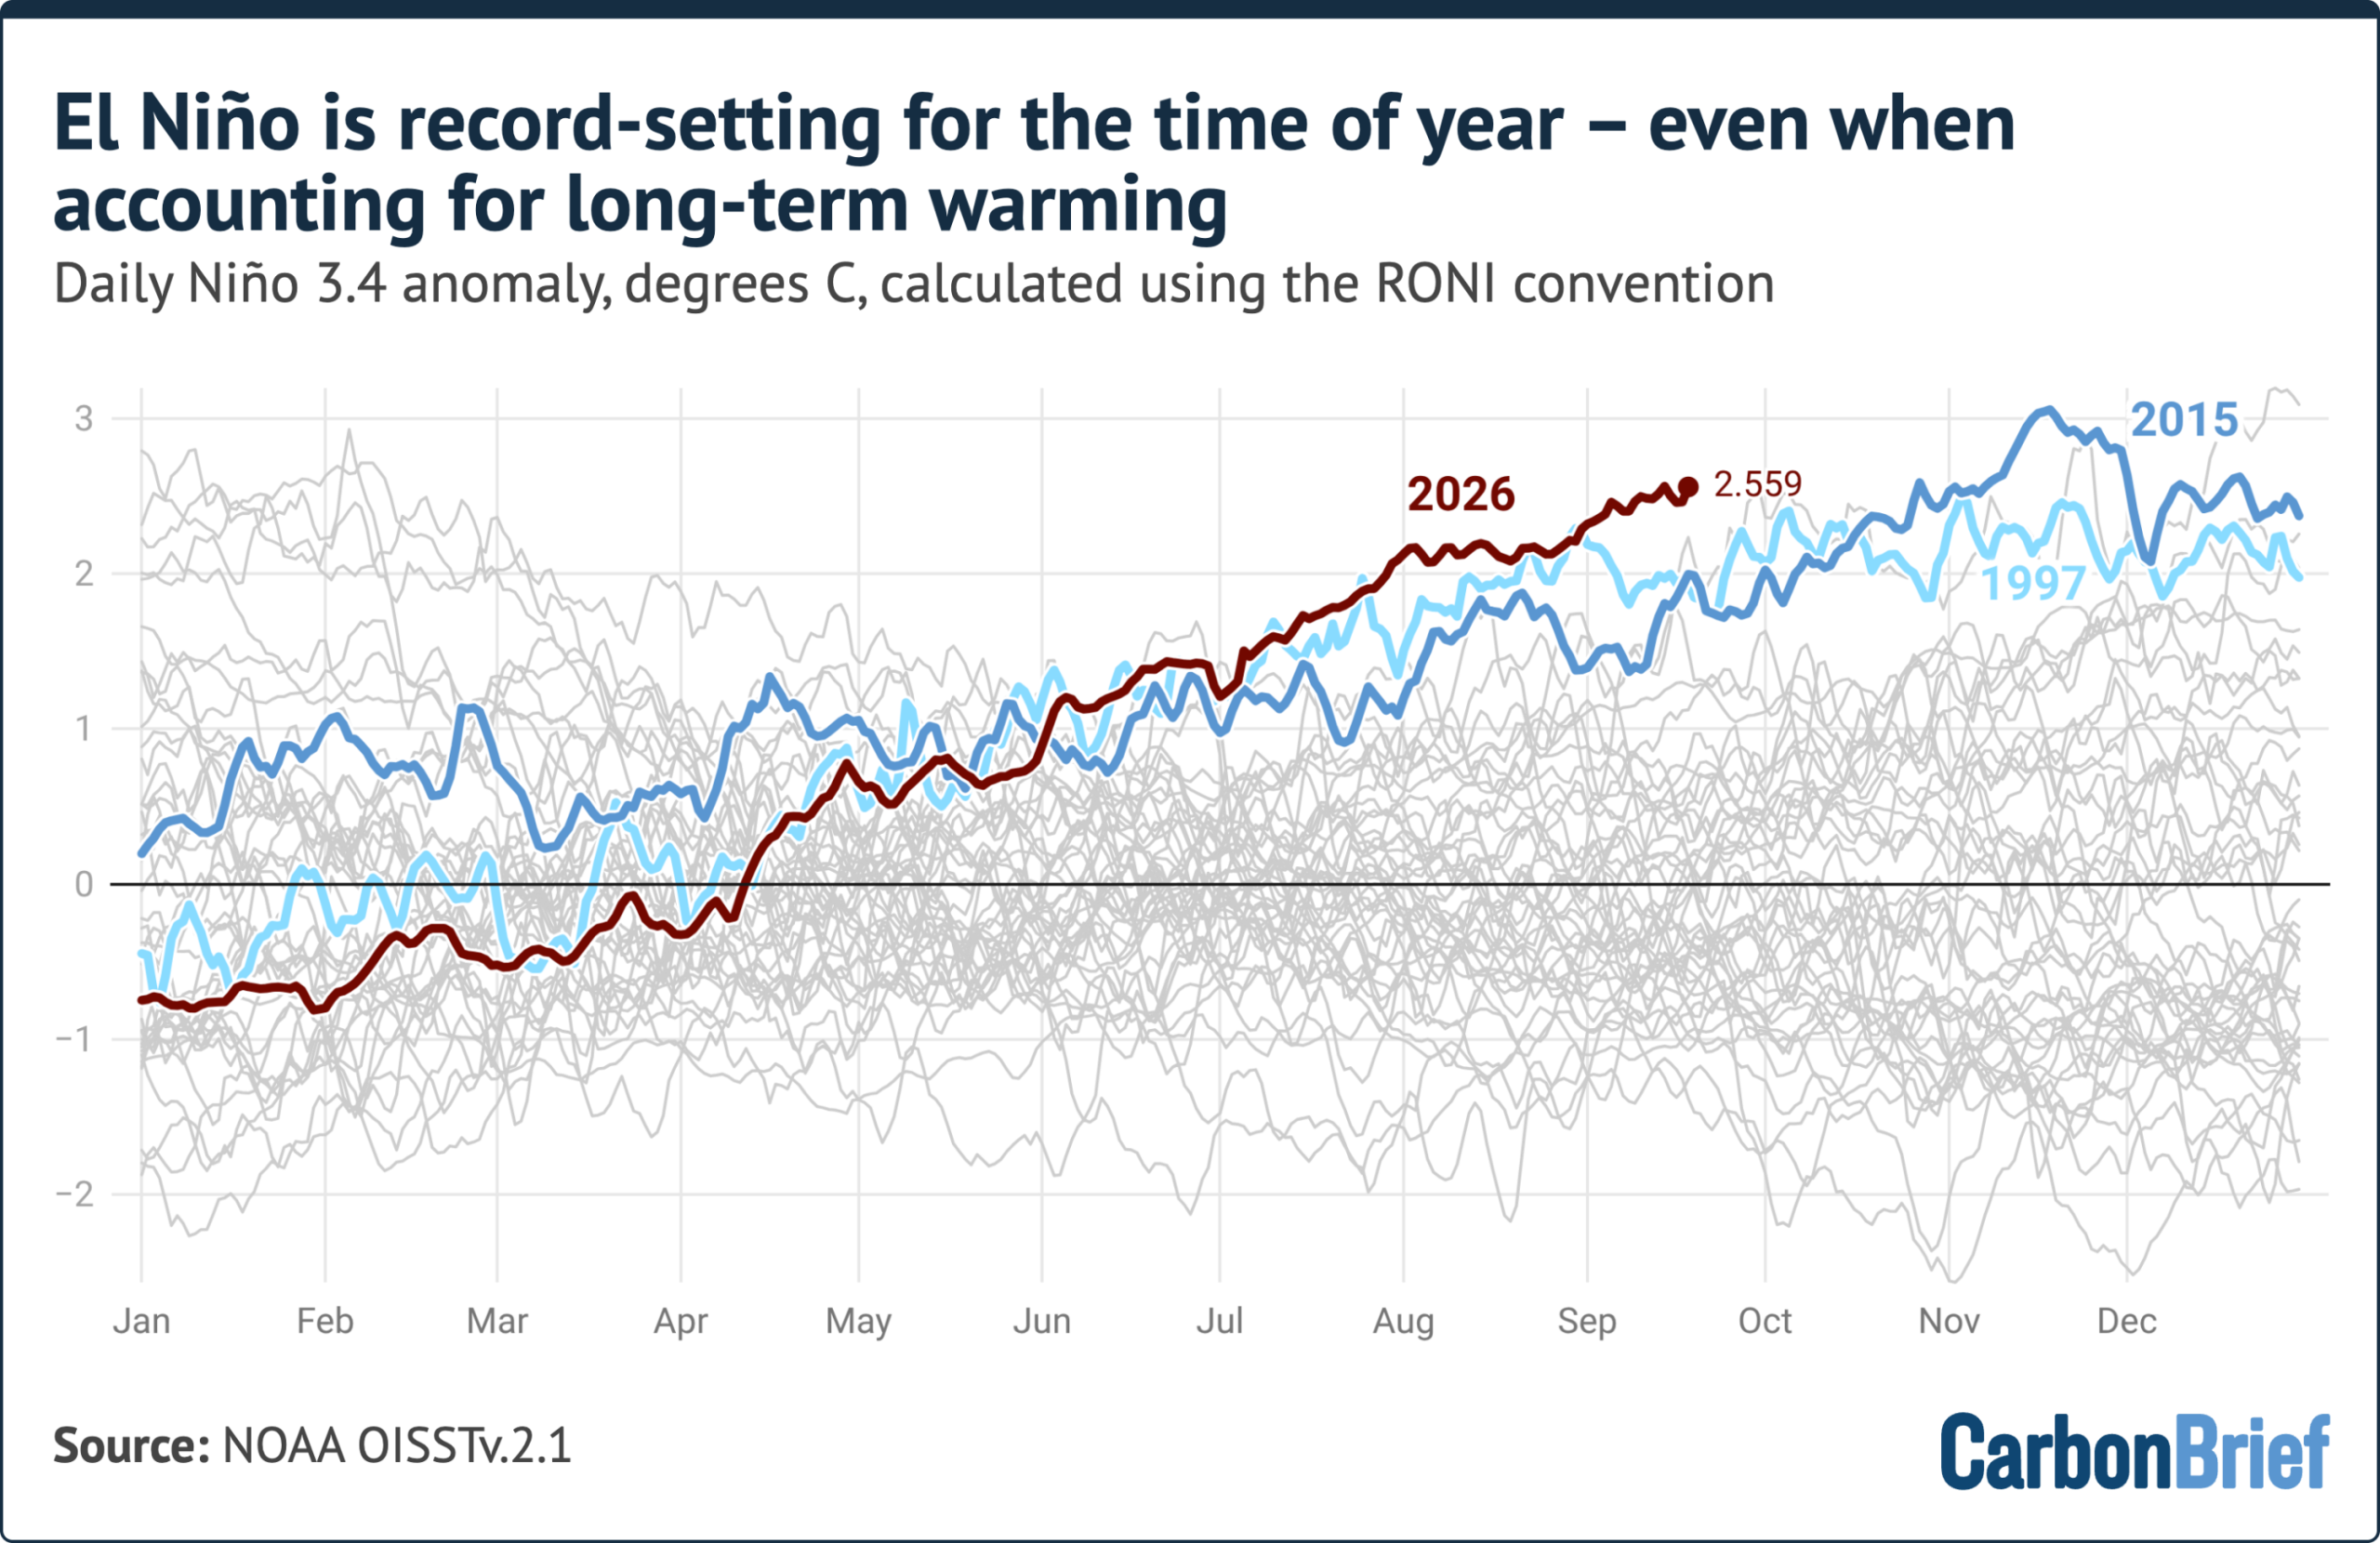
RONI stood at around 2.5C in mid-September, some 0.7C below the 1982 record.
However, that record was set in late December, at the peak of the event.
The 1982-83, 1997-98 and 2015-16 events added between 0.5C and 1.9C to their RONI values between mid-September and their peaks.
On track to smash monthly and seasonal records
Because daily El Niño values are noisy, scientists typically turn to monthly or seasonal averages to compare El Niño events.
The latest full calendar month for which data is available – August 2026 – had a Niño 3.4 anomaly of around 2.45C. This is higher than the peak of every prior El Niño event on record except 2015-16 – where the anomaly reached 2.75C – and 1877-78, when the anomaly sat at around 2.7C, based on a reconstruction of sea surface temperatures using sparse ship data.
The figure below shows the monthly evolution of the five strongest El Niño events on record alongside 2026, as well the current forecast from 14 seasonal forecast models.
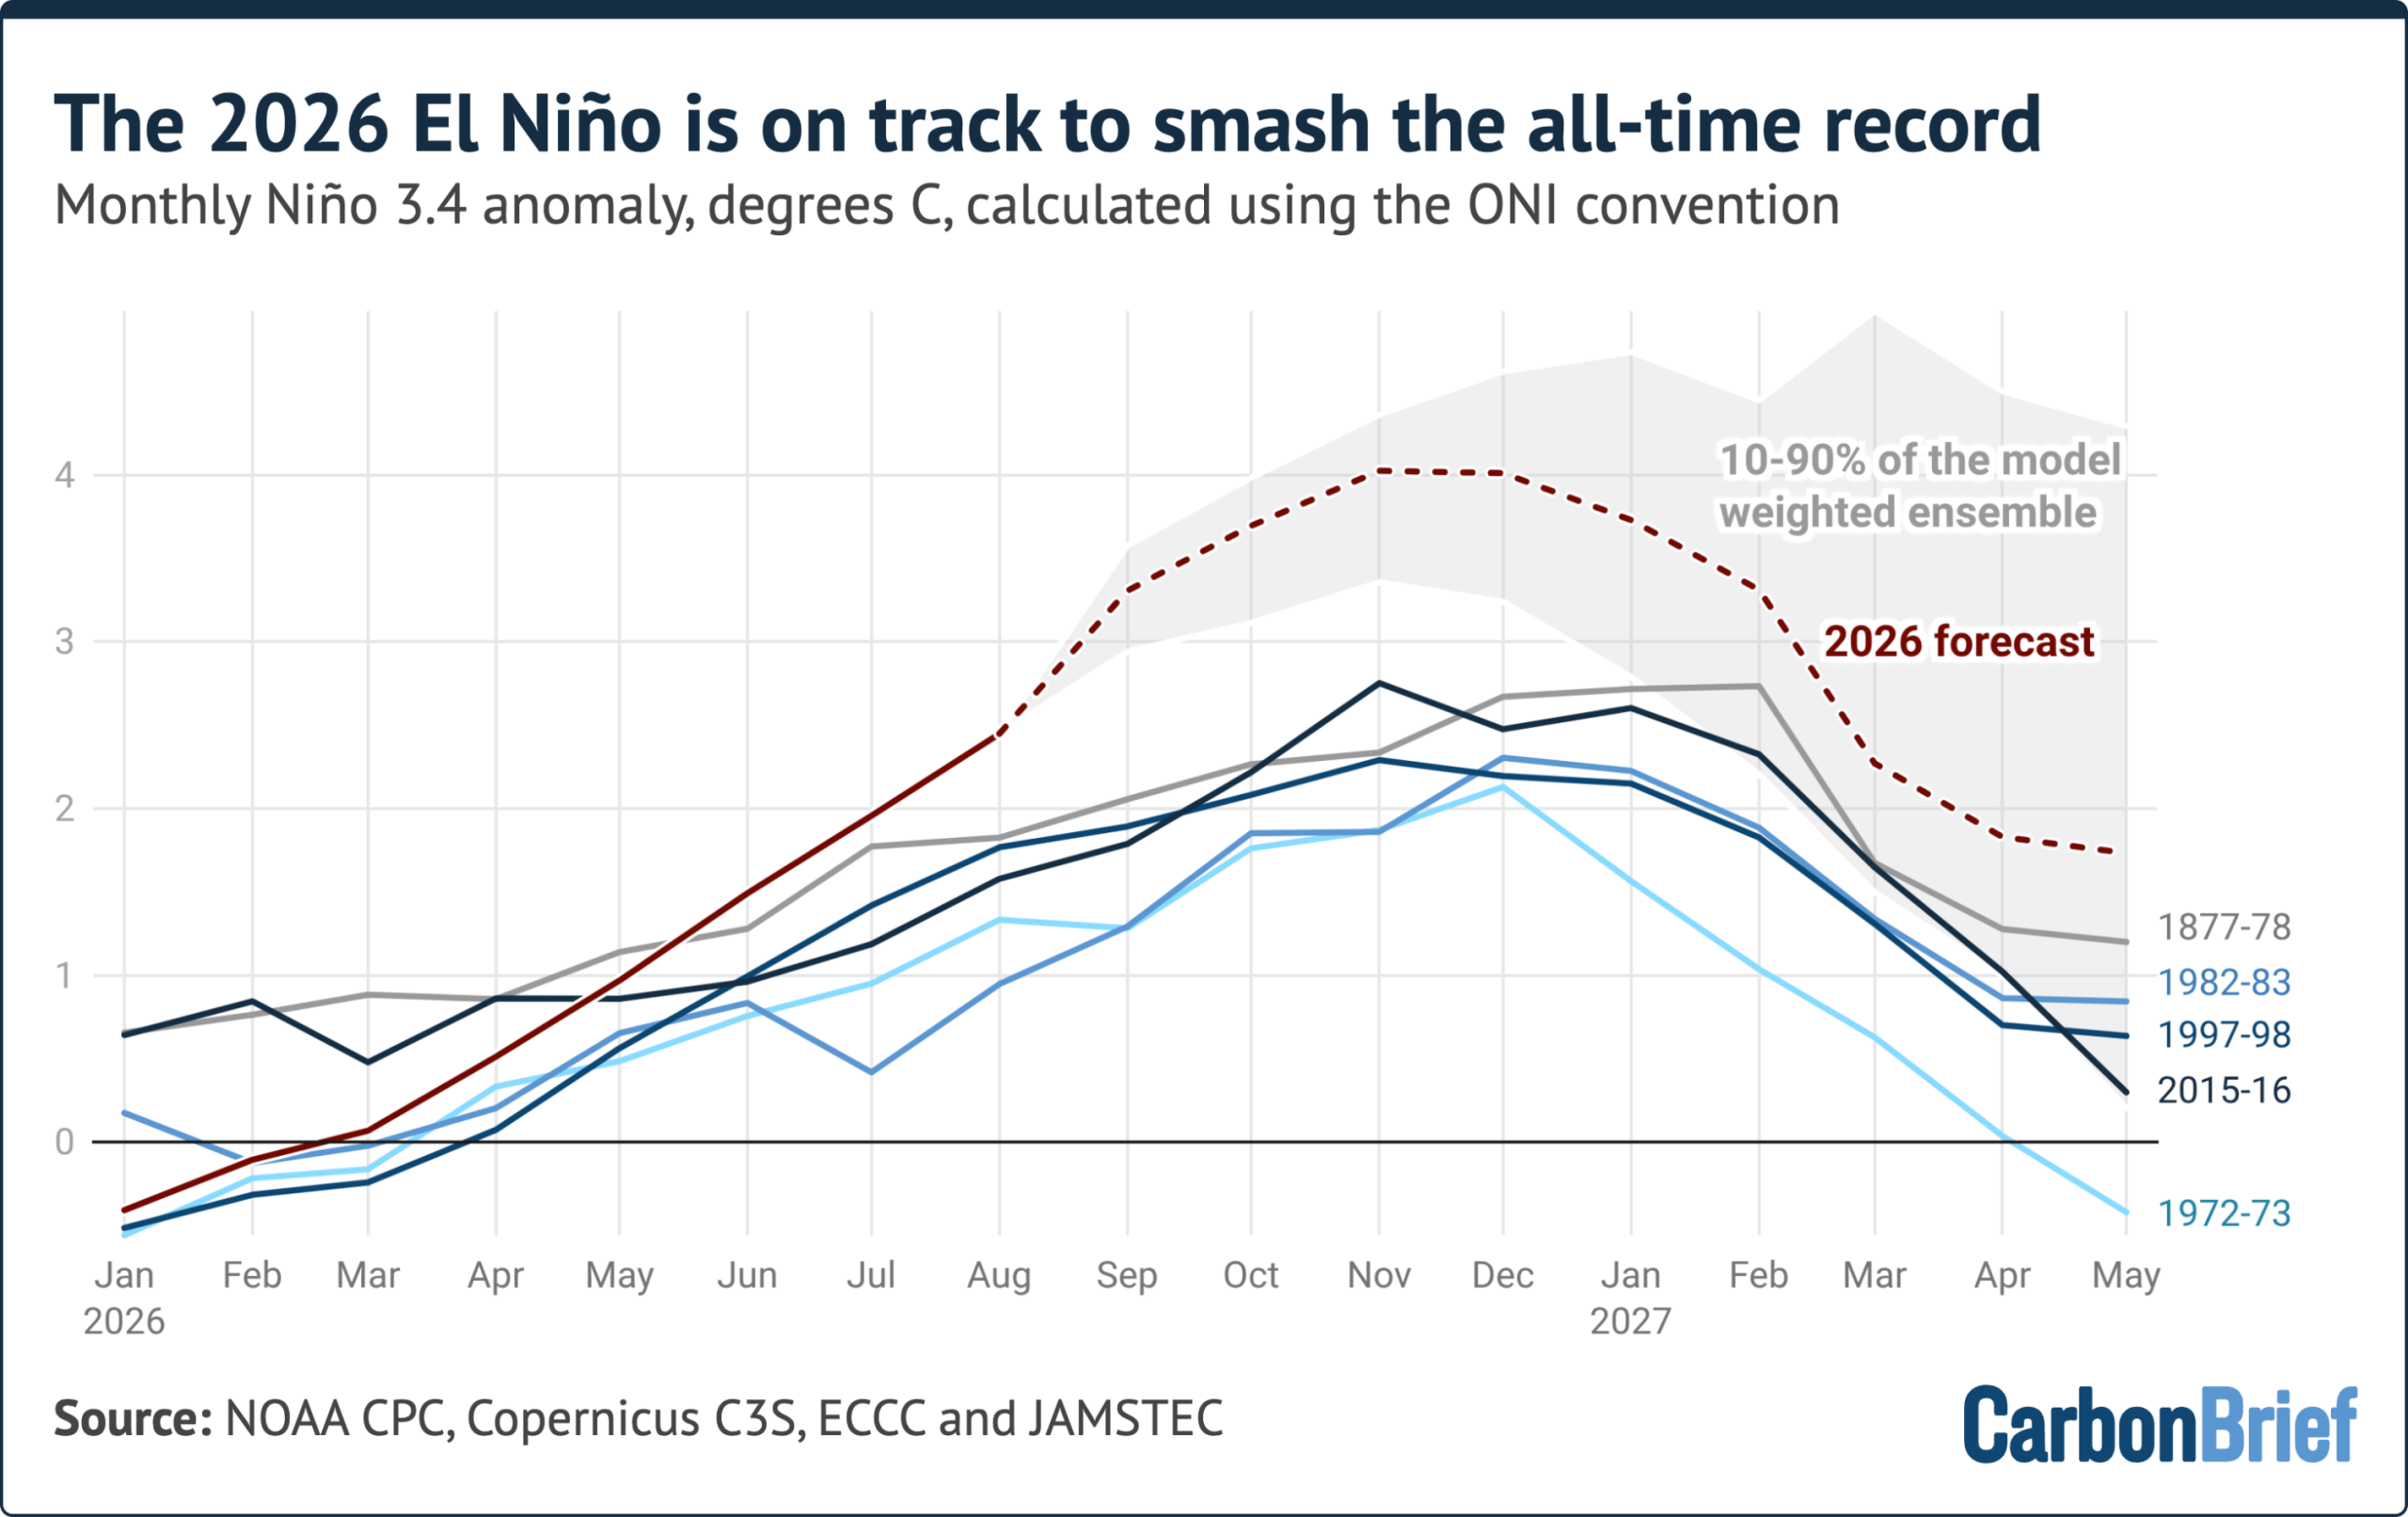
Taken together, the models project a peak monthly anomaly later this year of around 4.1C, with 80% of the 674 individual model runs falling between 3.4C and 4.6C.
Every single model run peaks above the 2015-16 record. The projected margin over that record, some 1.3C, is larger than the entire gap between the strongest and fifth-strongest El Niño of the past 150 years.
Some caution here is warranted, however. No seasonal forecast system has ever been verified against an event of this size, because none has ever occurred. The models also predicted temperatures slightly warmer than observed this summer, with real-world observations for August coming in around 0.3C below forecasts.
However, all strong El Niño events on record have continued to strengthen well into the winter – and the models are in near-unanimous agreement that this one will, too. If the forecast holds, the current event will peak between November and January at a level far beyond any event previously observed in the instrumental record.
El Nino’s effect on global temperatures typically lags rising ocean temperatures in the Pacific by several months, so most of the impact will be felt in 2027 rather than 2026.
Carbon Brief’s most recent “state of the climate” quarterly analysis found 2026 on track to be the warmest or second-warmest year on record. The next update in early October will examine what a record El Niño means for 2027.



The post Analysis: ‘Super El Niño’ reaches ‘remarkable’ all-time record appeared first on Carbon Brief.
Analysis: ‘Super El Niño’ reaches ‘remarkable’ all-time record
Artificial intelligence (AI) is set for a bigger role at this year’s UN climate summit, as Türkiye’s COP31 presidency seeks backing for a new pledge on the technology’s energy use.
In a statement on Monday, the COP31 hosts said they will launch the Antalya Pledge on AI, which they billed as a “political” commitment on how AI is “designed, procured, powered, deployed, measured and managed” in support of climate action.
“We must openly discuss AI’s growing energy consumption and it is time for governments to start setting the terms,” COP31 president Murat Kurum said in an emailed statement. “We expect companies to be transparent about their energy use and to power their operations with clean energy”.
No further details about the pledge have been made available so far, including whether it will include a clean energy commitment or whether governments and companies will be invited to sign on. The COP31 presidency said it would share a draft before the summit opens in Antalya in early November.
UN climate chief Simon Stiell went further in a New York speech on Monday, warning that AI leaders are “on thin ice when it comes to license to operate, and sinking deep underwater when it comes to public support”.
“Energy-guzzling artificial intelligence is driving up planet-heating pollution from coal, oil and gas, while ratcheting up energy costs for households and businesses,” he said, adding that data centre projects are being put on hold due to public opposition from New York to Texas.
Growing energy use and emissions
Concerns about the environmental impacts of AI infrastructure and its impact on rising electricity prices have led to a growing backlash in some communities, especially in the US.
Big Tech’s breakneck race to develop new AI models and build out the energy-hungry infrastructure supporting them has stoked fears over the technology’s growing climate impact.
Greenhouse gas emissions generated by data centres through their electricity use are set to more than double between 2024 and 2030, according to the International Energy Agency (IEA).
Data centres, which underpin various technologies including AI, are expected to consume more power than all but five countries by the end of the decade.
-
UN asks AI companies to reveal full environmental impacts
UN chief António Guterres says big AI firms should disclose the emissions, water and energy use of their data centres amid community opposition -
Explainer: Will AI data centres make or break the energy transition?
As grids struggle to meet soaring electricity demand for AI data-crunching, big tech is under pressure to cover the costs of boosting power supplies – which may be dirty or clean


The AI race is also driving a surge in new fossil gas investment in the United States, where Big Tech giants including Microsoft, OpenAI and Meta have struck up major deals with fossil fuel operators to power their infrastructure.
In China, the other major global AI force, coal provides around 70% of the electricity powering the country’s data centers, according to an IEA report published last year.
More space for AI at COPs?
Despite AI’s rapidly growing relevance for the world’s ability to limit global warming, high-level discussions on the climate impact of the technology have been largely absent at UN climate summits.
While the pledge is still being developed and scarce details have been made public so far, the Antalya initiative, alongside sharper rhetoric from Stiell, suggests that might be changing.
Climate Home News understands that the UN climate change body is encouraging AI companies to be present at COPs as the climate summits set the global direction for energy policy and tech firms now have a major stake in it.
Earlier this year, UN Secretary-General António Guterres launched an initiative aimed at holding AI companies accountable for their environmental impacts and repeated a call for all big AI companies to commit to powering every data centre with renewable energy by 2030.
Align AI with science
Stiell said that tech titans need to start showing why the benefits of AI outweigh its “skyrocketing costs”, by setting credible climate targets, coming clean about their energy use and powering data centres with renewable energy.
AI proponents claim that, despite its growing energy use, the technology’s widespread application would bring net benefits in the fight against climate change by driving massive energy efficiency gains and optimising renewable energy integration. The IEA estimates that existing AI applications could cut emissions by more than data centres add.
Fossil fuel expansion threatens COP31 hosts’ credibility, experts warn
But critics argue that it is wrong to compare theoretical gains with real-world emission growth and any gains are outweighed by the widespread adoption of AI tools by fossil fuel companies to extract planet-heating oil and gas faster and more cheaply.
Stiell said the tech industry needs to “respect science and start aligning with global climate efforts – urgently”.
Alongside the AI pledge, the COP31 presidency has also announced it will launch an ‘AI for Clean Technologies’ Initiative, which will develop a portfolio of AI-enabled clean-technology pilots in priority sectors, including smart energy and green industry.
This programme aims to demonstrate the responsible use of AI in practice, the COP31 presidency promised.
The post COP31 presidency announces AI pledge as UN climate chief says Big Tech ‘on thin ice’ appeared first on Climate Home News.
COP31 presidency announces AI pledge as UN climate chief says Big Tech ‘on thin ice’
Dola Oluteye, PhD, is a senior fellow in energy and transport policy at the UCL Energy Institute and founder of The Professional African Network Advisory Initiative.
At the June 2026 UN Climate Meetings in Bonn, the incoming Turkish COP31 Presidency introduced a headline target for the Action Agenda: raising electricity’s share of global final energy consumption from around 20% today to 35% by 2035.
Backed by the international Electrify Now campaign – also launched in June by the European Commission and governments across five continents, including Ethiopia – the aim is to replace fossil fuels with clean energy by shifting the way we travel and transport goods and commodities, cook and warm our homes and offices, and power our industries.
-
Made in Nigeria: The race to build an African solar industry from scratch
A solar power revolution is gathering pace in Africa and Nigeria wants a slice of the fast-growing industry, but competing with Chinese imports won’t be easy -
Q&A: How can African electricity access power jobs not just lightbulbs?
Carol Koech from the Global Energy Alliance says electricity connections in Africa should happen in a way that transforms communities and livelihoods -
Africa records fastest-ever solar growth, as installations jump in 2025
Africa’s solar power installations have increased sharply, driven by utility-scale projects and privately financed rooftop and commercial systems


On paper, this is a welcome signal. Yet, as world leaders line up behind global goals in the lead-up to COP31, African nations face a fundamental question: whose energy transition are we talking about? For the roughly 600 million people living without electricity on the continent, international climate targets often sound less like a lifeline and more like a conversation happening on another planet.
For developed countries, electrification is largely a replacement exercise – swapping petrol and diesel vehicles for electric ones, and gas boilers for heat pumps powered by existing, stable grids.
But across sub-Saharan Africa, the challenge is vastly different. The region accounts for 85% of the global population without electricity, up from 50% in 2010. Here, electrification is not a technology swap; it is the foundational building block of human dignity, economic sovereignty, energy access and modern development.
Electricity connections must deliver real development
Half of the number of people without electricity access in Africa live in three countries – Nigeria, Ethiopia and the Democratic Republic of Congo – while 900 million other Africans lack clean cooking solutions.
The proposed global electrification goal must not treat a continent with nearly half of its population without electricity the same way it treats mature Western economies.
To regard electrification merely as a tool for decarbonisation misses the core reality of our continent. Africa is not just transitioning an existing energy system; we are building one from the ground up in many places.
If a global electrification target of 35% by 2035 is to mean anything for Africa, it must be rooted in African realities. That begins with acknowledging that expanding power connections alone is insufficient.
China’s industrial engine starts to break its fossil fuel habit
Energy poverty does not end when a power line crosses a village; it ends when electricity is reliable, affordable and powered by clean sources that spur productive economic activities. Connecting households to a micro-grid they cannot pay to use does not deliver development.
Electrification can also help solve the critical issue of super pollutants in countries like Nigeria, notably the production of methane and black carbon, by replacing combustion-based systems with cleaner, electric alternatives.
Breaking from past extractive models
Equally critical is how the electricity is generated. Within some African policy circles, electrification has occasionally been viewed with scepticism – seen as a possible Trojan Horse to justify expensive nuclear projects or to expand long-term fossil gas lock-ins.
We must be clear: expanding electricity demand while increasing reliance on volatile fossil fuels or unviable, high-cost infrastructure is a false solution.
True electrification must be paired directly with the massive development of Africa’s unparalleled renewable energy resources.
Africa holds 60% of the world’s best solar resources, alongside immense hydro, wind and geothermal potential. Tying the global electrification push to renewable energy capacity and local battery storage is the only pathway that protects African economies from international fuel price shocks while keeping our climate commitments intact.
Global climate negotiations such as those ongoing at the International Maritime Organization (IMO) offer another building block for Africa’s green energy future.
International trade linked to 20% of global emissions – but imports ignored
Adopting a shipping carbon price at the IMO this year, through the Net-Zero Framework, would create a climate fund worth $12 billion a year. This finance could be used not only towards the electrification of Africa’s ships and ports, but also for building broader renewable energy production on the continent.
Furthermore, global initiatives must break from past extractive models. Africa cannot remain merely a site for extracting critical minerals – such as lithium, cobalt, and copper – to feed green supply chains elsewhere, only to import expensive finished technologies.
An authentic, inclusive campaign must support the development of local industry, mineral value addition and job creation on the continent.
Africa’s COP31 agenda should centre clean electrification
To achieve this, international campaigns like Electrify Now must deepen their partnership with Global South institutions. Western-centric messaging encouraging people to buy electric vehicles and install heat pumps at home must be paired with calls for robust transmission grids, decentralised mini-grids, industrial energy security and affordable clean cooking.
For this to happen, it would be great to see more African governments, businesses and civil society organisations join the Electrify Now campaign, where they can advocate for the challenges and opportunities on our continent.
Ethiopia is a great example, where a government policy to ban the importation of petrol and diesel cars has led to the country becoming a continental leader in the uptake of electric vehicles. Meanwhile, the Grand Ethiopian Renaissance Dam has seen the cost of electricity come down significantly and accounts for more than half of Ethiopia’s renewable energy generation capacity.
Türkiye says it has “final decision” at COP31 despite Australia running negotiations
The road to COP31 offers Africa a pivotal opportunity to place clean electrification at the very centre of its economic and climate agenda.
By taking ownership of this narrative, African leaders can insist that global targets deliver capital, technology sharing and infrastructure investments tailored to local needs.
Electrification is not a luxury or a secondary climate goal. Powered by renewable energy – the African sun and wind – it can be the engine of our green industrial transition. It is important for global climate architecture and Western governments to be aligned with that reality.
The post Why the global electrification agenda misses the point on Africa’s energy crisis appeared first on Climate Home News.
Why the global electrification agenda misses the point on Africa’s energy crisis



-

 Greenhouse Gases2 years ago
嘉宾来稿:满足中国增长的用电需求 光伏加储能“比新建煤电更实惠”
-
Climate Change1 year ago
Guest post: Why China is still building new coal – and when it might stop
-
Greenhouse Gases1 year ago
Guest post: Why China is still building new coal – and when it might stop
-

 Climate Change2 years ago
嘉宾来稿:满足中国增长的用电需求 光伏加储能“比新建煤电更实惠”
-

 Renewable Energy11 months ago
Sending Progressive Philanthropist George Soros to Prison?
-
Climate Change2 years ago
Bill Discounting Climate Change in Florida’s Energy Policy Awaits DeSantis’ Approval
-
Greenhouse Gases1 year ago
嘉宾来稿:探究火山喷发如何影响气候预测
-

 Carbon Footprint2 years ago
US SEC’s Climate Disclosure Rules Spur Renewed Interest in Carbon Credits