

Climate change and “unsustainable human activities” are driving “unprecedented changes” to mountains and glaciers, threatening access to fresh water for more than two billion people, a UN report warns.
The 2025 UN world water development report finds that receding snow and ice cover in mountain regions could have “severe” consequences for people and nature.
Up to 60% of the world’s freshwater originates in mountain regions, which are home to 1.1bn people and 85% of species of birds, amphibians and mammals.
The report highlights a wide range of impacts, including reduced water for drinking and agriculture, stress on local ecosystems and increased risk of “devastating” glacial lake outburst floods (GLOFs).
It also notes the deep spiritual and cultural connections that mountain-dwelling communities around the world have with mountains and glaciers, from India’s Hindu Kush Himalaya to Colombia’s Sierra Nevada de Santa Marta.
One expert tells Carbon Brief that glacier loss is already causing “loss of life, loss of livelihood and most importantly of all, the loss of a place that many communities have called home for generations”.
The report showcases a range of adaptation responses that communities are already implementing, including changing farming practices, producing better water storage systems and improving early warning systems for floods and landslides.
It also stresses the need for further funding and adaptation, as well as the importance of Indigenous knowledge and international collaboration.
Water towers
The annual UN world water development report unpacks a different aspect of “water and sanitation” each year and gives policy recommendations to decisionmakers. This year’s report focuses on mountains on glaciers, because 2025 has been designated by the UN as the “international year of glaciers’ preservation”.
Mountains are often called the world’s “water towers” due to their crucial role in the global water cycle.
Ice and snow accumulate at high latitudes every winter when temperatures are cool, before melting when summer brings warmer weather. This meltwater is an important source of water for streams – especially during hot, dry periods, when it plays a crucial role in keeping rivers flowing and providing a buffer against water stress.
It is often said that two billion people rely on mountain water from glaciers for their day-to-day needs.
The report says this figure refers to the number of people who live in drainage basins that originate in mountains – but adds that the role of glaciers in freshwater provision is “nuanced” and varies around the world.
Mountains provide 55-60% of annual freshwater flows globally – but this percentage can vary between 40% and 90% in different parts of the world, according to the authors.
Rivers including the Colorado, Nile and Rio Negro rely on water from the mountains for at least 90% of their water flow, the report says.
It adds that many of the world’s largest cities, including Tokyo, Los Angeles and New Delhi, are “critically dependent” on mountain water for a range of sectors.
The report also highlights how mountains are crucial for the power sector, with hydropower one of the main industries in mountain areas. For example, it notes that 85% of hydropower generated in Andean countries is produced in mountain areas.
Meanwhile, two-thirds of irrigated agriculture depends on the runoff contribution from mountains, according to the report.
It adds that mountain communities play a critical role in maintaining crop biodiversity and “preserve many of the rarest crop varieties and medicinal plants”.
Melting glaciers
Most water from snow and ice reserves in the mountains comes from melting snow, according to the report. However, glaciers – slow-moving rivers of ice that form from an accumulation of snow over many years – are also a key part of the mountain cryosphere.
(The cryosphere refers to frozen components of the Earth system that are at or below the land and ocean surface.)
Around 10% of the world’s land surface is currently covered by around 200,000 glaciers, which store approximately 70% of the Earth’s fresh water.
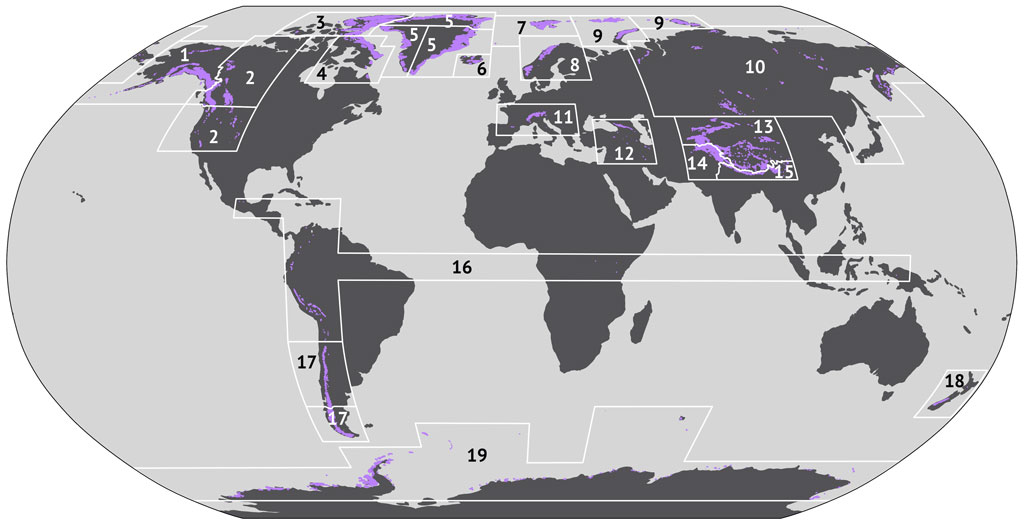
The map below marks the location of the world’s glaciers. In the field of glaciology, 19 “glacierised” regions are often used to help scientists to compare glaciers from different parts of the world. These regions are shown by the boxes and numbers.
The report says that “all mountain ranges” have shown evidence of warming since the early 20th century. It warns that, as global temperatures rise, more mountain precipitation will fall as rain instead of snow, causing snowpacks to thin and melt earlier in the year.
This acceleration in snowpack melt often causes river flow to increase in glacier-fed water basins and rivers in the short term. However, once the snow melts beyond a certain threshold, a “peak water” point is passed and river flow declines again.
The report says there is “strong evidence” that this “peak water” point has already been passed in the glacial-fed rivers of the tropical Andes, western Canada and the Swiss Alps.
Meanwhile, many glaciers have disappeared entirely. For example, Colombia has lost 90% of its glacial area since the mid-19th century, according to the report.
It highlights the “rapid disappearance” of the Sierra Nevada de Santa Marta glacier – one of the few glaciers located near the Caribbean Sea. The glacier is a source for more than 30 rivers, while also being an “irreplaceable site for biodiversity” and sacred to four different Indigenous communities, according to the report.
The plot below shows cumulative mass changes of glaciers in different world regions over 1950-2023, measured in 1,000kg per square metre. The average of all nine regions is shown by the dotted black line.
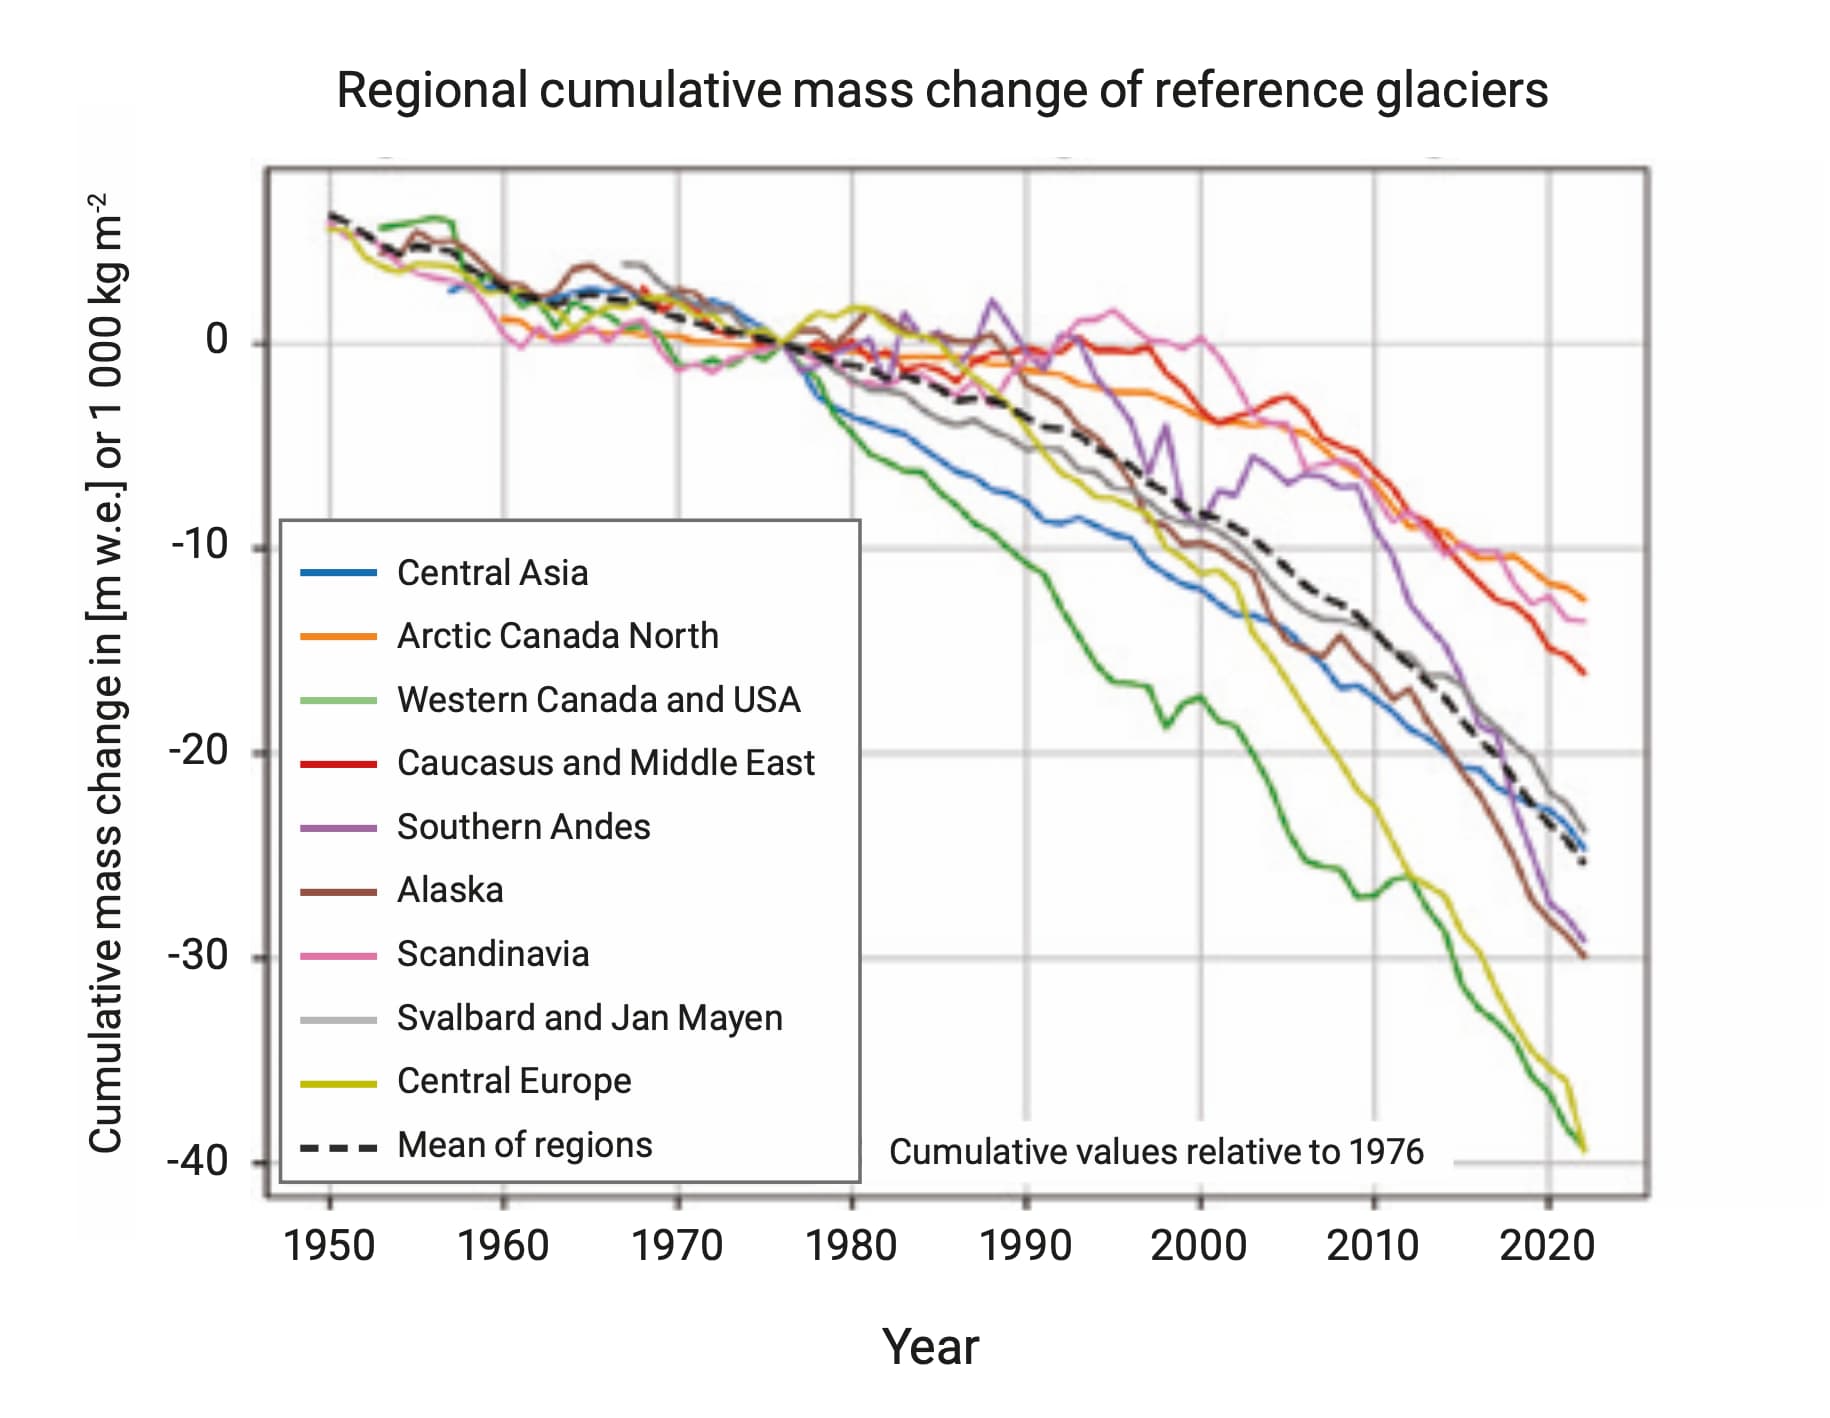
The report warns that, as the climate warms, many glaciers will “inevitably” disappear over the coming decades. It points to projections that suggest that warming of 1.5-4C will cause glaciers to lose 26-41% of their 2015 mass by 2100.
The authors also discuss the ecological consequences of warming. Mountains make up just one-quarter of the Earth’s surface, but are home to unique ecosystems and more than 85% of the world’s species of amphibians, birds, and mammals – many of which cannot be found anywhere else in the world.
As mountains warm, ecological communities are likely to shift to higher elevations, the authors say. In addition, as warming causes the water cycle to become more “unpredictable and extreme”, many of these species will face additional stressors, they add.
Hazards
The authors warn that climate change and the “rapid and unplanned urbanisation” of mountain regions is “placing pressure on fragile mountain ecosystems, affecting water availability, quality and security”.
For example, deforestation can drive up the risk of hazards such as landslides and GLOFs – the sudden release of water from a lake formed from glacial melt – the authors say.
GLOFs have caused more than 12,000 deaths in the past 200 years, as well as causing “severe damage to farmland, homes, bridges, roads, hydropower plants and cultural assets, often prompting further internal displacement”, the report says.
It adds that the frequency of GLOFs has “increased significantly” since the 1900s. These events are expected to continue rising over the coming decades – creating “new hotspots of potentially dangerous GLOF hazards and risks”.
The report contains a section on the Hindu Kush Himalaya region, which is highly vulnerable to GLOFs. It says that glaciers here are melting faster than the global average – and warns that under global warming scenarios of 1.5-2C, glacier volume in the region may reduce by 30-50% by 2100.
The report warns that GLOFs in the region are expected to triple by the end of the century, stressing that “many of the consequences will go beyond the limits of adaptation”.
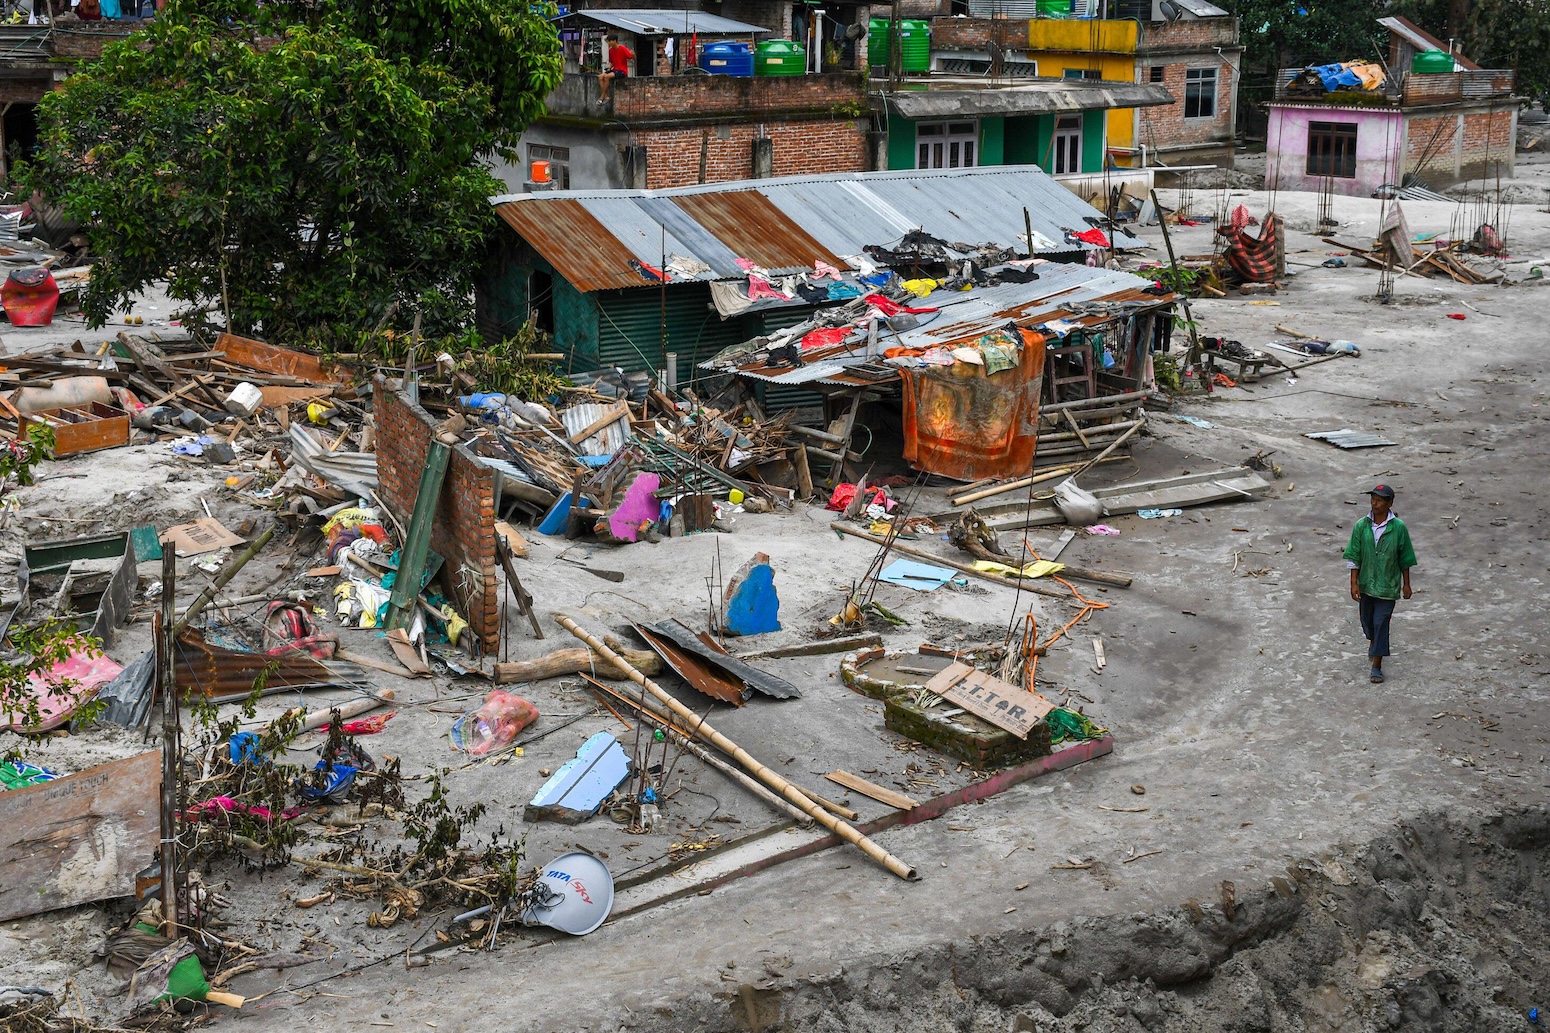
More than 60 GLOF events were recorded in the Hindu Kush over 2010-20. A recent study found that thawing permafrost played a key role in the South Lhonak Lake GLOF, which took place in 2023 in the state of Sikkim.
Indigenous peoples
The report also emphasises the impacts of melting glaciers and snowpacks on Indigenous peoples and local communities. These groups “have long-standing connections to land and water in mountain regions, which are deeply rooted in their cultural, spiritual and subsistence practices”.
For example, glaciologist Dr Heidi Sevestre from the Arctic Monitoring and Assessment Programme told a press briefing about the “cultural and spiritual importance of these mountains and glaciers” to the Bakonzo people, who live in the foothills of Uganda’s Rensui glaciers.
Sevestre explained that this community – which has “probably one of the lowest carbon footprints in the world” – is “worried that they could be punished by their gods if the ice disappears”.
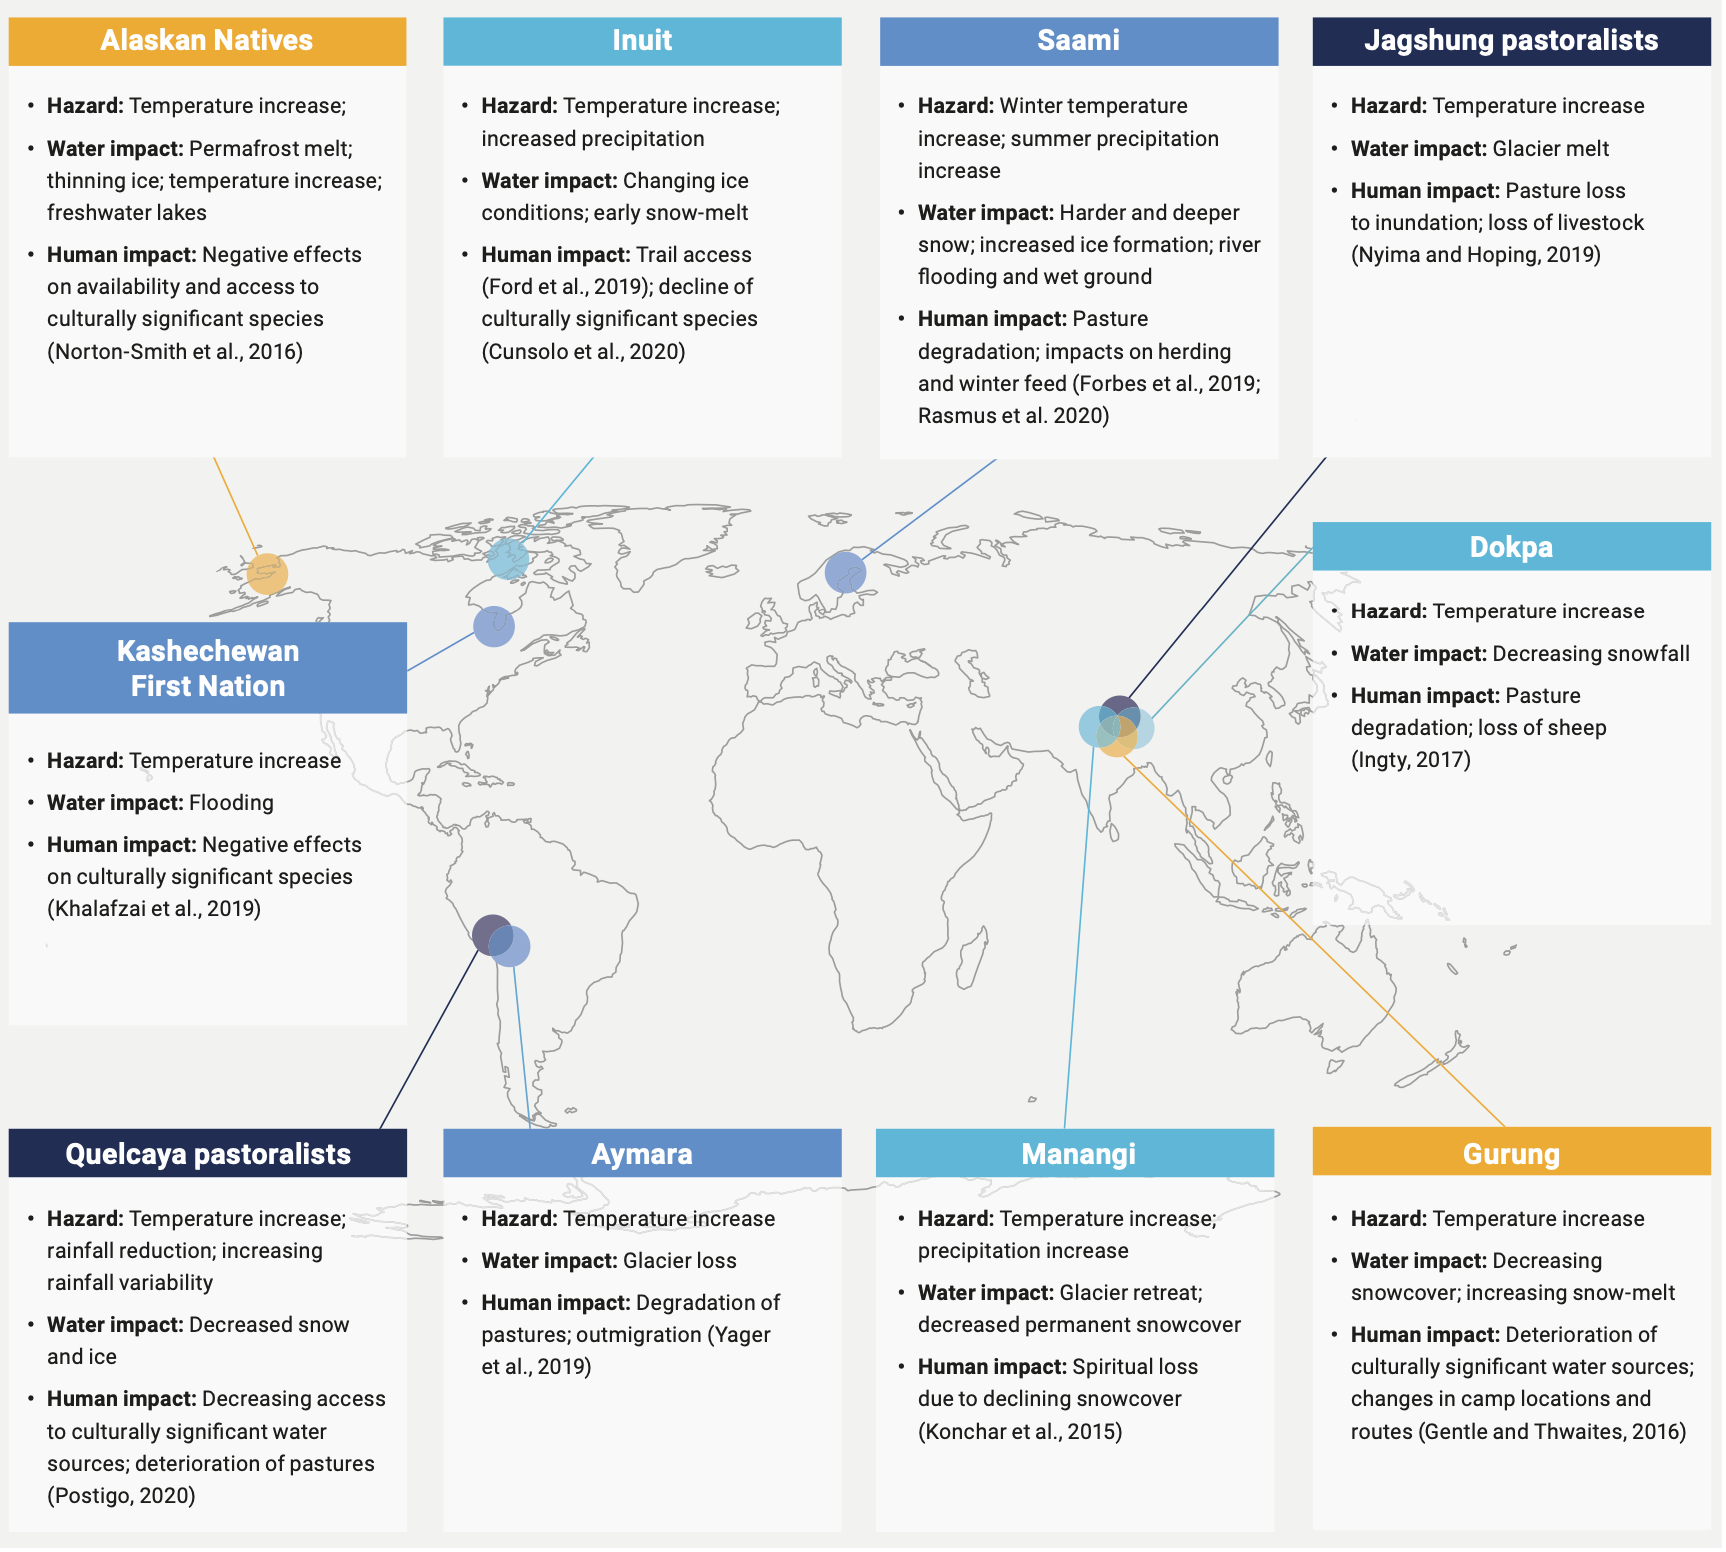
The map below shows more examples of the impacts of climate water and cryosphere changes on “Indigenous peoples and local communities in cold regions”.
Tenzing Chogyal Sherpa is a cryosphere analyst at the International Centre for Integrated Mountain Development. He tells Carbon Brief that glaciers are “the most visible and vivid indicators of a planet in crisis”.
He adds that glacier loss is already causing “the loss of life, loss of livelihood and most importantly of all, the loss of a place that many communities have called home for generations”.
Resilience-building
Mountains have a wide range of climates, geologies and vegetation types, creating an “exceptional need” for robust systems for collecting and managing hydrological data, the report says.
However, monitoring networks in the high mountains are currently “sparse” and models are low-resolution, resulting in “uncertain” observations and predictions, it notes.
For example, only 28 of the 50,000 glaciers in the Hindu Kush Himalaya currently have active monitoring of mass changes, the report says. Safe, accessible glaciers are often selected for monitoring, which can make observations biased, it adds.
To fill these gaps in data, the authors stress the importance of incorporating Indigenous knowledge and encouraging international collaboration.
Dr Aditi Mukherji – the director of the climate change, adaptation and mitigation impact action platform of the CGIAR – tells Carbon Brief that the report is an important call for more “adaptation efforts and funding”.
She says that mountain-dwelling communities are “already quite vulnerable due to their remote location and other developmental deficits” and are “increasingly losing their way of life due to no fault of theirs”.
Examples of adaptation are prominent throughout the report. For example, it highlights communities who are installing drainage pipes, artificial dams and early warming systems to lakes throughout the Andes to increase resilience against GLOFs.
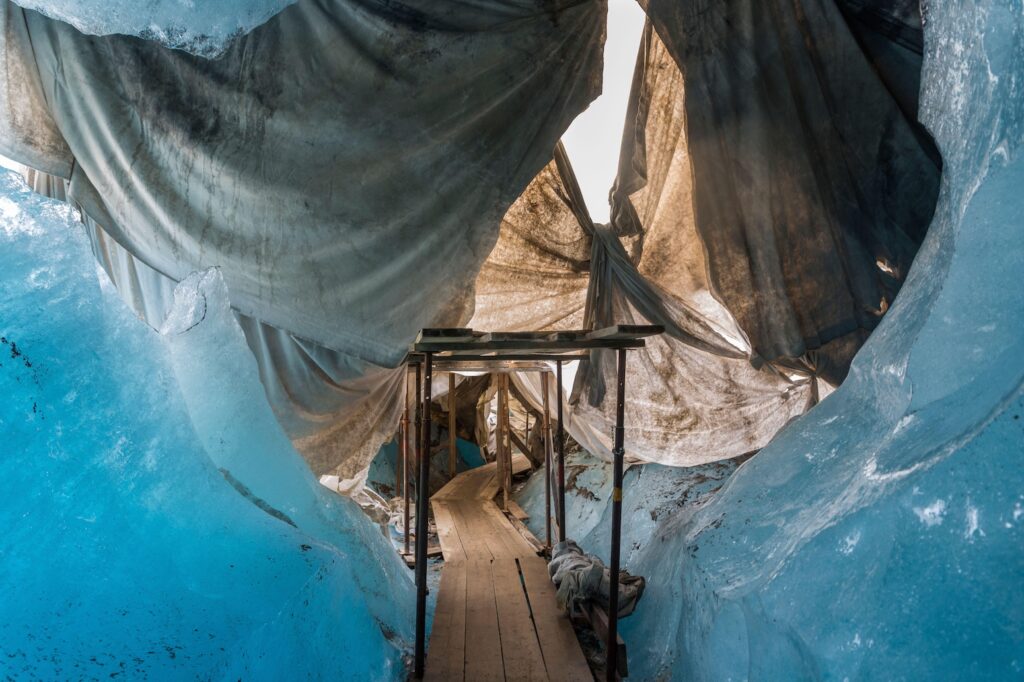
Meanwhile, the Rhône glacier in Valais, Switzerland, has been covered in white sheets designed to keep it cool. And in Ladakh, in northern India, villagers have developed four types of “ice reservoirs” to supplement water flow for agriculture in the spring.
Sahana Subramaniam – a PhD student at Lund University’s Centre for Sustainability Studies – welcomes the attention being given to glaciers this year to mark the UN-designated “international year of glacier preservation”.
She tells Carbon Brief about a wide range of conferences, panels, workshops and meetings being organised on the topic, many of which have been interdisciplinary in nature, bringing together physical and social scientists. “It’s quite seminal that so much attention is being given to this topic this year,” she adds.
Dr James Kirkham is a glaciologist and climate scientist at the International Cryosphere Climate Initiative. He tells Carbon Brief that the UN’s focus on glaciers and mountains this year could serve as a “springboard to help political leaders focus on the multi-lateral cooperation, political leadership [and] long-term thinking”.
The post Glacier melt threatens water supplies for two billion people, UN warns appeared first on Carbon Brief.
Glacier melt threatens water supplies for two billion people, UN warns

Three countries have been named by the Paris Agreement’s compliance committee for failing to submit a nationally determined contribution (NDC) and repeatedly snubbing offers of help with their climate plans.
After months of internal debate over whether to identify serial non-responders, the Paris Agreement’s Implementation and Compliance Committee (PAICC) named the three countries which have failed to engage with it over their NDCs on Friday.
It named Democratic Republic of Congo, Senegal and North Korea in a footnote of its annual report, adding that it decided to name them “with a view to facilitating engagement”, adding that representatives of the three nations had been invited to its meeting in early 2027 “with the purpose of identifying any challenges and constraints”.
“The Committee noted the importance of Parties engaging with the Committee in a timely manner, while noting that some delays may be due to the national capabilities and circumstances of the Parties”, the report said.
-
Under US pressure, World Bank says it will back gas “where appropriate”
The US wants the World Bank to expand its gas support while climate campaigners are pushing for it to end – its head spoke this week of limited backing for the fossil fuel -
IPCC scientists vow to press on with climate reports despite political deadlock
After governments again failed to agree a timeline, nearly 120 IPCC authors pledged to complete their assessment on time and with full scientific rigour -
Paris Agreement committee snubbed over missing NDC climate plans
Many governments have still not submitted a nationally determined contribution to the UN, breaching a key requirement of the Paris Agreement

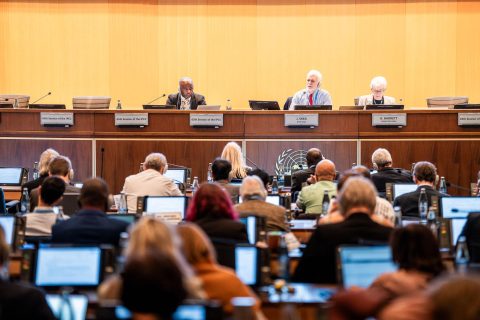

In July, PAICC said 12 countries had ignored its repeated attempts to discuss why they had not published an NDC as required every five years under the 2015 Paris accord.
Members of the committee had been divided over whether to name them, but at a September meeting decided to do so in their annual report to the annual climate COP summit.
By the time the report was published on Friday, only Congo, Senegal and North Korea “had not communicated an NDC or submitted a [Biennial Transparency Report] and had not yet responded to any of the Committee’s notifications, despite several reminders issued by the Committee in this regard”.
Rainforest and renewable energy ambitions
The silence from Congo and Senegal is notable because the former is home to much of the Congo Basin rainforest while the latter has sought billions of dollars in climate finance to support its renewable energy ambitions.
After Brazil, Congo has more rainforest than any country in the world. This forest, and the country’s peatlands, absorb huge amounts of greenhouse gas but are fast being lost to expanding farmland, charcoal production, logging and mining.
Senegal signed a Just Energy Transition Partnership with Canada and wealthy European nations in 2023, to help it meet its renewable energy targets under the-then government of Macky Sall. It was chair of the Least Developed Countries group between January 2022 and December 2023.

Tejas Rao, who is researching the PAICC as part of a doctoral thesis at Cambridge University, said the governments of the three countries should engage with the committee.
“Engagement costs these governments very little and the committee has shown it will listen,” he said.
“Silence leaves the committee with no basis to help, and it leaves the [governments] exposed to the narrative that they are simply disengaged,” he told Climate Home News.
Paris Agreement requirement
The 2015 Paris Agreement requires all parties to publish an NDC every five years outlining their emissions reduction targets, with each plan meant to be more ambitious than the country’s last NDC.
The latest set – the third round of plans, with new targets for 2035 – was due in February 2025. While most countries missed this deadline, all but around 30 – mostly small emitters but including Egypt, Vietnam and Argentina – have now submitted them.
Over the year, the PAICC – which is made up of government climate officials from developed and developing countries – has been communicating with governments that have not submitted NDCs and trying to overcome barriers to them doing so.
Some nations have cited exceptional circumstances as the reason for not submitting an NDC, a process that requires a significant amount of work in tracking emissions and consulting on how to curb them across the economy. For example, a letter from a Sudanese official to the PAICC, seen by Climate Home News, said that the country’s civil war had led to the suspension of its NDC preparation.
-
IPCC scientists vow to press on with climate reports despite political deadlock
After governments again failed to agree a timeline, nearly 120 IPCC authors pledged to complete their assessment on time and with full scientific rigour -
Under US pressure, World Bank says it will back gas “where appropriate”
The US wants the World Bank to expand its gas support while climate campaigners are pushing for it to end – its head spoke this week of limited backing for the fossil fuel -
Who shapes climate science? The equity question facing the IPCC
Early completion of the next global climate science assessment reports risks excluding research from the Global South, which is key to ensuring the findings are fair
The US and Iran are not signed up to the Paris Agreement and so do not have active NDCs, nor does Taiwan, which is not a UN member state.
Rao said that because the PAICC is “facilitative and non-punitive”, naming the countries “is meant to open a door, not close one – the invited consultation is the point”.
“In recent months, governments that explained their constraints, whether capacity, finance or domestic process, have been met with follow-up and support rather than sanction, and the number of silent governments has fallen sharply,” Rao said.
The post Paris Agreement committee names three countries snubbing it over NDCs appeared first on Climate Home News.
Paris Agreement committee names three countries snubbing it over NDCs