Connect with us

Published

on

The United States is taking a decisive step to rebuild its nuclear fuel supply chain. The Department of Energy has announced a $2.7 billion investment over the next decade to expand domestic uranium enrichment. This move aims to strengthen energy security, reduce dependence on foreign suppliers, and support the next phase of nuclear power growth.

The announcement also reflects a shift in how the U.S. views nuclear energy. Once seen mainly as a legacy power source, nuclear is now positioned as a strategic solution for rising electricity demand, artificial intelligence growth, industrial resilience, and long-term climate goals.

Secretary of Energy Chris Wright said:

“President Trump is catalyzing a resurgence in the nation’s nuclear energy sector to strengthen American security and prosperity. “Today’s awards show that this Administration is committed to restoring a secure domestic nuclear fuel supply chain capable of producing the nuclear fuels needed to power the reactors of today and the advanced reactors of tomorrow.”

To understand why this matters, it helps to look at how DOE is deploying the funding and at where the U.S. stands today.

How the DOE Is Deploying the Funding

Last year, the DOE signed contracts with six enrichment companies, allowing them to compete for future work. Now, the department has awarded task orders to three companies under a strict milestone-based structure to ensure accountability.

  • American Centrifuge Operating received $900 million to establish domestic HALEU enrichment capacity.
  • General Matter also received $900 million to develop HALEU production.
  • Orano Federal Services secured $900 million to expand LEU enrichment within the United States.

Together, these projects will help maintain fuel supplies for the nation’s 94 operating nuclear reactors. At the same time, they will create a foundation for future advanced reactors that are still moving through development and licensing.

Importantly, this funding not only supports fuel production. It also drives job creation, strengthens domestic manufacturing, and restores confidence in the U.S. nuclear ecosystem.

HALEU Changes the Nuclear Equation and the U.S. Must Act on Uranium Enrichment

Uranium enrichment plays a critical role in nuclear power. Most U.S. reactors operate on low-enriched uranium, or LEU. However, advanced reactors, including small modular reactors and next-generation designs, require high-assay low-enriched uranium, known as HALEU.

For years, the U.S. relied heavily on foreign enrichment services. In fact, the country currently performs less than 1% of global uranium enrichment. This reliance has raised serious concerns about energy security and supply reliability, especially as new rules will restrict imports of Russian uranium starting in 2028.

As a result, rebuilding domestic enrichment capacity has become urgent. The DOE’s $2.7 billion investment directly addresses this vulnerability by accelerating U.S.-based production of both LEU and HALEU.

us uranium nuclear reactor

Upstream Supply Remains a Weak Link

While enrichment capacity is expanding, upstream uranium production still faces challenges.

EIA revealed that, in the third quarter of 2025, U.S. uranium concentrate production fell to 329,623 pounds of U₃O₈, a sharp drop from the previous quarter. Production came from only six facilities, mainly located in Wyoming and Texas.

This decline highlights a broader issue. Rebuilding the full nuclear fuel cycle requires coordinated growth across mining, processing, enrichment, and fuel fabrication. Progress in one area must be matched by investment in others.

U.S. Uranium

Orano’s Oak Ridge Project Anchors to DOE Funding

One of the most significant projects tied to the DOE funding is Orano’s planned enrichment facility in Oak Ridge, Tennessee.

Known as the IKE project, the facility will provide a new domestic source of enriched uranium. Orano plans to finalize contracts and submit its license application to the U.S. Nuclear Regulatory Commission in the first half of 2026.

Once operational, the plant will help U.S. utilities comply with regulations that ban Russian uranium imports after 2028. It will also support rising electricity demand linked to AI, data centers, and broader electrification.

Nicolas Maes, Chief Executive Officer of Orano, commented,

“This is excellent news for Orano and a decisive step forward on our project for an enrichment plant in the USA! This recognition by the US authorities is an illustration of the confidence they have in our expertise and our capacity to deploy our technology to ensure robust security of supply to our customers.”

AI Growth Shows Why Nuclear Matters

Beyond energy security, another powerful force is shaping this investment: artificial intelligence.

As AI systems grow more complex, demand for computing power continues to surge. Data centers require vast amounts of electricity that must be reliable, affordable, and available around the clock. Renewable energy alone often cannot meet this need without firm backup power.

This is where advanced nuclear reactors come into play. General Matter has highlighted that AI leadership depends on expanding both compute capacity and electricity production. Gen IV small modular reactors, fueled by HALEU, can provide steady power either directly to data centers or through the grid.

By powering AI infrastructure behind the meter, nuclear reactors reduce pressure on public grids while delivering low-carbon electricity. As a result, nuclear fuel is increasingly seen as a critical input for the digital economy.

AI demand
Source: McKinsey

Keeps Industry and Remote Sites Running

Nuclear energy powers U.S. manufacturing, supplying factories, refineries, and heavy industries with stable, affordable electricity. Disruptions can slow production and raise costs, so a reliable LEU supply is essential. Today, reactors provide nearly 20% of U.S. electricity and almost half of emissions-free power.

Small, containerized microreactors fueled by HALEU are emerging for remote or harsh locations, including military bases, mining sites, and disaster zones. These systems run long with minimal maintenance, delivering dependable power and driving demand for HALEU, strengthening America’s domestic nuclear fuel infrastructure.

The Future of Enrichment Goes Laser-Fast

To support long-term innovation, the DOE also awarded $28 million to Global Laser Enrichment (GLE). The company is advancing the SILEX laser enrichment technology, which promises higher efficiency and lower energy use compared to traditional methods.

GLE has reached Technology Readiness Level 6 and has submitted a full license application for its Paducah facility. If deployed commercially, laser enrichment could significantly improve the economics and flexibility of nuclear fuel production.

Taken together, these developments signal a strategic reset. The DOE’s $2.7 billion investment reflects a clear decision to treat nuclear fuel as a national priority. By strengthening domestic enrichment, supporting advanced reactors, and backing innovation, the U.S. is positioning nuclear energy as a cornerstone of its future energy system.

In an era defined by AI growth, rising electricity demand, and climate pressure, nuclear power is no longer just part of the mix. It is becoming a central pillar of American progress.

The post DOE’s $2.7 Billion Push for Uranium Enrichment Rebuilds U.S. Energy Security appeared first on Carbon Credits.

Continue Reading

Carbon Footprint

$10 Trillion in Carbon Cost? How U.S. Emissions Hit the Global Economy

Published

on

$10 Trillion in Carbon Cost? How U.S. Emissions Hit the Global Economy

Climate change is not only a physical threat, but it also affects the world’s economy. A major new study published in the journal Nature on March 25, 2026, puts a clear number on this impact. It finds that carbon dioxide (CO₂) emissions from the United States caused about $10.2 trillion in total economic damage worldwide between 1990 and 2020. This makes the U.S. the largest single contributor to climate-related economic loss over that period.

The study shows that emissions slow economic growth in many countries. Rising temperatures cut productivity, lower output, and hurt long-term economic performance around the globe.

Marshall Burke, the lead author of the study, remarked:

“If you warm people up a little bit, we see very clear historical evidence, you grow a little bit less quickly. If you accumulate those effects over 30 years, you just get a really large change by the end of 30 years. It’s like death by a thousand cuts. And you have people being harmed who did not cause the problem, and that feels just fundamentally unfair.”

The researchers focused on carbon dioxide, the most common greenhouse gas. They used data on how temperature affects economic activity and then linked that to how much CO₂ different countries have emitted since 1990. This method links climate science to real economic results, including slower growth, lower productivity, and smaller national outputs.

Counting the Dollars: $10 Trillion in U.S.-Linked Damage

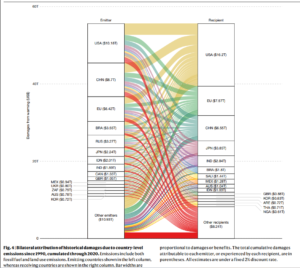
One of the study’s central findings is striking. From 1990 to 2020, U.S. emissions likely caused around $10.2 trillion in global economic damage. This means that warming linked to U.S. emissions has reduced economic production across many countries. The study links these impacts to heat’s long-term effects on labor, agriculture, and overall economic growth.

The damage is not confined to other nations. Roughly 30% of that $10.2 trillion figure is estimated to have occurred within the United States itself. In other words, U.S. emissions have slowed economic growth at home as well as abroad. The remaining impacts are spread across the global economy.

The researchers found that U.S. emissions led to about $500 billion in damage in India and around $330 billion in Brazil during that time. These figures show how carbon released in one area can affect economies far away.

economic damage of global warming
Source: Burke, M., Zahid, M., Diffenbaugh, N.S. et al. Quantifying climate loss and damage consistent with a social cost of carbon. Nature 651, 959–966 (2026). https://doi.org/10.1038/s41586-026-10272-6

A New Framework for Loss and Damage

The Nature study introduces a new framework for assessing what scientists call “loss and damage.” This term refers to harms that cannot be prevented by reducing emissions or avoided through adaptation alone.

The study uses economic data and climate models. It tracks how temperature changes over the years impact economic output.

  • To put the numbers into context: one tonne of CO₂ emitted in 1990 is estimated to have caused about $180 in global economic damages by 2020.

But that same tonne is projected to cause an additional $1,840 of cumulative damage by 2100, as warming continues and its effects compound over time. This highlights that past emissions still contribute to future economic harm.

The researchers highlight that these estimates focus on economic output, like goods and services. They do not account for all types of climate damage. They do not include costs from loss of life, health impacts, biodiversity collapse, cultural heritage losses, or many kinds of infrastructure damage. These excluded impacts could raise the true total cost of climate change even further.

The Social Cost of Carbon Revisited

This study is part of a broader scientific effort to understand the economic impacts of climate change. Climate and economic models show that rising temperatures are already slowing economic growth. If emissions stay high, this slowdown will get worse in the future.

Analyses by major international institutions and research groups project that climate change could reduce global GDP by a significant percentage by mid-century. This is compared to scenarios with strong mitigation, though exact figures vary by method.

The concept of estimating a “social cost of carbon” (SCC) — a monetary estimate of economic damage per tonne of CO₂ — has been used in policy analysis for years. It helps governments weigh trade-offs in climate policy. For example, they can decide how much to invest in emissions cuts versus adaptation.

social cost of carbon
Source: Resources for the Future

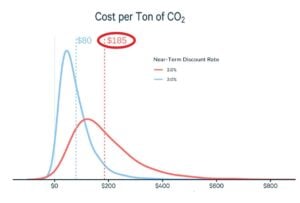
However, traditional SCC estimates have been debated. They depend on assumptions about future growth, discount rates, and climate sensitivity. The Nature study advances this approach by tying economic outcomes directly to observed climate impacts.

Economists and climate scientists agree that warming impacts several areas. These include agricultural yields, labor productivity, energy demand, and health outcomes. These effects reduce economic output and increase costs for businesses and governments. The latest research makes these links more explicit by assigning dollar values to the historical impacts of emissions.

Equity and Global Responsibility

The research’s results also highlight important equity questions. Low-income countries often face bigger economic impacts compared to their emissions histories.

For example, nations with warmer climates and more fragile infrastructure may experience greater output losses due to temperature increases. These effects grow over time and can worsen existing development challenges.

At the same time, richer countries with higher historical emissions may take a larger share of responsibility for damage. The Nature study shows it is possible to calculate responsibility in monetary terms. However, turning those numbers into legal or financial obligations is still complex.

Remarkably, the paper also shows that climate damage can be linked to specific activities, individuals, and companies. Burning fossil fuels for long flights greatly adds to warming.

  • Just one round-trip intercontinental flight each year for ten years can cause about $25,000 in global economic damage by 2100.

Estimated damages from emissions related to individual behaviors or firm output over varying time periods
Estimated damages from emissions related to individual behaviors or firm output over varying time periods. Source: https://doi.org/10.1038/s41586-026-10272-6

Bill Gates’ emissions stand out due to his frequent air travel and high energy use. These personal and business choices significantly contribute to his overall impact. Saudi Aramco, a top fossil fuel producer, has caused an estimated $3 trillion in climate-related economic damage worldwide since 1991.

Tail Risks and Future Costs

The researchers also point toward the future. It finds that future damages from past emissions are much larger than the losses already accrued.

Since CO₂ remains in the atmosphere for centuries, its warming effects — and the economic damages linked to them — will persist well beyond 2020. This “tail risk” means that the total cost of historical emissions could rise sharply over the rest of this century.

Climate risk is increasingly integrated into economic planning and finance. Governments, businesses, and international institutions are incorporating climate scenarios into investment decisions and risk models.

This includes assessing how rising temperatures may affect infrastructure costs, insurance markets, supply chains, and national budgets. Without strong mitigation and adaptation measures, these economic pressures are expected to grow.

A Shared Reality, Quantified

The Nature study offers a clear and data-based way to think about the economic harms of climate change. Emissions from the United States since 1990 have caused over $10 trillion in global economic damage. This includes harm in the U.S., India, and Brazil

These findings do not assign legal liability. However, they provide a meaningful picture of how climate change affects the global economy in terms of the social costs of carbon. They show that the costs of climate impacts are measurable and significant.

As the world continues to adapt and respond to climate change, understanding these economic links will be crucial for policymakers, businesses, and communities.

The post $10 Trillion in Carbon Cost? How U.S. Emissions Hit the Global Economy appeared first on Carbon Credits.

Continue Reading

Carbon Footprint

Verra to Launch Scope 3 Standard in 2026: A New Era for Value Chain Carbon Tracking

Published

on

Verra is moving closer to launching its long-awaited Scope 3 Standard (S3S) Program, with version 1.0 phase 1 now scheduled for Q3 2026. This first release will allow companies to list project pipelines using an initial set of S3S-adapted methodologies. Although the timeline is slightly later than expected, the delay reflects a deeper push to build a stronger, more reliable system.

This move shows a clear focus on quality and long-term impact. Verra is not rushing the launch. Instead, it is taking time to improve the system. The team is refining technical frameworks, learning from pilot projects, and aligning with global standards. As a result, the final program will be stronger and easier to use. It is also likely to attract more companies and drive real climate action across supply chains.

Verra Aligns the Program With Global Climate Standards

Verra is working closely with companies, project developers, and climate experts. The goal is simple. Build a program that is practical, reliable, and easy to trust.

The extra time helps improve how the system connects with existing carbon markets. It also allows Verra to upgrade its digital tools and infrastructure. At the same time, lessons from pilot projects are shaping the final design. These pilots tested how existing Verified Carbon Standard (VCS) methods can work for Scope 3 projects in real conditions.

Training is another key focus. Verra is creating clear guidelines and support tools for project developers. This will help users understand the system quickly and scale their projects without delays.

Finally, the new timeline helps align the program with major global frameworks. These include updated climate standards and carbon accounting rules. This alignment will make the program more relevant and widely accepted.

How the Scope 3 Standard Will Transform Supply Chain Emissions

Scope 3 emissions are the biggest part of a company’s carbon footprint. In many sectors, they make up more than 75% of total emissions. These emissions do not come from a company’s own operations. Instead, they come from its supply chain—both before and after production.

Verra’s S3S Program aims to fix this problem in the following ways:

  • It brings a clear and trusted system to measure and manage these emissions.
  • Companies will be able to track real emission cuts and carbon removals in their value chains.

Explaining further, the program uses a strong measurement system. Companies will follow simple and consistent methods to calculate emissions. Then, independent auditors will check the data. This step builds trust and ensures the results are real.

New Carbon Units for Clear Tracking

Verra also introduces a new unit system. Project developers will receive Intervention Units (IUs). Companies will receive Scope 3 Intervention Units (S3IUs). These units will be recorded in a public registry. This makes tracking easy and avoids double-counting.

Co-Investment Drives Supply Chain Action

Another key feature is co-investment. Companies can invest in projects within their supply chains. In return, they can claim verified climate benefits. This system encourages suppliers, buyers, and investors to work together.

Understanding the Scale of Scope 3 Emissions

Unlike Scope 1 and 2, Scope 3 emissions cover the full value chain. They include both upstream and downstream activities.

Upstream emissions come from things a company buys. This includes raw materials, equipment, and transport. Downstream emissions happen after a product is sold. These include product use, delivery, and disposal.

The Greenhouse Gas Protocol lists more than 15 categories under Scope 3. These include goods, travel, waste, and investments. However, not every category applies to every business.

For example, a service company may have fewer downstream emissions. In contrast, a manufacturing company may see large emissions from product use and supply chains.

scope 3 emissions
Source: Greengage

Closing the Gap in Carbon Markets

Many companies want to cut Scope 3 emissions. But they face a big challenge. There are no simple and clear rules to follow. Because of this, companies often feel unsure. They do not know how to measure emissions or report results correctly. This slows down investment in supply chain projects.

As explained before, Verra’s S3S Program offers clear rules and a strong system, and also uses third-party checks and transparent tracking. As a result, companies can now invest in projects and trust the results. Finally, the outcome will be more money inflow into supply chain climate solutions.

The program also improves carbon markets. Until now, most systems have focused on standalone projects. But S3S connects emission cuts directly to company supply chains. This creates a more complete and practical approach.

Aligned With Global Climate Standards

Another strong point of the S3S Program is its global alignment. Verra designed it to match major climate frameworks.

  • It works alongside the Greenhouse Gas Protocol’s new standards. It also aligns with the updated net-zero rules from the Science Based Targets initiative (SBTi).
  • In addition, it connects with new frameworks from the AIM Platform and the Taskforce for Corporate Action Transparency (TCAT).
  • Most importantly, it aligns with Verra’s Verified Carbon Standard (VCS) version 5, released in December 2025.

This version improves the quality and trust in carbon credits. By linking with VCS 5, the S3S Program builds on a strong and proven system.

From Pilot Phase to Real-World Action

In 2025, Verra moved the program from planning to testing. It launched pilot projects and asked for public feedback.

These pilots were very useful. They showed what works and what needs improvement. They also helped adapt existing methods for real-world use. At the same time, it built the program’s structure. It set up rules, governance, and funding systems.

Verra is working with partners like the Value Change Initiative and SustainCERT. These groups help improve the program and keep it aligned with global best practices.

A Turning Point for Corporate Climate Action

Companies today face strong pressure to cut emissions. Scope 3 is the hardest part to manage, but also the most important.

Verra’s S3S Program offers a clear solution. It gives companies a simple and trusted way to act on supply chain emissions. By standardizing how emissions are measured and reported, the program makes climate action easier. It also opens new doors for investment and collaboration.

In the bigger picture, this program can support global climate goals. It helps reduce emissions at scale and strengthens trust in carbon markets.

With its 2026 launch coming soon, Verra’s Scope 3 Standard could become a key tool for companies worldwide—turning climate goals into real, measurable results.

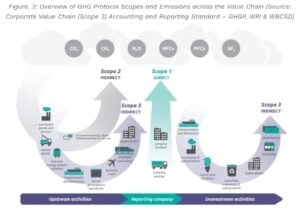
The post Verra to Launch Scope 3 Standard in 2026: A New Era for Value Chain Carbon Tracking appeared first on Carbon Credits.

Continue Reading

Carbon Footprint

Oil Shock Ignites Chinese EV Export Surge Around the World

Published

on

Oil Shock Ignites Chinese EV Export Surge Around the World

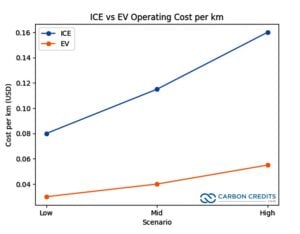
Rising global oil prices are driving up demand for electric vehicles (EVs), with Chinese brands emerging as key beneficiaries. Recent spikes in crude prices are driven by heightened tensions in the Middle East and disruptions in the Strait of Hormuz, a critical oil shipping route.

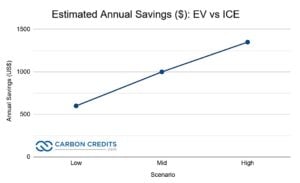
These factors have pushed Brent crude above $100 per barrel and created instability in fuel markets. This has pushed many consumers to rethink fuel costs and consider EV alternatives. Higher fuel prices increase running costs for gasoline and diesel cars, making EV ownership more economical in many markets.

Chinese EVs Gain Speed Abroad

Dealers in countries like Australia and parts of Southeast Asia see growing interest in Chinese EVs. This rise comes as fuel prices increase.

Showrooms selling Chinese new energy vehicles (NEVs) are seeing more test drives, customer inquiries, and rising order volumes. In Australia, the EV market share hit a record high of 11.8% for vehicle sales. Analysts say this jump is partly due to rising petrol prices.

Chinese manufacturers like BYD, GWM, and Chery are rapidly growing abroad. Some dealers see more walk-ins and more customers buying EVs.

China’s EV industry is now the largest in the world. In 2024, Chinese automakers produced over 12.87 million plug‑in electric vehicles (PEVs), including battery electric (BEV) and plug‑in hybrid models, accounting for nearly 47.5% of total automobile production. That figure marked a strong year‑on‑year rise and underscored China’s industrial scale and export readiness.

global EV sales 2024 china lead
Source: IEA

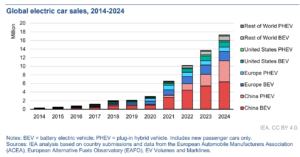
By late 2025, more than 51% of all new vehicles sold in China were electric — a major shift from just a few years earlier.

This domestic scale provides an export advantage. Chinese EVs often cost less than similar European and North American models. This helps them succeed in markets where fuel costs hit household budgets hard.

Fuel Costs Drive Behavior Shift

Rising oil prices are a major driver of these sales trends. Global crude prices have fluctuated due to geopolitical tensions. The Strait of Hormuz route carries around 20% of the world’s oil trade. These disruptions pushed crude prices sharply higher in early 2026.

In many countries, higher retail fuel prices translate into more immediate cost pressures for consumers. Reports from countries like Australia show petrol prices over $2.50 per litre. This rise is making consumers think about EVs to lower long-term costs.

When oil prices rise, the cost gap between internal combustion engine (ICE) or gasoline cars and EVs becomes much larger. For example, at $100 per barrel oil, gasoline prices in many markets can reach about $1.20–$1.50 per liter (or $4.50–$5.50 per gallon).

ICE vs EV operating cost per km
Sources: Estimates from ICCT, IEA, U.S. DOE

At this level, a typical ICE vehicle may cost around $0.12–$0.18 per km in fuel, while an EV typically costs $0.03–$0.06 per km in electricity. This means EVs can be 2 to 4 times cheaper to run per kilometer.

Over a year, drivers can save roughly $600 to $1,500, depending on mileage and local energy prices.

Annual savings ev vs ice

Global EV Market Trends and Forecasts

The surge in Chinese EV exports aligns with broader global trends. Major industry forecasts suggest that global sales of battery electric and plug-in hybrid vehicles may top 22 million units by 2025. This could represent about 25% of all new car sales worldwide.

Global electric vehicle sales in 2025 reached nearly 21 million units, including both battery electric vehicles and plug‑in hybrid electric vehicles. This total represents a significant increase, roughly 20 % more than in 2024.

China’s share in this global growth is large. In 2024, Chinese manufacturers made up around 70% of all EV exports. This shows China’s key role in supply chains and manufacturing.

As oil demand growth slows due to EV uptake, some forecasts suggest that EVs could displace millions of barrels of global oil demand each day in the coming decade. By 2030, EV adoption could cut about 5 million barrels per day of oil use, according to major energy outlooks.

Trade Barriers vs Expansion

Despite strong export gains, barriers remain. Some regions have imposed tariffs and trade restrictions on Chinese EVs, and infrastructure gaps in charging networks can slow adoption. For example, tariffs exceeding 100% on certain Chinese EV imports in the U.S. have limited market share there.

However, Chinese OEMs are developing supplier and shipping capacity to support overseas demand. In 2025, China’s electric car makers expanded shipping through roll‑on/roll‑off carriers capable of transporting more than 30,000 vehicles, improving export logistics.

Emerging markets in Southeast Asia, Latin America, and Oceania are also showing rising EV interest. In the Philippines and Vietnam, dealerships see EV orders growing quickly. Some are even doubling their weekly sales, thanks to high fuel costs.

In India, where oil imports make up a big part of the economy, rising petrol costs make running traditional fuel vehicles more expensive. This has helped boost interest in electric vehicles, which are cheaper to operate when fuel is costly. Notably, the share of ICE retailers fell by over 25% in March.

share of gas cars in India fell bloomberg

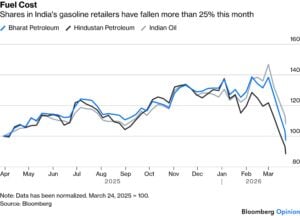
Indian consumers and businesses view EVs as a way to shield against unstable oil prices. This also helps lower fuel costs, supporting the country’s move to electric transport.

What This Means for Energy and Transport Futures

The convergence of high oil prices and strong EV supply from China is creating a feedback loop. Higher fuel costs push consumers to consider EVs more seriously. Chinese manufacturers are well positioned to fill that demand with competitive pricing and large production scale.

The shift could speed up the move from fossil fuel cars to electric vehicles worldwide. This is especially true in price-sensitive and emerging markets. EV adoption also has implications for oil demand trends.

  • As battery and charging tech get better and EV markets grow, oil use — especially in transport — might slow down or peak sooner than we thought.

At the same time, governments and industry groups are tracking these shifts closely. Policies that support charging infrastructure, EV incentives, and emissions standards will influence how quickly the global fleet electrifies.

Ultimately, the current oil price shock may have sparked a shift in global automotive markets — one where Chinese EVs take an increasingly central role in transport electrification worldwide.

The post Oil Shock Ignites Chinese EV Export Surge Around the World appeared first on Carbon Credits.

Continue Reading

Trending

Copyright © 2022 BreakingClimateChange.com