

Gabrielle Dreyfus is chief scientist at the Institute for Governance and Sustainable Development, Thomas Röckmann is a professor of atmospheric physics and chemistry at Utrecht University, and Lena Höglund Isaksson is a senior research scholar at the International Institute for Applied Systems Analysis.
This March scientists and policy makers will gather near the site in Italy where methane was first identified 250 years ago to share the latest science on methane and the policy and technology steps needed to rapidly cut methane emissions. The timing is apt.
As new tools transform our understanding of methane emissions and their sources, the evidence they reveal points to a single conclusion: Human-caused methane emissions are still rising, and global action remains far too slow.
This is the central finding of the latest Global Methane Status Report. Four years into the Global Methane Pledge, which aims for a 30% cut in global emissions by 2030, the good news is that the pledge has increased mitigation ambition under national plans, which, if fully implemented, could result in the largest and most sustained decline in methane emissions since the Industrial Revolution.
The bad news is this is still short of the 30% target. The decisive question is whether governments will move quickly enough to turn that bend into the steep decline required to pump the brake on global warming.
What the data really show
Assessing progress requires comparing three benchmarks: the level of emissions today relative to 2020, the trajectory projected in 2021 before methane received significant policy focus, and the level required by 2030 to meet the pledge.
The latest data show that global methane emissions in 2025 are higher than in 2020 but not as high as previously expected. In 2021, emissions were projected to rise by about 9% between 2020 and 2030. Updated analysis places that increase closer to 5%. This change is driven by factors such as slower than expected growth in unconventional gas production between 2020 and 2024 and lower than expected waste emissions in several regions.
Gas flaring soars in Niger Delta post-Shell, afflicting communities
This updated trajectory still does not deliver the reductions required, but it does indicate that the curve is beginning to bend. More importantly, the commitments already outlined in countries’ Nationally Determined Contributions and Methane Action Plans would, if fully implemented, produce an 8% reduction in global methane emissions between 2020 and 2030. This would turn the current increase into a sustained decline. While still insufficient to reach the Global Methane Pledge target of a 30% cut, it would represent historical progress.
Solutions are known and ready
Scientific assessments consistently show that the technical potential to meet the pledge exists. The gap lies not in technology, but in implementation.
The energy sector accounts for approximately 70% of total technical methane reduction potential between 2020 and 2030. Proven measures include recovering associated petroleum gas in oil production, regular leak detection and repair across oil and gas supply chains, and installing ventilation air oxidation technologies in underground coal mines. Many of these options are low cost or profitable. Yet current commitments would achieve only one third of the maximum technically feasible reductions in this sector.
Recent COP hosts Brazil and Azerbaijan linked to “super-emitting” methane plumes
Agriculture and waste also provide opportunities. Rice emissions can be reduced through improved water management, low-emission hybrids and soil amendments. While innovations in technology and practices hold promise in the longer term, near-term potential in livestock is more constrained and trends in global diets may counteract gains.
Waste sector emissions had been expected to increase more rapidly, but improvements in waste management in several regions over the past two decades have moderated this rise. Long-term mitigation in this sector requires immediate investment in improved landfills and circular waste systems, as emissions from waste already deposited will persist in the short term.
New measurement tools
Methane monitoring capacity has expanded significantly. Satellite-based systems can now identify methane super-emitters. Ground-based sensors are becoming more accessible and can provide real-time data. These developments improve national inventories and can strengthen accountability.
However, policy action does not need to wait for perfect measurement. Current scientific understanding of source magnitudes and mitigation effectiveness is sufficient to achieve a 30% reduction between 2020 and 2030. Many of the largest reductions in oil, gas and coal can be delivered through binding technology standards that do not require high precision quantification of emissions.
The decisive years ahead
The next 2 years will be critical for determining whether existing commitments translate into emissions reductions consistent with the Global Methane Pledge.
Governments should prioritise adoption of an effective international methane performance standard for oil and gas, including through the EU Methane Regulation, and expand the reach of such standards through voluntary buyers’ clubs. National and regional authorities should introduce binding technology standards for oil, gas and coal to ensure that voluntary agreements are backed by legal requirements.
One approach to promoting better progress on methane is to develop a binding methane agreement, starting with the oil and gas sector, as suggested by Barbados’ PM Mia Mottley and other leaders. Countries must also address the deeper challenge of political and economic dependence on fossil fuels, which continues to slow progress. Without a dual strategy of reducing methane and deep decarbonisation, it will not be possible to meet the Paris Agreement objectives.
Mottley’s “legally binding” methane pact faces barriers, but smaller steps possible
The next four years will determine whether available technologies, scientific evidence and political leadership align to deliver a rapid transition toward near-zero methane energy systems, holistic and equity-based lower emission agricultural systems and circular waste management strategies that eliminate methane release. These years will also determine whether the world captures the near-term climate benefits of methane abatement or locks in higher long-term costs and risks.
The Global Methane Status Report shows that the world is beginning to change course. Delivering the sharper downward trajectory now required is a test of political will. As scientists, we have laid out the evidence. Leaders must now act on it.
The post Curbing methane is the fastest way to slow warming – but we’re off the pace appeared first on Climate Home News.
Curbing methane is the fastest way to slow warming – but we’re off the pace

Climate Change
Coal mine approval as Albanese meets Pacific leaders undermines Pacific partnership, as UN warns of 1.5C overshoot
SYDNEY, Thursday 3 September 2026 — Greenpeace Australia Pacific has branded the Albanese government’s approval of BHP’s coal mine extension in Central Queensland an affront to Pacific leaders and communities grappling with climate disasters, and a reckless move that undermines Australia’s partnership with the Pacific as the PM meets regional leaders at the Pacific Islands Forum.
The approval of BHP’s coal Saraji Mine Grevillea Pit Continuation Project, an extension of one of Australia’s largest coal mines, would allow mining to continue for another 30 years, locking in the production and export of polluting coal and fuelling dangerous extreme weather disasters and sea level rise in Australia and across the Pacific. It will be the 10th fossil fuel project approved during this term of government and the 37th new fossil fuel project approved since the Albanese government was elected in 2022.
The announcement comes as a UN report warns of dangerous climate overshoot, and just two months before Federal Climate and Energy Minister Chris Bowen is due to take the reins of UN climate negotiations at COP31 — a moment that will test the government’s climate credibility and bring global attention to Australia’s fossil fuel exports. It also comes as fracked gas from the Beetaloo Basin climate bomb started flowing.
Speaking from Palau, Dr Simon Bradshaw, COP31 Lead at Greenpeace Australia Pacific, said: “It is deeply insincere for Prime Minister Albanese to meet Pacific leaders here in Palau to discuss security, the energy crisis, and regional threats, while his government fast-tracks the biggest security threat to the Pacific, the climate crisis.
“As leaders meet, thousands remain missing or dead in the Nepal-Tibet floods. Parts of Australia are bracing for a heatwave that will see temperatures approach 40 degrees, just days out of winter, and a new report finds 2,000 kilometres of coral reefs along the WA coast experienced the worst coral bleaching on record.
“We are witnessing dangerous climate change driven by the production, export and burning of fossil fuels, wreaking havoc across the world. Continuing down the path of fossil fuels and approving new coal is an act of recklessness at a pivotal moment in the world’s energy transition and response to the climate crisis. Communities must not pay the price for fossil fuel greed.
“No more double talk. Australia must get squarely behind longstanding Pacific leadership on climate change, fight to protect the all-important goal of limiting warming to 1.5°C, and ensure that COP31 builds further momentum in the global transition away from fossil fuels.
“A pathway back to 1.5°C is possible. The Pacific Pre-COP and COP31 in Türkiye are critical moments for Australia to work with Pacific leaders to better align energy, climate and trade policies towards a prosperous shared future beyond fossil fuels.”
-ENDS-
Media contact
Kate O’Callaghan on 0406 231 892 or kate.ocallaghan@greenpeace.org
China’s carbon dioxide (CO2) emissions fell by 1% in the second quarter of 2026, as oil consumption plummeted amid the strait of Hormuz crisis.
The country’s use of oil fell by 9% overall and by 16% for transport, after the disruptions to supply from the Gulf through the strait.
This guest post is by:
Lauri Myllyvirta, lead analyst at the Centre for Research on Energy and Clean Air
China’s total CO2 emissions fell despite a continued rebound in coal-fired power generation.
This is the first time that reductions in oil consumption have been responsible for a fall in CO2 emissions overall – in all previous cases, coal consumption has been the main driver.
Other key findings for the second quarter of 2026 include:
- Electric vehicles (EVs) and public transport have become key factors in China’s oil demand, enabling transportation levels to increase even as fuel use fell sharply.
- The effect of EVs on oil consumption was almost twice as large as would be expected based on the increase in the number of EVs on the road alone, as the usage of existing EVs surged.
- Oil consumption displaced by EVs in China in the first half of 2026 exceeded the UK’s total oil consumption over a six-month period.
- These structural factors are not sufficient to account for the size of the fall in oil consumption, leaving behaviour changes as the other explanation.
- “Curtailment” of solar and wind output caused coal power to rise, despite strong hydro output, solar and wind capacity growth, as well as slower demand growth.
- Major increases in coal-power capacity and a power market that continues to favour coal limited the amount of coal generation displaced by new wind and solar capacity.
- Defying expectations of a boom, annual growth in coal use for chemicals production slowed down to 8%, from 15% in 2025 and 19% in the first quarter.
The second quarter of 2026 was a busy time for China’s government planners, with numerous energy-related five-year plan documents being released.
These plans list new measures to address solar and wind curtailment, as well as signalling a higher bar for the approval of new coal-power plants, but add few new quantitative targets.
After a 2% increase in the first quarter of 2026 and a 1% decline in the second, emissions are up marginally across the first half of the year, but they remain below their peak in 2023-24.
In addition, China is on track to add enough wind, solar, nuclear and hydropower this year to cover electricity demand growth, despite a slowdown in new capacity.
Given the structural pressures on oil demand, continued declines in real-estate construction and slower growth for coal-chemicals, China’s emissions could still fall this year. The emission trend remains a race between energy demand growth and clean-energy growth, both of which have slowed down this year.
Emissions still flat
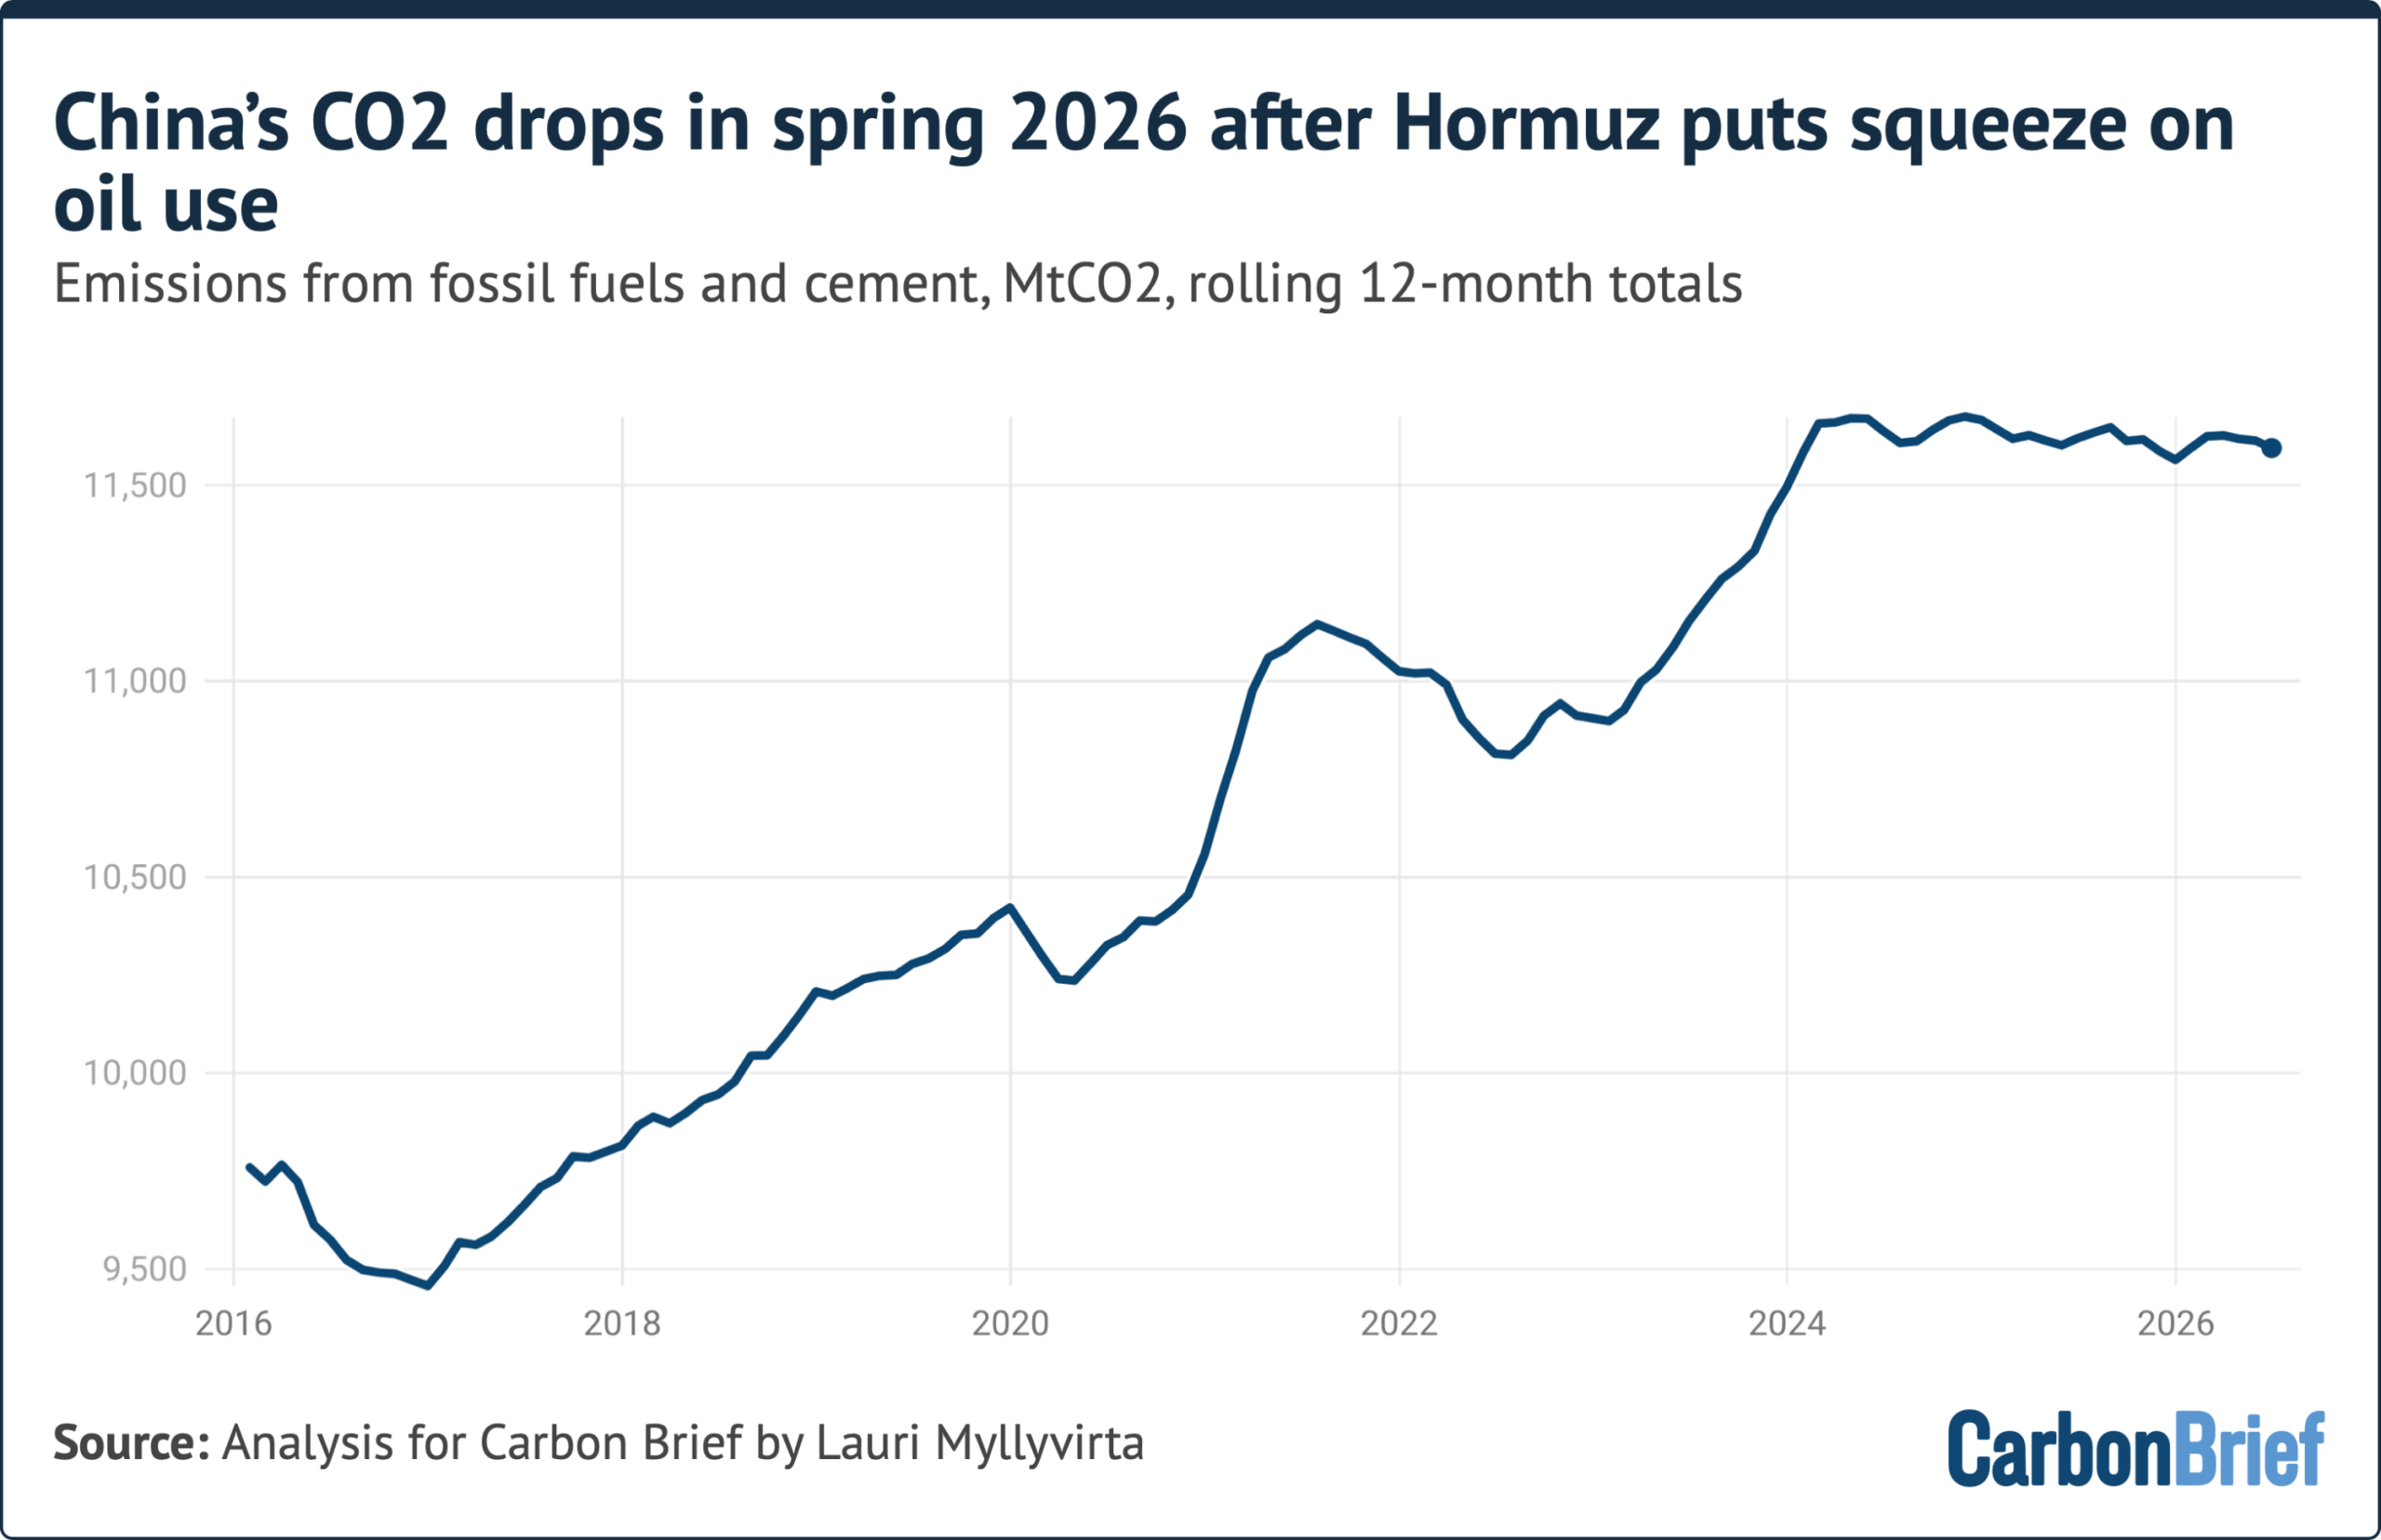
There has now been a plateau in China’s CO2 emissions from fossil fuels and cement for more than two years, following a peak in March 2024.
Previous analysis for Carbon Brief described this as a “flat or falling” trend, which extended until the end of 2025. There was then a 2% increase in emissions year-on-year in the first quarter of 2026, resulting from a rise in the amount of “wasted” wind and solar power.
The latest analysis shows that this was followed by another decline in the second quarter of this year, when China’s emissions fell by 1%, as shown in the figure below.
For further details see: About the data.
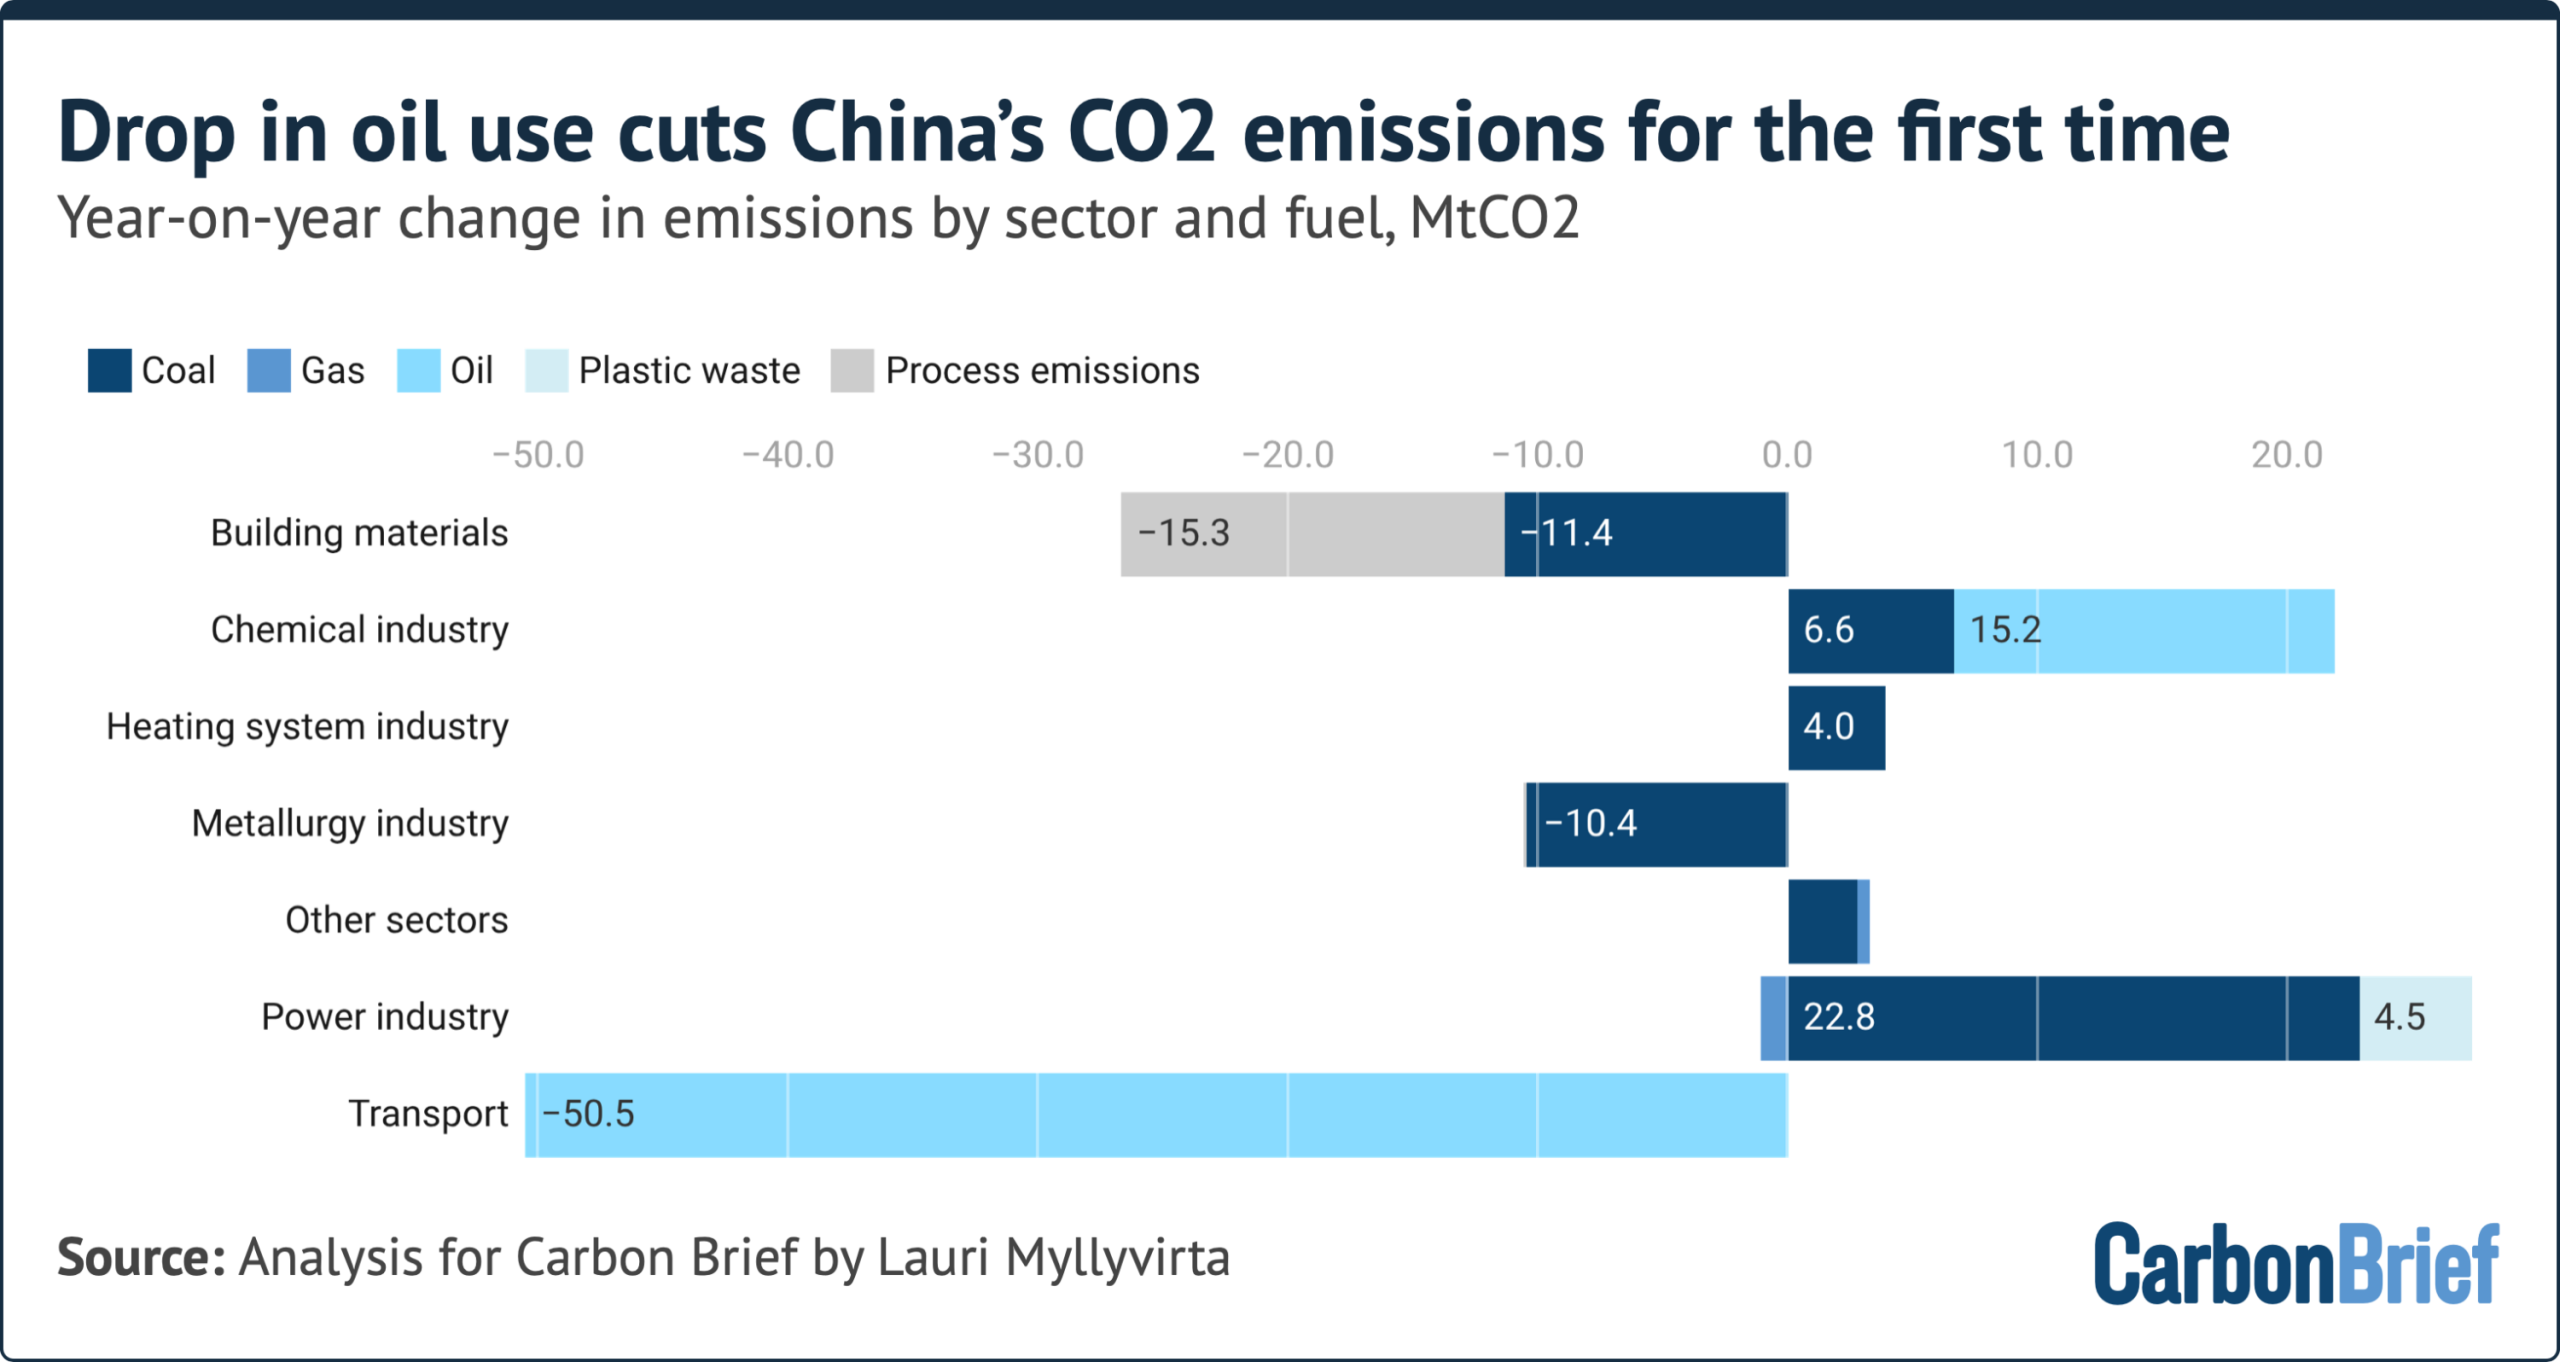
Notably, China’s emissions fell in the second quarter despite an increase in coal use. For the first time ever, a drop in oil use was sufficient to drive a decline in emissions overall.
Oil use plummeted while coal grew
Within the overall 1% decline in China’s emissions in the second quarter of 2026, there were divergent trends when looking sector by sector and fuel by fuel.
The largest fall in CO2 emissions came from the consumption of petrol, diesel and jet fuel, with oil consumption in industry also falling, as shown in the figure below.
For further details see: About the data.
Crude oil processing volumes fell 11% in the second quarter, but some of the fall was absorbed by drawing down oil product inventories, with Sinopec sales down 9%.
In total, China cut back oil imports by 32% in the second quarter. The million–barrel question has been how much of this was enabled by genuine reductions in oil consumption and how much by the drawdown of the country’s vast oil stockpile.
Energy mix numbers reported by the National Bureau of Statistics indicate that oil consumption fell by 3% in the first half of the year and around 9% in the second quarter. This shows that reduced consumption played a substantial role, while still leaving 60% of the fall in imports to be covered by the swing from building stockpiles to using them.
The sector with the largest increase in emissions during the second quarter of the year was power, where coal use grew 2.4% while gas-fired generation fell 1.2%. This was despite strong growth in wind and solar capacity over the preceding year, a significant rebound in hydropower generation, a small increase in nuclear power output and a slowdown in electricity consumption growth.
The explanation for the rise in emissions was – similar to the first quarter of 2026 – an increased amount of solar and wind generation being “wasted” due to the power market and grid not being adapted to increasing shares of variable renewable generation.
In other sectors, there was a fall in cement production, driven by falling construction volumes, which accelerated to 9% in the second quarter, from 8% in the first quarter. Crude steel output fell by 1% and pig-iron production by 3% in the second quarter.
Growth of coal use for chemical production slowed down in the second quarter, both compared with the previous quarter and the last year.
The rate of utilisation of installed coal processing capacity was already high before the current oil shock, so there was no headroom for production to increase even though rising oil prices made coal-chemicals more profitable. Oil-based chemical production also kept growing, with ethylene output up 17% and primary plastics production flat.
Coal use for heating continued to increase, with the sector’s coal consumption in the second quarter dominated by industrial heat, as there is little need for space heating at this time of year. Growth has continued despite the prominent drive for “zero-carbon industrial parks”, demonstrating the importance of the initiative for tackling industrial coal use.
What drove the fall in oil consumption?
The dramatic fall in China’s demand for oil imports during the Hormuz crisis has been widely hailed as the most important price stabilising factor for the global oil market.
To understand the implications for China’s oil consumption and CO2 emissions going forward, it is important to unpack what enabled this reduction in imports.
A significant contribution comes from ongoing, structural reductions in transport oil demand driven by electrification. Sinopec had forecast 6% and 5% drops in diesel and petrol consumption this year, respectively, already before the start of the war on Iran. Actual sales fell 9% in the first half of the year.
Transportation levels show a slowdown in growth, but no outright decline. Cross-regional passenger trips were 0.1% higher year-on-year in the second quarter, while urban passenger trips were 2.9% higher. Commercial freight tonnage increased 2.4%.
The exception is air travel, where passenger numbers fell 7% in May-June, after 7% growth in the first quarter. However, this sector plays a minor role in overall transport oil consumption in China.
The stable or growing transportation levels show that the shift to electric vehicles, rail, public transport and other clean transportation, rather than a fall in mobility, played the key role in reducing oil consumption.
The rise in fuel prices that accompanied the Hormuz crisis only accelerated the structural shifts in transportation that were already underway.
Electric heavy-truck sales rose about 77% in the second quarter, year-on-year, with June sales more than doubling and the market share of electric trucks exceeding 45% of all new sales.
The total number of EVs on the road at the end of the quarter grew 33% year-on-year. Some 12.1m EVs were added, of which 8.1m were electric-only battery EVs.
EV usage saw even more of a shift. Charging volumes increased 60% in the second quarter, indicating that EVs already on the road were utilised much more than before, at the expense of petrol and diesel vehicles, with plug-in hybrid drivers likely favouring electricity over fuel.
One factor enabling EV utilisation to grow was the increased use of electric taxis. Intense competition in the sector has pushed prices down at the same time as the use of private petrol vehicles has become more expensive.
Stronger subway and rail use also made a contribution. Rail-passenger traffic increased 5% in the first half of the year.
The fall in diesel demand has been particularly pronounced in the construction and mining sectors. The heavy machinery in the sectors is well-suited for electrification, in addition to which construction levels are also falling.
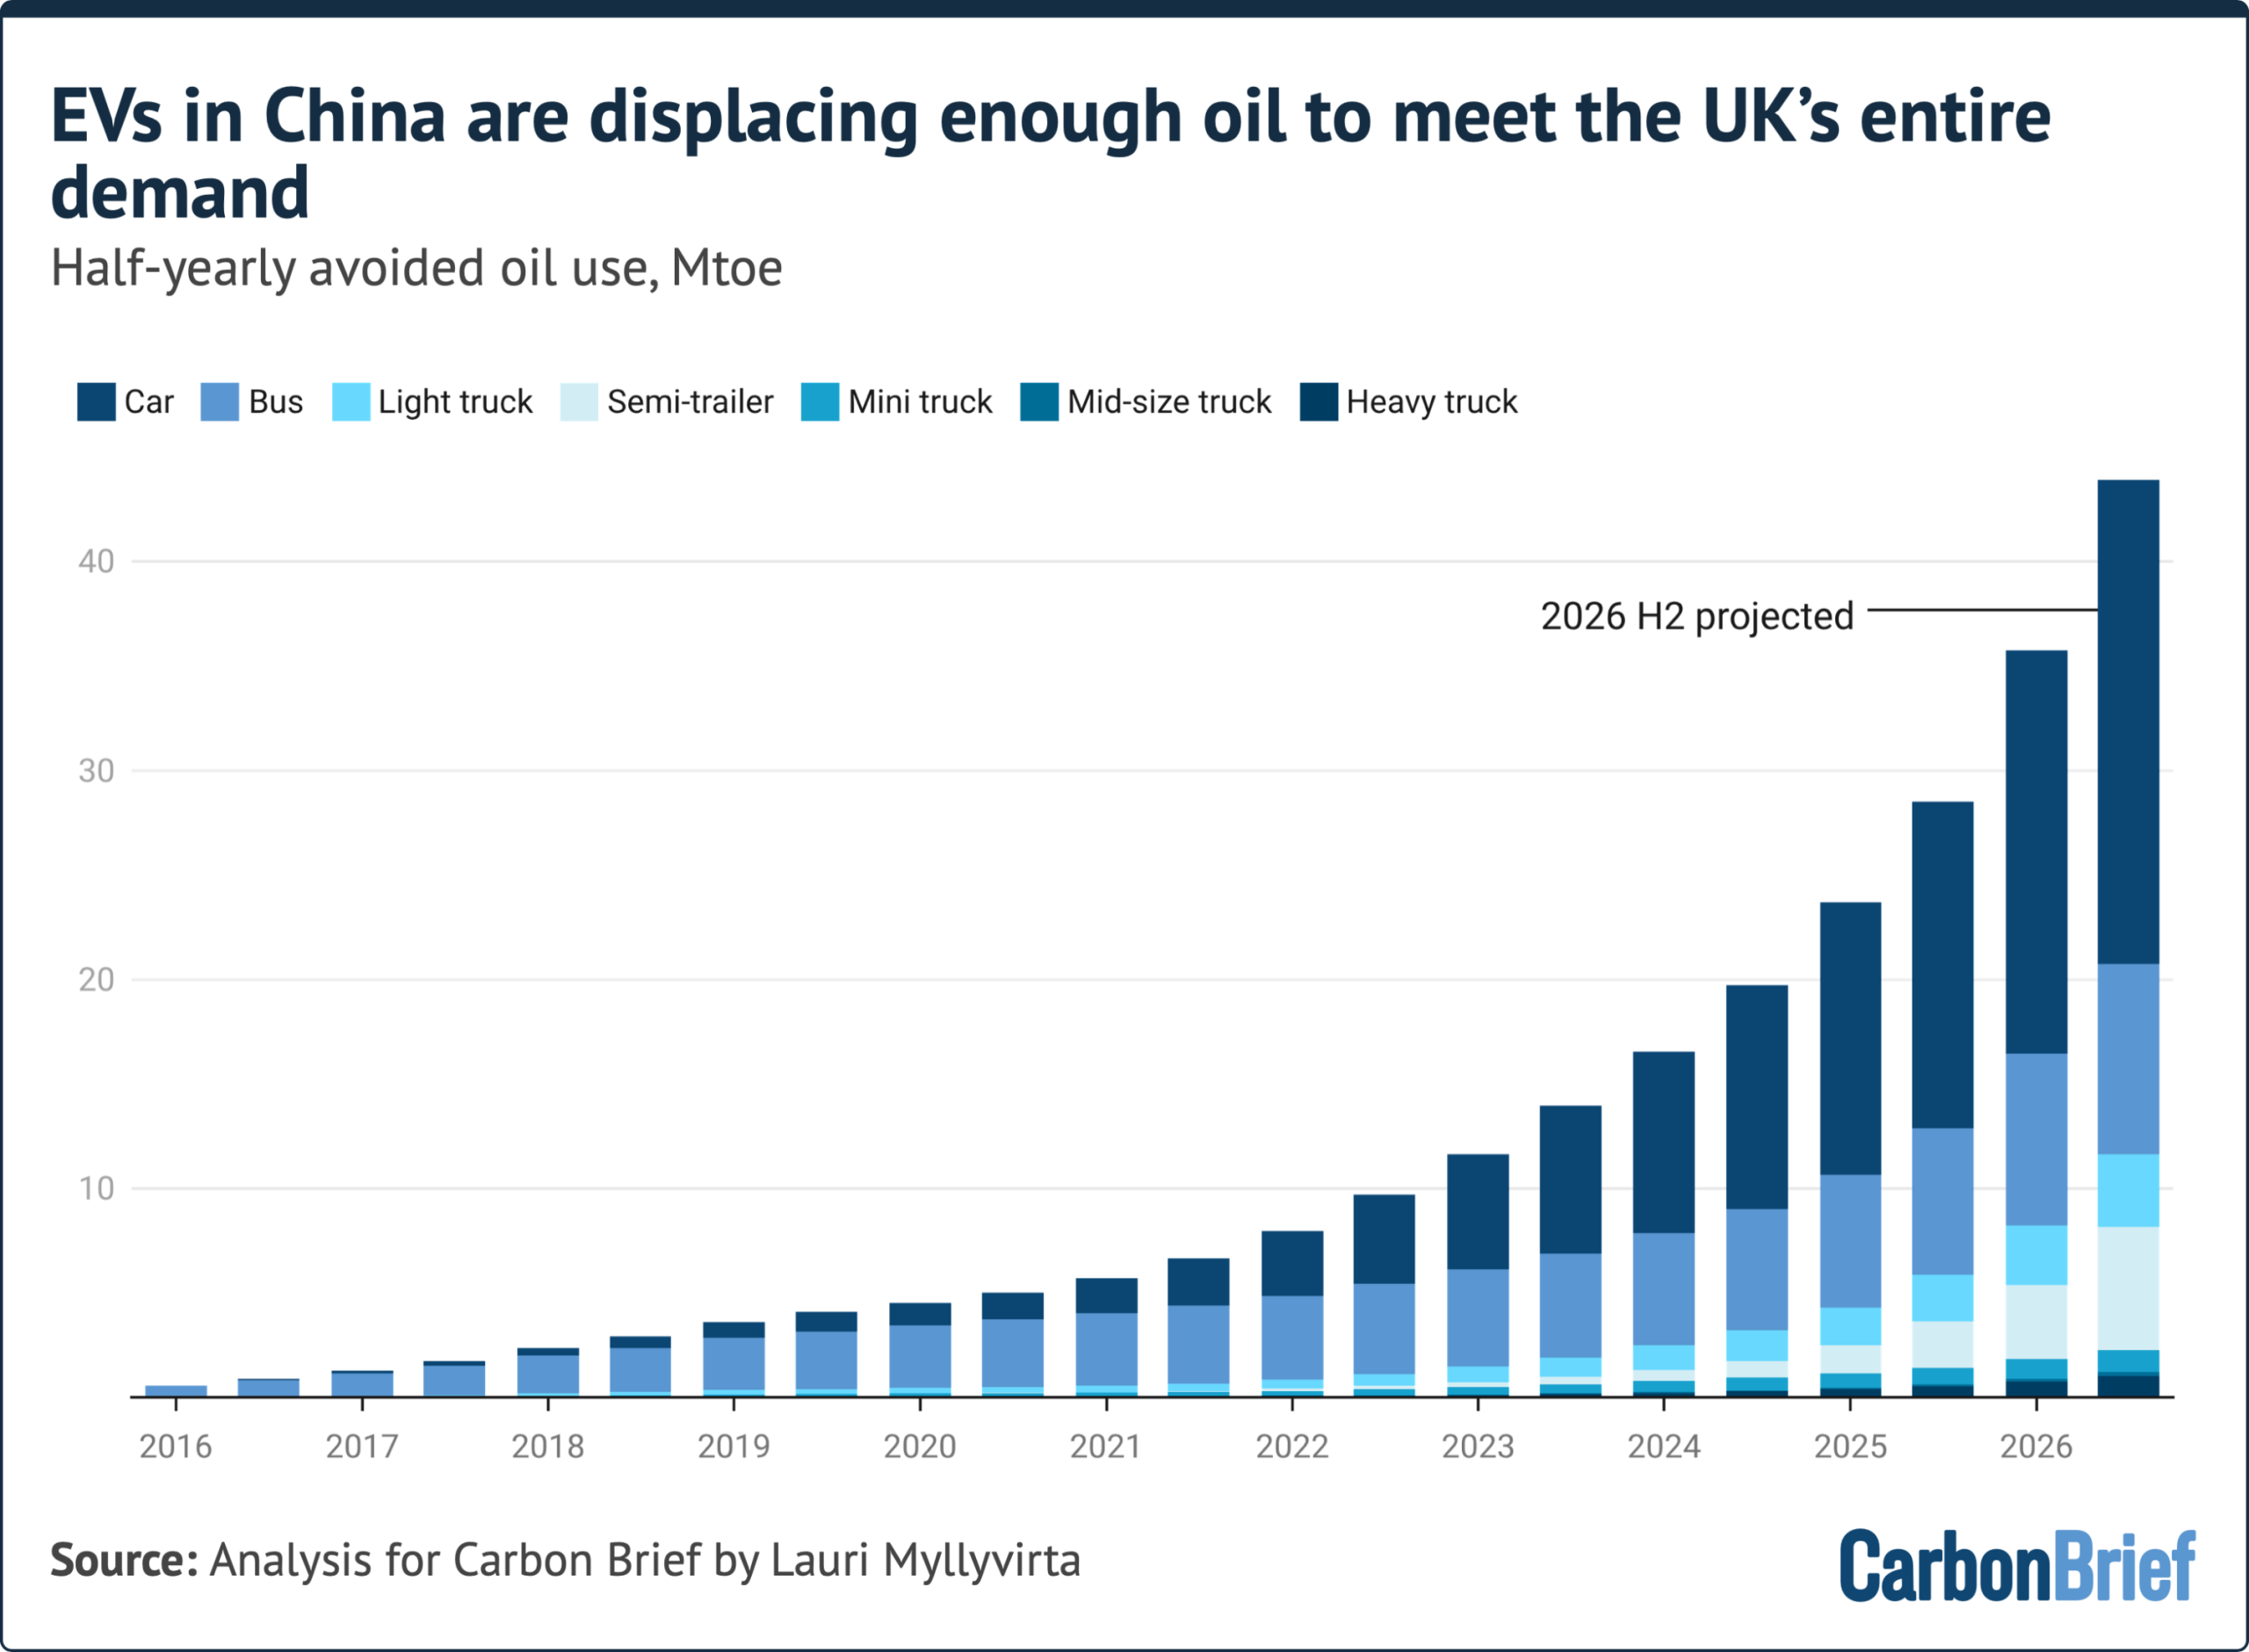
Based on reported growth in charging volumes, EVs helped avoid an estimated 19m tonnes of oil consumption (Mtoe) in the second quarter, up 50% year-on-year.
This took the total amount of oil displaced by EVs to 36 Mtoe in the first half of the year, as shown in the figure below, well exceeding, say, the total oil consumption of the UK over six months. Notably, trucks are the fastest-growing source of oil displacement, with avoided fuel use up 90% year-on-year in the first half of 2026.
For further details see: About the data.
The increase in avoided oil consumption due to EVs is equal to 4.5% of China’s oil imports in the same period in 2025. If EV sales and charging volumes continue their growth at the same rates in the second half of the year, avoided oil consumption will reach 80 mn tonnes, equal to the consumption of Mexico.
Estimated emissions avoided are 35 MtCO2, or 1.3% of China’s total CO2 emissions in the second quarter, after taking into account emissions from power generation for vehicle charging.
While the amount of oil displaced by the shift to EVs is significant – and is rising fast – the year-on-year increase in displaced oil still only accounts for a third of the drop in China’s oil consumption in the first half of the year, with the fall in consumption only accounting for half of the drop in imports. The remaining reduction is due to the shift from building to drawing down stockpiles, slower growth in chemical industry output, as well as behavioral adaptations by consumers and operational adaptations by businesses.
Coal power continued to rise despite clean-capacity growth
China saw record increases in solar and wind capacity over the past year. In addition, hydropower generation increased 9% in the second quarter of the year, compared with the same period in 2025, and there was a small 2% increase in nuclear-power output.
At the same time, the rate of power demand growth slowed down from 5.9% in the second quarter of 2025 to 5.2% in the same period in 2026.
Yet, power-sector emissions increased 3.0% in the first half of 2026, after falling 3.2% in the first half of 2025. Power generation from fossil fuels rose because of an increase in the amount of potential solar and wind generation that was wasted, as well as exceptionally poor wind conditions. Without those factors, coal-fired power generation and power-sector emissions would also have fallen in 2026.
Wind-power capacity has continued strong growth in 2026, with capacity additions in both the first and the second quarter of the year comfortably exceeding those in any year other than the record-setting 2025.
Solar power additions have slowed sharply from the rates seen in 2025, even falling behind 2024. Yet, they are in line with 2023, when more than 200 gigawatts (GW) was added by year-end.
Nuclear power development continues at pace, with eight new reactors approved in July and five reactors with 4.5GW total capacity expected to enter commercial operation this year. This includes China’s second commercial small modular reactor, Linglong One, with new policies paving the way for further development.
Reactor commissioning will pick up further next year: the government has approved 10 new reactor projects every year since 2022 and those projects will begin to come online. Meanwhile, 3GW of conventional hydropower was added, with a total of 6GW of projects targeting operation in 2026.
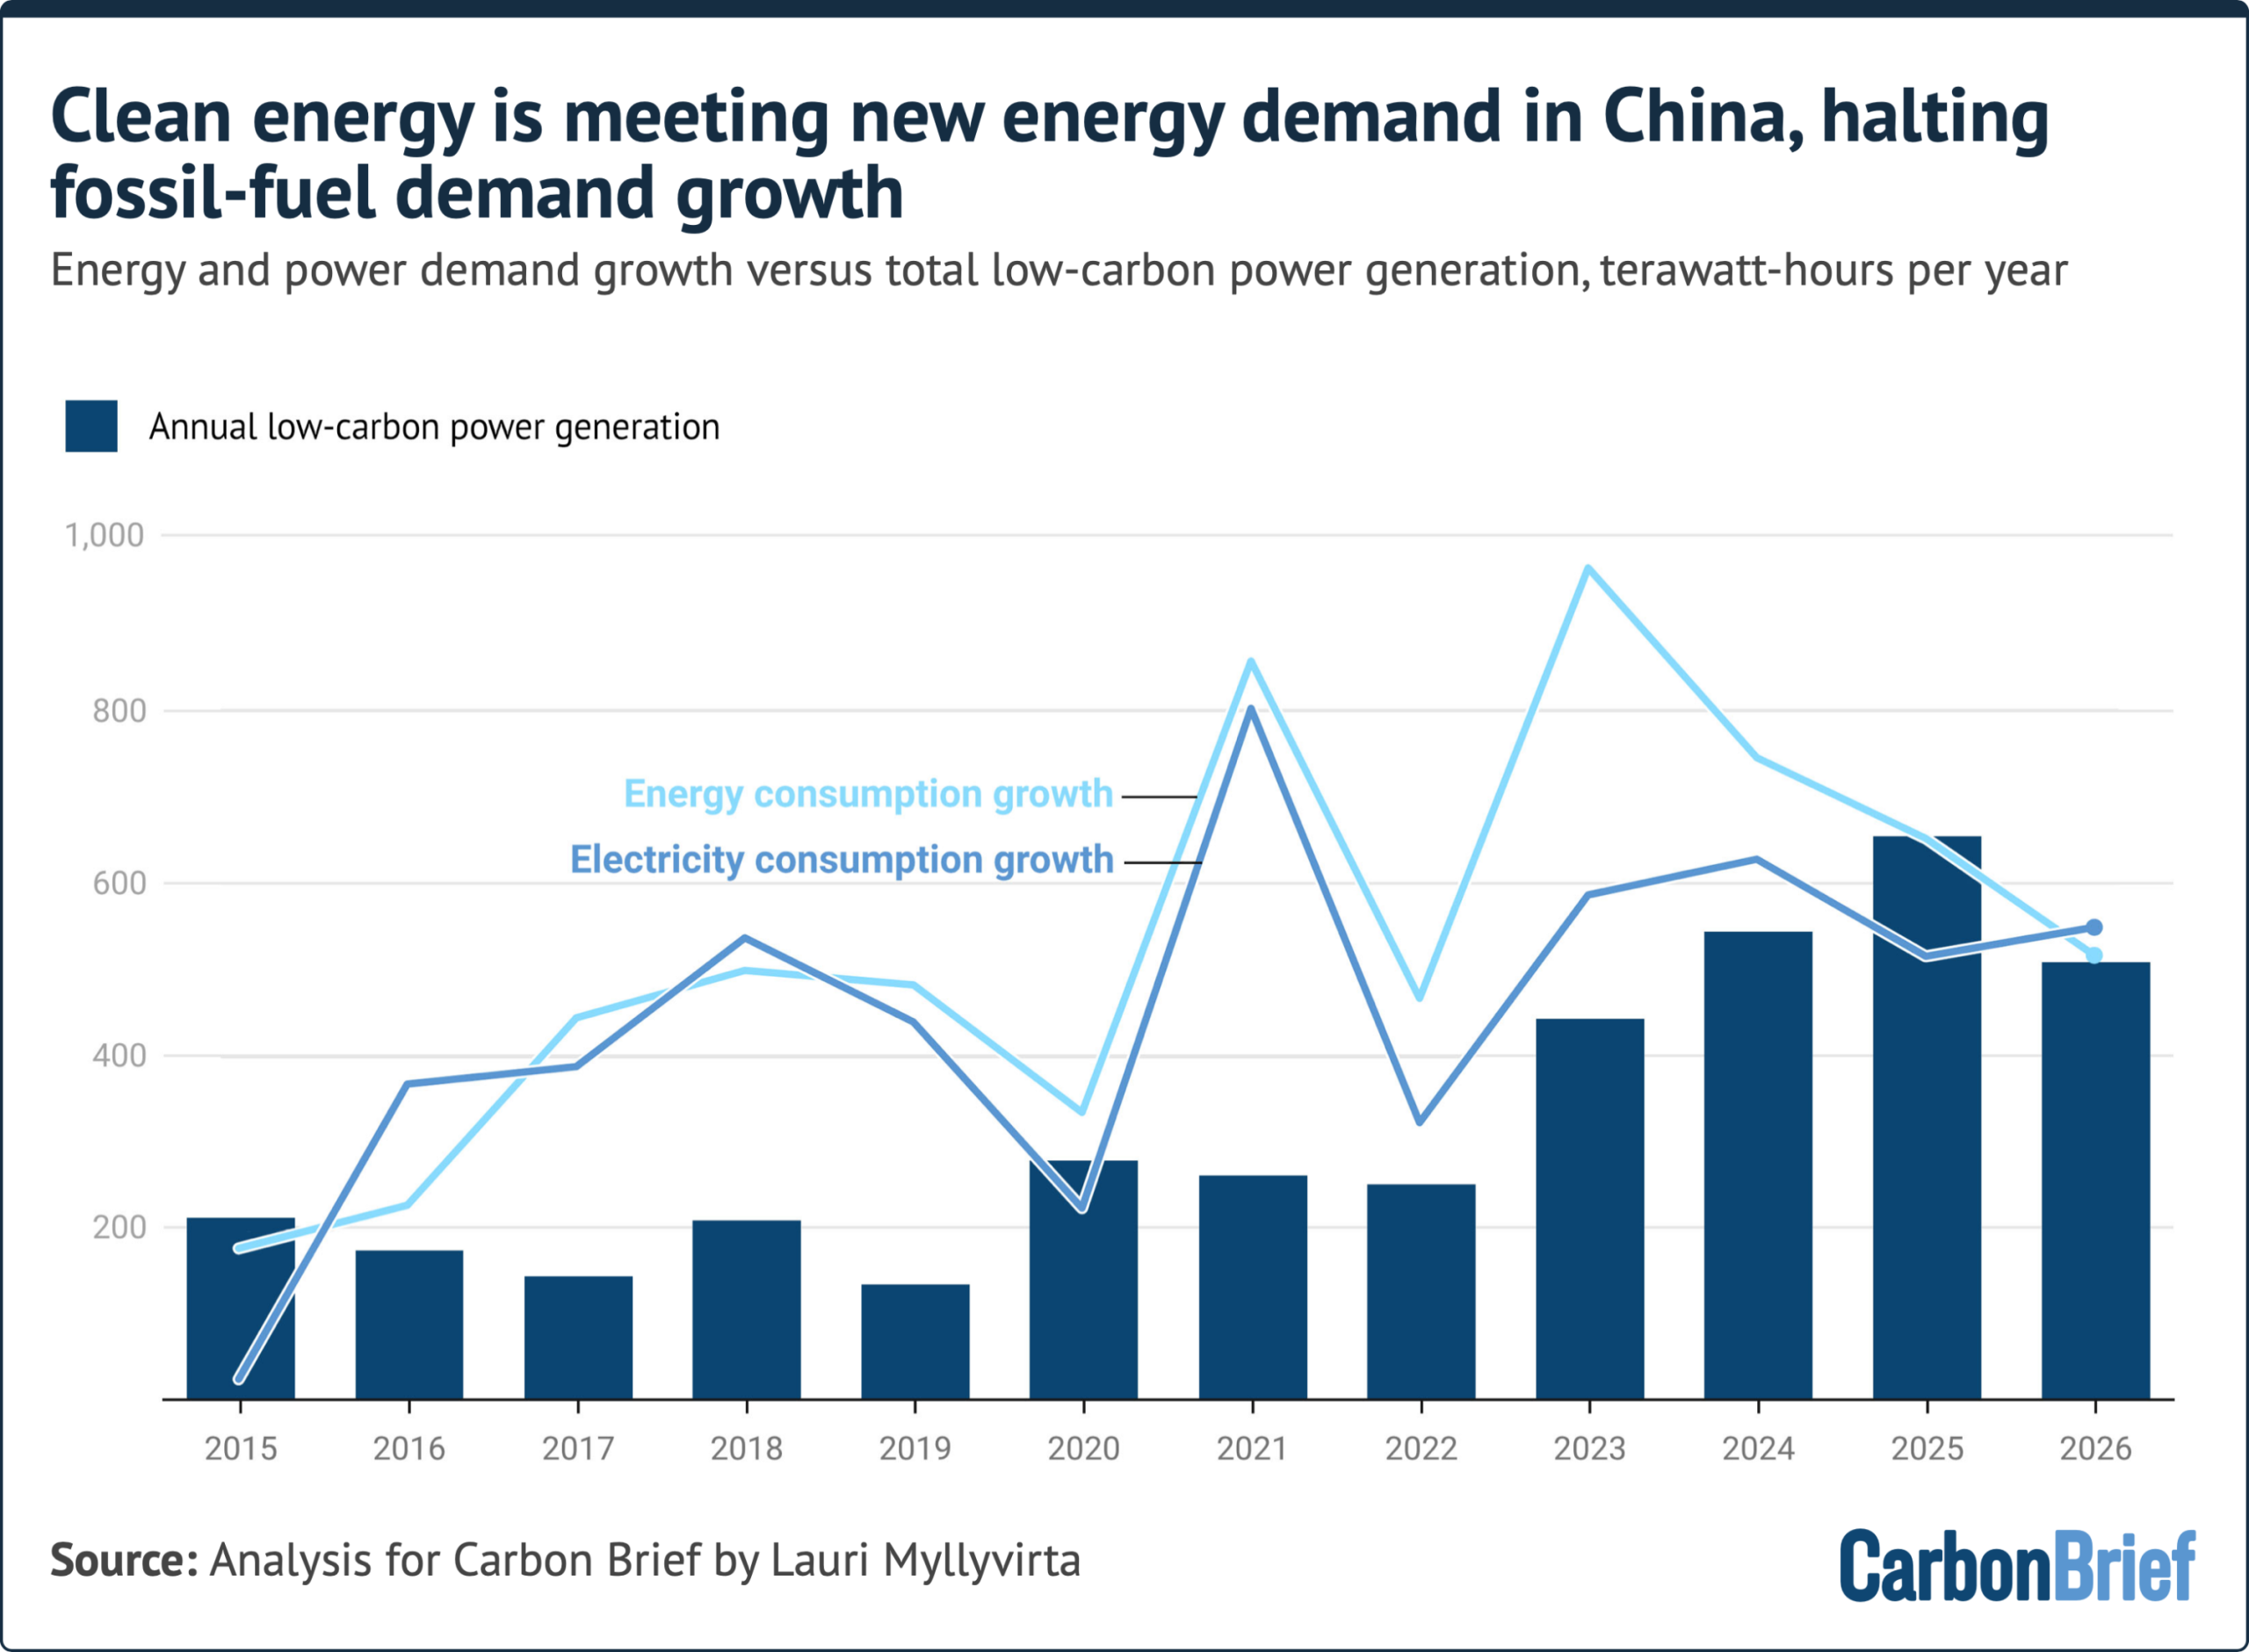
Taken together, this clean-energy growth puts China on track to add enough non-fossil generating capacity in 2026 to cover electricity demand growth of up to 5%, despite the slowdown in solar.
Power demand grew 5.3% in the first six months of 2026 and the energy regulator projects 5-6% for the whole year. This means that the increase in power-sector emissions seen in the first half would be reversed, once the obstacles to solar and wind sending their output to the grid are addressed – and once wind conditions revert to average levels.
Moreover, total energy demand growth has slowed down much more sharply than electricity demand, making it more feasible for clean-power generation growth to significantly exceed the increase in total energy consumption and to drive down fossil-fuel consumption.
For further details see: About the data.
The key reason for solar and wind curtailment in China is that neither the power-grid operating model nor the electricity market model require – or encourage – the flexible operation of coal-power plants, hydropower plants and inter-provincial transmission lines.
This situation has been exacerbated by a wave of new coal-power plants entering operation, with newly added capacity reaching 30GW in the first half of 2026, the highest level since 2016. Another 25GW started construction, while less than 3GW was retired.
The electricity prices paid to coal-fired generators are fixed months in advance, as are the volumes of electricity that will be transmitted through long-distance power lines.
This removes the incentive for plants to adjust their output in response to conditions. This could include variations in solar and wind supply, or changes in power demand.
As a result, there is limited ability for the grid to absorb variable renewable power. Furthermore, coal plants are entitled to “capacity payments”, which require them to be available to generate, but do not reward them for operating flexibly.
One solution to integrate more solar and wind into the grid is increasing energy storage capacity. Battery storage capacity continued to grow, with 17GW added in the first half of 2026, bringing total installed capacity to 153GW. This represents a slowdown in storage additions, however, down from 23GW in the first half of 2025.
Outlook for China’s CO2 emissions
The key developments affecting the outlook for China’s emissions in the second quarter include the effects of the Hormuz oil-and-gas crisis, the release of a long list of sectoral five-year plans and a slowdown in energy consumption growth.
The rise in oil prices has caused a stronger shift in China’s transportation sector than anyone anticipated, with EV deployment and use accelerating from an already high base. This trend is unlikely to be reversed. It has also proven the value of electrification to China’s energy security strategy.
The government is targeting a slight acceleration in the pace of electrification, aiming for electricity to make up 35% of energy end-use by 2030, up from 30% in 2025. This is a larger increase than achieved over the past five years, when the share of electricity rose from 26.5% in 2020 to 30% by 2025. The transportation sector plays a significant role in this, with a target for EVs to make up 30% of the vehicle fleet, up from 12% in 2025, and 25% of commercial vehicles.
Electrification both reduces emissions immediately and sets different sectors up for deep decarbonisation as electricity is much easier to produce without CO2 emissions than fuels. Faster transport sector electrification lowers the outlook for oil demand, increases the role of the sector in peaking and reducing emissions, plus means that more of China’s clean energy growth ends up displacing oil.
While transport emissions fell, power-sector emissions continued to rebound for the second quarter in a row. The increased coal-fired power generation and emissions can be attributed to increased solar and wind curtailment. Curtailment has emerged as the key obstacle to both continued rapid solar and wind capacity growth and full utilisation of existing capacity.
Several sectoral five-year plans published in recent months have laid out measures to improve solar and wind utilisation.
Long-distance transmission will continue to expand, helping to move wind and solar generation from remote “energy bases” to centres of demand. There is also a growing emphasis on local consumption of clean power. The power sector five-year plan, published in August, promotes direct purchases of clean electricity, smart microgrids, zero-carbon industrial parks and closer coordination between renewable resources and AI computing infrastructure
Yet the same plan further loosened the limits on the amount of wind and solar that can be curtailed.
The limit for curtailment was 5%, until it was relaxed to 10% in 2024 in provinces with good wind and solar resources. The new plan allows the limit to be increased further to 15% for some provinces, while keeping it at 5% and 10% for others.
Looking at the 2025 data on reported curtailment, very few provinces had higher rates than 15% – only Tibet for wind and Qinghai and Tibet for solar.
Unless the most lenient limit is only applied to those two provinces, it means the plan would allow for higher levels of curtailment.
This is also true of the national average target of “around” 10% curtailment, given reported rates in 2025 were 94% and 95% for wind and solar, respectively.
Notably, monthly data on curtailment has not been published in recent months, raising the possibility that the indicator is being revised. Reported data has understated actual curtailment by a wide margin, compared to implied curtailment.
If the curtailment indicator is revised, such that it captures more of the actual curtailment, then this could make the headline targets stronger than they appear, in comparison to previously reported numbers.
The new five-year plans also lowered the overall level of ambition on coal use. Chinese president Xi Jinping announced in 2021 that China would “gradually reduce coal consumption during the 15th five-year period”, covering 2026-30. However, the target now is for coal consumption to “enter a plateau” during those five years.
The five-year plans call for “reasonably controlling coal-power capacity and generation”, signaling a higher bar for the approval for new coal-power projects, after the government’s active promotion of new coal power in recent years. This could also imply more retirements of older coal plants. However, there is 204GW of coal-power capacity under construction, even after the wave of new coal-power plants starting operation in 2025 and in the first half of 2026, making the implementation of the “reasonable control” more challenging.
It is the first time that the government has vowed to control “coal-power generation” and not just “generation growth”, as the energy regulator did in 2021, but the significance of that distinction is unclear.
The renewable energy five-year plan also broadens the concept of system reliability, which was a key justification for new coal power during the previous five years. Rather than relying primarily on coal-fired power for system stability, it increasingly looks to other options.
Alternatives include storage, flexible demand, EVs, “virtual power plants” and smarter system operation to provide balancing services. The plan also puts an emphasis on increasing the contribution of renewable energy to meeting demand peaks.
Therefore, while coal remains an important backup resource in the plan, reliability is no longer framed as something that can only be provided by coal.
The Chinese government has published numerous other sectoral five-year plans since its overarching plan came out in March. These include plans for the energy sector (“new-type energy system”), power system, renewable energy, carbon peaking, coal, climate-change mitigation, and the environment (“Beautiful China”). Some clear priorities emerge from these plans: electrification, electric vehicles, energy storage, offshore wind and “green”” fuels.
The energy plan also substantially increased ambition on the development of conventional hydropower, despite ecological and social risks and potential for tensions with neighbouring countries. The capacity additions will largely only materialise after 2030, however.
At the same time, energy consumption growth has slowed down markedly after the surge during and immediately after the “zero-Covid” period, making it more feasible for clean energy to meet all incremental demand.
If this trend continues, then total CO2 emissions will begin to fall even as power-sector emissions continue to plateau.
About the data
Data for the analysis was compiled from the National Bureau of Statistics of China, National Energy Administration of China, China Electricity Council and China Customs official data releases, as well as from industry data provider WIND Information and from Sinopec, China’s largest oil refiner.
Electricity generation from wind and solar, along with thermal power breakdown by fuel, was calculated by multiplying power generating capacity at the end of each month by monthly utilisation, using data reported by China Electricity Council through Wind Financial Terminal.
Total generation from thermal power and generation from hydropower and nuclear power were taken from National Bureau of Statistics monthly releases.
Total primary energy consumption is converted to the electricity equivalent using the substitution method.
Monthly utilisation data was not available for biomass, so the annual average of 52% for 2023 was applied. Power-sector coal consumption was estimated based on power generation from coal and the average heat rate of coal-fired power plants during each month, to avoid the issue with official coal consumption numbers affecting recent data.
CO2 emissions estimates are based on National Bureau of Statistics default calorific values of fuels and emissions factors from China’s latest national greenhouse gas emissions inventory, for the year 2021. The CO2 emissions factor for cement is based on annual estimates up to 2024.
For oil, total oil consumption is calculated based on energy mix data for the first quarter and first half of the year released by the National Bureau of Statistics. Consumption of transport fuels – diesel, petrol and jet fuel – is estimated based on the sales growth reported by Sinopec for the first quarter and the first half of the year, with monthly disaggregation based on production minus net exports. The consumption of these three fuels is labeled as oil product consumption in transportation, as it is the dominant sector for their use. Apparent consumption of other oil products is calculated as the residual.
Estimated non-energy use of fossil fuels is subtracted from total chemical industry fossil fuel consumption, and process emissions are calculated based on fossil fuel consumption with carbon retained in products subtracted. Emissions from the incineration of plastics are based on a peer-reviewed estimate of plastics incineration in 2022, combined with growth rates in the overall power generation from waste-to-energy plants. Metals industry process emissions are calculated using industrial output data and IPCC default emission factors.
Oil consumption displaced by EVs is estimated using China Association of Automobile Manufacturers’ sales data, via Wind Financial Terminal. The data breaks down vehicle sales by type and powertrain: passenger cars, buses, vans, semis and trucks of different sizes, each split into battery-electric and plug-in hybrid, with assumptions about how far each vehicle type is driven per year and the fuel economy of the conventional vehicle it replaces.
Annual mileage and fuel-consumption assumptions are compiled from different sources, including the International Council on Clean Transportation. Each electric vehicle sold is credited with avoiding the fuel a comparable internal-combustion vehicle would have burned; plug-in hybrids are credited only with the portion of driving done on electricity (a utility factor of 64%).
The electricity and oil figures are calibrated to figures from China’s National Energy Administration, which put new-energy-vehicle charging at 142.3 TWh in 2025 and reported 56.9% year-on-year growth in the first half of 2026. The second half of 2026 is a projection: each vehicle segment’s actual second-half-2025 displacement is grown by its first-half-2026 year-on-year rate.
related
Q&A: What does China’s 15th five-year plan for coal mean for climate action?
Analysis: China’s CO2 climbs 2% in early 2026 due to ‘wasted’ wind and solar
Analysis: China’s new carbon metric leaves Germany-sized gap in its emissions
New coal plants hit ‘10-year’ global high in 2025 – but power output still fell
The post Analysis: China’s CO2 emissions fall in Q2 2026 due to plummeting oil use appeared first on Carbon Brief.
Analysis: China’s CO2 emissions fall in Q2 2026 due to plummeting oil use
After last week’s catastrophic flash flooding caused hundreds of deaths and an estimated $5 billion of destruction in Nepal, some board members of the UN’s new loss and damage fund board have called for an extraordinary meeting to allocate money to help the Himalayan country.
Following a direct appeal for funding from Nepal’s government on Monday, developing-country board members gathered online and eight signed a letter, seen by Climate Home News, asking the fund’s board to hold a meeting to respond to the request.
The letter, signed by eight African, Asian and Least Developed Country board members, said the debris-laden torrent – which scientists believe was unleashed by a glacial slope collapsing after unusually hot weather – constitutes “precisely the kind of climate-related extreme weather events the fund was established to address”.
“The scale of loss of life, displacement, and destruction of energy, transport, and economic infrastructure warrants the board’s urgent consideration of how the fund’s existing instruments should be mobilised to support Nepal’s government and affected communities,” the letter said.
-
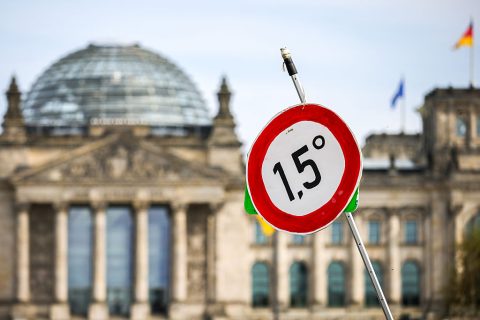
UN sets out narrow path back to 1.5C warming after inevitable overshoot
Leading scientists say warming must peak at 1.8C to be able to reverse course this century, but current government climate policies are way off track -
Keeping to 1.5C of warming is no longer possible – but we must still limit the overshoot
We need a strategy for navigating the huge risks to ecosystems and societies

The rules of the fund’s initial phase, which it is now in, allow for it to support “rapid response”, the letter noted. The fund’s governing instrument says it can provide funds “complementary to humanitarian actions taken immediately after an extreme weather event” as well as funds for “immediate or long-term, reconstruction or rehabilitation”, the letter added.
Governments agreed at UN climate talks to set up the fund in 2022 and it launched its first call for proposals at the end of last year. It received 180 submissions, mainly for long-term projects to help countries reduce the risks from climate threats, like improving water infrastructure in Jamaica or flood response in Bangladesh.
After delaying decisions at its last board meeting as it continued to work out processes, it has yet to approve any funding requests. Despite being set up on the back of the 2022 floods in Pakistan, the board has not yet given out any money in response to climate disasters nor expressed a clear willingness to do so.
The secretariat of the Fund for Responding to Loss and Damage (FRLD) had not responded to a request for comment at the time of publication. A few days ago, it expressed solidarity for those affected by the disaster in a social media post.
Rapid response precedent
The board members signing the letter on Nepal want to set a precedent, with the letter saying the board should consider “any procedural lessons” the response to the flooding “offer for strengthening the Fund’s rapid-response modalities and operational protocols for sudden-onset extreme weather events”.
Harjeet Singh, global convenor of the Fill the Fund campaign, told Climate Home News civil society has pushed “really hard” for the FRLD to be a rapid response fund rather than just inviting requests for project funding and reviewing them at regular board meetings as other UN climate funds do.
“Climate disasters like the one unfolding in Nepal cannot wait for scheduled committee cycles,” he said. “The Loss and Damage Fund was built for moments exactly like this.”

Nepal has received multi-million dollar humanitarian pledges from several governments already and the United Nations’ Central Emergency Response Fund is designed to rapidly disburse aid cash for disasters.
But Singh – also founding director of India’s Satat Sampada Climate Foundation – said that, with disasters becoming more frequent and severe, the humanitarian system cannot support all countries in their recovery efforts and the fund should bridge the gap.
“The Board Co-Chairs must heed the call of developing nations, convene an emergency session immediately, and prove that this Fund is ready to deliver real support when frontline communities need it most,” he told Climate Home News.
While the FRLD’s response to Nepal’s recent disaster could set an important precedent, it is only likely to be of limited practical help. The fund’s rules mean it can only give out a maximum of $20 million to each project in its current initial phase. With only $820 million pledged by rich countries and not all of that yet delivered, it has allocated a total of $350 million to spend so far and without further contributions could run of money next year.
Nepalese climate negotiator Manjeet Dhakal, who visited the affected area just days before the flood, told The Nation magazine that while $20 million “may only be a symbolic gesture”, it “could set an important precedent for how the fund responds when such disasters strike vulnerable countries in the future”.
The government’s preliminary estimate of the damage is $5 billion, with many homes and critical infrastructure destroyed, as well as over 1,000 people dead.
A letter to the FRLD board from Nepal’s finance and environment ministers said that Nepal had only contributed “negligibly to global greenhouse gas emissions yet continues to bear disproportionate and escalating climate impacts”.
Requesting the fund’s board take a special decision to allocate funding to Nepal, the ministers emphasised that “time is of the essence”. “A prompt response would help protect affected populations, restore essential services, prevent further suffering and demonstrate that the fund can translate international solidarity into timely support for vulnerable countries and communities when it is most urgently needed,” they wrote.
Glaciers ‘melt like butter’
Despite initial reports of an earthquake, the US Geological Survey has said the floods were caused by a glacier collapsing and the resulting landslide hitting the bottom of the valley causing “subsequent catastrophic impacts downstream”.
Alton Byers, a scientist at the University of Colorado Boulder’s Institute of Arctic and Alpine Research, told journalists this week that global warming has seen glaciers recede, glacial lakes forming and glacial lake outburst floods increasing.

He said that a heating glacier is like butter taken out of the refrigerator. “It becomes mushy. It no longer has the ability to hold together. What that means is that masses of rock and glaciers no longer are as resistant to gravity as they once were,” he explained. “Add to that melting water at altitude, which lubricates the interface between the rock and the glacier and you get an increased likelihood of slippage.”
He added that a trigger – like gravity or an earth tremor – can then set off the sudden release of masses of bedrock and glacial ice, “which is what happened last week”.
As well as reducing emissions to rein in climate change, Byers said that authorities can adapt to climate change by not building in flood plains. Many of the destroyed buildings in Nepal were located in places that have flooded before, he noted.
Flood deaths in West African cities raise fraught issue of slum evictions
The disaster took place on the Himalayan border of Nepal and Tibet, which is governed by China. Chinese state media are reporting at least 16 people dead and hundreds missing. China’s government has made no appeal to the loss and damage fund and the board’s letter does not mention China or Tibet.
The FRLD board’s co-chairs are now expected to respond to the letter, with any extraordinary board meeting likely to be held online, so that members from around the world can attend at short notice.
The post Loss and damage fund urged to hold crisis meeting on Nepal appeared first on Climate Home News.



-
Climate Change1 year ago
Guest post: Why China is still building new coal – and when it might stop
-
Greenhouse Gases1 year ago
Guest post: Why China is still building new coal – and when it might stop
-

 Greenhouse Gases2 years ago
嘉宾来稿:满足中国增长的用电需求 光伏加储能“比新建煤电更实惠”
-

 Climate Change2 years ago
嘉宾来稿:满足中国增长的用电需求 光伏加储能“比新建煤电更实惠”
-

 Renewable Energy10 months ago
Sending Progressive Philanthropist George Soros to Prison?
-
Climate Change2 years ago
Bill Discounting Climate Change in Florida’s Energy Policy Awaits DeSantis’ Approval
-
Greenhouse Gases1 year ago
嘉宾来稿:探究火山喷发如何影响气候预测
-

 Carbon Footprint2 years ago
US SEC’s Climate Disclosure Rules Spur Renewed Interest in Carbon Credits