

Antarctic sea ice has reached its maximum extent for the year, clocking in at the second lowest in a record stretching back to 1979, according to provisional data from the US National Snow and Ice Data Centre (NSIDC).
Over the past two years, Antarctic sea ice has been “way outside anything we have witnessed in our satellite record for their winter months”, an expert tells Carbon Brief.
Meanwhile, at the Earth’s other pole, the Arctic reached its summer minimum extent on 11 September, ranking as the seventh lowest on record, according to the NSIDC.
The organisation notes that “the last 18 years are the lowest 18 Arctic sea ice extents in the satellite record”.
The combination of below-average Arctic and Antarctic sea ice extents means that global sea ice extent has been at near-record lows over the past six months.
Antarctic maximum
For decades, scientists have been using satellite data to track the annual cycle of sea ice growth and melt at the world’s poles. This is a key way to monitor the “health” of sea ice in both the Arctic and Antarctic.
This year, Antarctic sea ice extent reached its annual maximum extent of 17.2m square kilometres (km2) on 19 September, according to the NSIDC. This is the second lowest in a satellite record stretching back 46 years, and 1.6m km2 smaller than the 1981-2010 average maximum, the NSIDC notes.
However, the NSIDC cautions that there is “some uncertainty in the estimate and date of the maximum because of an outage in the input source data” over 12-18 September.
Dr Zack Labe is a research physical scientist at NOAA’s Geophysical Fluid Dynamics Laboratory. He tells Carbon Brief that there is ongoing research in the polar community to understand whether Antarctic sea ice is undergoing a “regime shift”.
He adds that the past two years have been “way outside anything we have witnessed in our satellite record for their winter months” for Antarctic sea ice.
For example, Dr Ariaan Purich – from the school of Earth, atmosphere and environment at Monash University – explains to Carbon Brief:
“Our research suggests ocean warming has been important in pushing sea ice into this low-coverage state, and we also see preliminary indications of changed sea ice behaviour, suggesting that the underlying processes controlling Antarctic sea ice coverage may have altered.”
Global sea ice extent – a metric that combines Arctic and Antarctic sea ice extent – is currently tracking near the record low extent set last year.
The graphic below shows global sea ice extent over 1978-2024, where red indicates the 2024 extent and shades of blue indicate different years over 1978-2023 (darker colours indicate more recent years).
Labe tells Carbon Brief that global sea ice extent is an “unconventional metric”, but says it “really summarises the state of polar climate right now, which is that sea ice is unusually low all across the high latitude regions of our planet”.
Record-breaking Antarctic season
The Antarctic has seen a record-breaking year. In September 2023, Antarctic sea ice reached a new all-time low maximum extent, sparking widespread media attention. In the year that followed, sea ice extent has since continued to track near record lows.
On 20 February 2024, the Antarctic hit its annual minimum, tying with 2022 for the second-lowest minimum in the 46-year satellite record. Dr Mark Serreze, director of the NSIDC told Carbon Brief at the time that more warm ocean water was reaching the surface, melting ice and keeping more ice from forming.
He said that we “must wait and see” whether this is a “temporary effect” or if the Antarctic has entered a “new regime”.
Antarctic sea ice extent “expanded slowly” throughout March, and ended the month tied with several other years for third-lowest sea ice extent on record for the time of year, according to the NSIDC.
Throughout April, Antarctic sea ice extent continued to grow “relatively uniformly”. The continent saw temperatures of 3-5C above average in the west, while in the east, temperatures were 4-7C below average, the NSIDC adds.
Throughout May 2024, the rate of growth was slow relative to the 1981-2010 average, but “still much faster than last year”, the NSIDC says. And into June, Antarctic sea ice continued to track “well below all previous years except for 2023”, it adds.
The NSIDC finds that by the end of June, sea ice extent was more than 2m km2 below the 1981-2010 average, but still 500,000km2 above the exceptionally-low 2023 extent for the time of year.
By late July, Antarctic sea ice extent was “very close to the levels” seen in 2023. By the end of July, Antarctic sea ice was more than 2.1m km2 below the 1981-2010 average, and 190,000 km2 above 2023 levels, the NSIDC says.
The graphic below shows Antarctic sea ice extent between 1978 and 2024, where red indicates the 2024 extent and shades of blue indicate different years over 1978-2023 (darker colours indicate more recent years).
After slow growth from May to July, Antarctic sea ice began to “rapidly expand” in August, according to the NSIDC. It says “ice growth for the first two weeks of August was 1.5m km2 per day, among the fastest ice growth rates seen in the 46-year record for this time of year”.
However, growth “stalled” over 16-25 August and, by the end of the month, Antarctic sea ice extent stood at 16.86m km2 – the second lowest in the satellite record for that date ,the NSIDC says.
It notes that sea ice extent is “particularly low in the far eastern Weddell Sea, the south-west Indian Ocean and in the Amundsen Sea”.

Arctic minimum
At the other end of the world, Arctic sea ice extent has been melting towards its annual minimum for the past six months. It reached its minimum in September, and has now begun to grow again.
Back on 14 March, the Arctic hit its annual maximum, which was the 14th lowest in the satellite record. The NSIDC finds that despite favourable winds that encouraged sea ice formation, the maximum sea ice extent was 640,000km2 smaller than the 1981-2010 average maximum.
As temperatures warmed in the Arctic, sea ice continued to melt. By the start of April 2024, Arctic sea ice extent had dropped by about 278,000km2 below the March maximum, the NSIDC says.
April sea ice loss in the Arctic proceeded at a near-average rate overall, with most ice loss in the Bering Sea and Sea of Okhotsk, according to the NSIDC. The average Arctic sea ice extent for April 2024 was 14.12m km2, placing it 16th lowest in the satellite record.

The NSIDC says that although average global temperatures in April were at a record high, temperatures in the Arctic were “well below average” by up to 3-5C in some regions.
“This May, early ice loss in the eastern part of Hudson Bay was striking,” the NSIDC says. Usually, the Hudson Bay is “nearly completely ice covered through May”, it adds. However, this year saw unusually “strong and persistent” winds from the east push ice from the eastern coast into open water, resulting in record low sea ice extent in the Hudson Bay.

The NSIDC notes that by 1 June 2024, sea ice extent in the Hudson Bay was 205,000km2 below the 1981-2010 average – 65,000km2 below the previous record low set in 2015.
Arctic sea ice extent in June retreated more slowly than usual and, by the end of the month, it was “tracking above all years since 2012 except for 2013 and 2015”, it adds.
July is the warmest month in the Arctic and sees the most rapid sea ice loss, the NSIDC says. It finds that Arctic sea ice “retreated rapidly” in July. The region lost 113,000km2 of ice per day throughout the month – faster than the 1981-2010 average pace of 87,000km2 per day.
Ice loss during the month was greatest in the Kara and East Siberian Seas, Baffin Bay, Hudson Bay, and the Canadian Archipelago, the NSIDC says. Meanwhile, unusually for the time of year, a small patch of ice remained in the Hudson Bay by the end of the month. It adds that air temperatures were near average overall, with several areas slightly cooler than average.
By the end of July, Arctic sea ice extent was the third-lowest extent in the 46-year satellite record by the end of the month. Rapid Arctic ice loss continued into the first week of August, and by mid-August, sea ice extent was the fourth lowest on record, the NSIDC says.
The graphic below shows Arctic sea ice extent between 1978 and 2024, where red indicates the 2024 extent and shades of blue indicate different years over 1978-2023, where darker colours indicate more recent years.
Throughout August, ice loss slowed down in response to “waning sunlight and decreasing air temperatures”, as is typical for this time of year, the NSIDC says. By the end of August, Arctic sea ice extent was 4.55m km2 – the fourth lowest in the satellite record.
The map below shows Arctic sea ice average extent for September 2024, where the pink line shows the 1981-2010 average.

Arctic sea ice reached its annual minimum extent of 4.28m km2 on 11 September 2024, ranking as the seventh lowest in the 46-year satellite record.
The NSIDC adds that “the last 18 years are the lowest 18 Arctic sea ice extents in the satellite record”.
On thin ice
Labe tells Carbon Brief that Arctic sea ice this year has been “unusually thin”, explaining that the Arctic has seen “unusually low sea-ice concentration with the ice being more spread out and with more areas of open water found between the ice floes”.
This has resulted in near record-low total Arctic sea ice volume.
![Zack Labe on X/Twitter (@ZLabe): There was an accelerated loss of sea ice volume last month in the #Arctic. We are not far from a record low. Each line represents one year from 1979 [dark blue] to 2023 [dark red]. This year is shown in yellow - now updated through all of August 2024](https://breakingclimatechange.com/wp-content/uploads/2024/12/x.com_ZLabe_status_1833478263001518490-2-21.png)
Prof Alexandra Jahn is an associate professor at the University of Colorado’s Institute of Arctic and Alpine Research. She tells Carbon Brief that natural variability has contributed to the observed loss of ice – “especially during the early 21st century”.
However, she adds that internal variability alone cannot completely explain the extent of the loss we have seen, and human-caused greenhouse gas emissions “are required to get an Arctic sea ice loss as large as observed”.


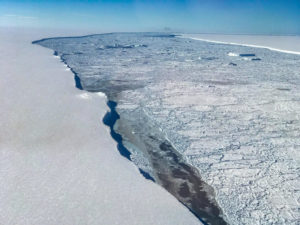

The post Antarctic sea ice maximum in 2024 is ‘second lowest’ on record appeared first on Carbon Brief.
Antarctic sea ice maximum in 2024 is ‘second lowest’ on record

Climate Change
“Sink or swim”: WA Gov hugely underestimating decline in regional gas demand while sleeping on green exports, new report finds
PERTH, Tuesday 13 October 2026 — A new report from Greenpeace Australia Pacific and Springmount Advisory reveals green commodity exports are an untapped economic opportunity for Western Australia in a declining Asian gas market, while offering a genuine solution for decarbonising Asia.
From Gas to Green: Building Western Australia’s Future State is a comprehensive analysis of the declining gas market in Asia, and the untapped economic opportunity for WA to become a global leader in green commodity exports while driving the regional shift away from fossil fuels.
The report offers key recommendations for the WA Government to support regional decarbonisation through an orderly phase out of gas exports in favour of green iron and other green exports. It comes as global climate leaders from across business, politics and advocacy prepare to meet for the Global Citizen Now: Perth event focused on decarbonising WA.
Key findings:
- Gas demand is falling across WA’s core markets in Asia: Gas demand fell in 2025 and is projected to continue to decline, driven by a combination of global geopolitical factors and domestic concerns.
- Policy shifts in key markets since the war on Iran now prioritise renewables and nuclear over gas: Japan, South Korea and China have legislated energy plans that prioritise renewables and nuclear over gas.
- New WA gas would arrive in a saturated, uncertain Asian market filled with cheaper gas: The US is now the world’s largest liquefied gas producer and plans to double its capacity as it also targets Asian markets.
- Green commodities offer a real solution to sustain WA’s economy: WA can lead Australia’s green commodity exports, which by 2060 could be worth almost a trillion dollars.
- Exporting more WA gas is likely to delay or impede Asia decarbonisation: Despite claims by the gas industry, there is no evidence that WA gas is displacing coal in Asia, and in fact diverts resources from genuine decarbonisation options.
Geoff Bice, WA Campaign Lead at Greenpeace Australia Pacific said: “As our export partners in Asia shift away from expensive and polluting gas, the WA Government has a golden opportunity to pivot our economy to green exports, like green iron, which is the most effective way to help our region to decarbonise.
“The writing is on the wall: gas is in decline, renewables are our future. In this context, it makes zero sense for the government to encourage high risk projects like Woodside’s reckless Browse gas proposal at Scott Reef.
“This report clearly shows that the WA Government faces a choice: sink or swim. They can either allow the gas industry to keep ripping off West Australians and continue propping up its decline, or choose the path that will deliver enormous benefits to the state and the world by becoming a leader in the rapidly expanding green economy.”
Tom Quinn, Managing Director of Springmount Advisory: “Western Australia prospers when it looks to the future and builds for future demand. Twenty years from now, what the world needs is green commodities made using WAs abundant renewable resources. Just like it did with iron ore in the 1950s and gas in the 1970s, WA should look to the future and build what the world will need, not sunsetting industries like gas that are already past their peak.”
-ENDS-
Media contact
Kate O’Callaghan on 0406 231 892 or kate.ocallaghan@greenpeace.org
Lucy Keller on 0491 135 308 or lucy.keller@greenpeace.org
A report from Greenpeace Australia Pacific and Springmount Advisory reveals the untapped green economic opportunity for Western Australia in a declining Asian gas market, which also offers a genuine solution for decarbonisation in Asia.
Is Western Australia clinging to a fading gas industry while a thriving green future passes it by? As major Asian trading partners rapidly pivot away from volatile gas imports toward cheap solar and battery storage, this report exposes a high-stakes choice: risk becoming stranded in an oversupplied fossil fuel market, or harness WA’s unmatched sun and wind to lead the global clean energy transition.
Summary
From Gas to Green: Building Western Australia’s Future State reveals that Western Australia (WA) faces a critical juncture as falling Asian gas demand, geopolitical gas supply volatility and accelerating renewable energy deployment undermine the long-term economic viability of gas exports. By harnessing its world-class wind and solar resources, the report demonstrates that WA can execute an orderly phase-out of gas and pioneer a green commodity export economy that could generate $987 billion in economic value by 2060, create 24,000 ongoing jobs, and drive a 9.6% reduction in global greenhouse gas emissions.
Key Findings
- Gas demand is falling in Asia – WA can no longer rely on gas exports: Gas demand in core Asian markets fell in 2025 and is projected to continue to decline in 2026. Legislated energy plans in Japan, South Korea, and China now prioritise renewables and nuclear over gas.
- Asia is increasing renewables, importing gas just gets in the way: Evidence from markets like Thailand suggests that gas imports are increasingly crowding out cheaper renewable energy investments and battery storage rather than displacing coal, locking in more emissions over time.
- Green commodities offer a real solution to decarbonise Asia – this is a major win for WA: With world-class renewables, WA can lead Australia’s green commodity exports, which by 2060 could be worth almost a trillion dollars ($987 billion) and support a genuine 9.6% reduction in global emissions.
Recommendations to WA government
Recommendation 1: Plan an orderly gas phase-out aligned with a trading partner pivot plan
Implement a managed, orderly phase-out of gas exports aligned with trading partners’ decarbonisation pathways, rather than waiting for demand to collapse, by:
- Developing and implementing a staged phase-out of gas facilities aligned with feedstock supply expiry or typical end of facility lifespans.
- Committing to no new gas development for gas expansion, including Browse and Kimberley fields.
- Developing new, reciprocal trade relationships with existing gas trade partners, structured to progressively replace gas exports with green commodities – integrated with recommendation 2.
Recommendation 2: Develop an integrated green commodity export strategy, positioning WA as a global green iron manufacturing hub
Establish an integrated green commodity export strategy that immediately prioritises green iron development, positioning WA as a global green iron manufacturing hub, by:
- Committing to green commodity export targets to give industry and investors a clear demand signal.
- Prioritising green iron as the lead sector within the broader green commodity strategy, given WA’s iron ore endowment and first-mover potential.
Recommendation 3: Reject false solutions such as carbon dumping (CCS) and blue hydrogen
Reject carbon dumping (also described as carbon capture and storage, or CCS) and blue hydrogen as viable decarbonisation technologies, and prioritise green hydrogen and proven renewables for clean energy and fuel production by:
- Excluding blue hydrogen projects (and CCS-dependent projects) from all government support programs.
- Requiring existing hydrogen-based production (including ammonia, methanol, synthetic fuels) to have clear, near-term transition timelines to switch to green hydrogen production.

What you can do
Together, we can push for a prosperous green future.
You can help by:
- Sending an email to Environment Minister Murray Watt and Prime Minister Anthony Albanese, calling on them to reject Browse.
- Sharing this story to help more Australians understand what’s at stake.
- Encouraging your friends and family to take action.
REPORT: “From Gas to Green” Building Western Australia’s Future State