

The year 2025 was in the top-three warmest years on record, with average surface temperatures reaching around 1.44C above pre-industrial levels across eight independent datasets.
The different temperature records confirm that last year was either the second or third warmest since observations began in the mid-1800s, with razor-thin margins between 2025 and 2023.
Last year also set a new record for ocean heat content, with the oceans absorbing more than 90% of the heat trapped by increasing greenhouse gas concentrations in the atmosphere.
Here, Carbon Brief examines the latest data across the Earth’s oceans, atmosphere, cryosphere and surface temperature. (Use the links below to navigate between sections.)
Noteworthy findings from this 2025 review include…
- Ocean heat content: It was the warmest year on record for ocean heat content and one of the largest year-over-year increases in ocean heat content. In 2025, the oceans added 35 times more heat than all annual human energy use.
- Global surface temperatures: The year 2025 is effectively tied with 2023 as the second-warmest year on record – coming in at between 1.33C and 1.53C above pre-industrial levels across different temperature datasets and 1.44C in the synthesis of all groups.
- Second warmest over land: Global temperatures over the world’s land regions – where humans live and primarily experience climate impacts – were 2C above pre-industrial levels, just below the record set in 2024.
- Third warmest over oceans: Global sea surface temperatures were 1C above pre-industrial levels, dropping from 2024 record levels due to fading El Niño conditions.
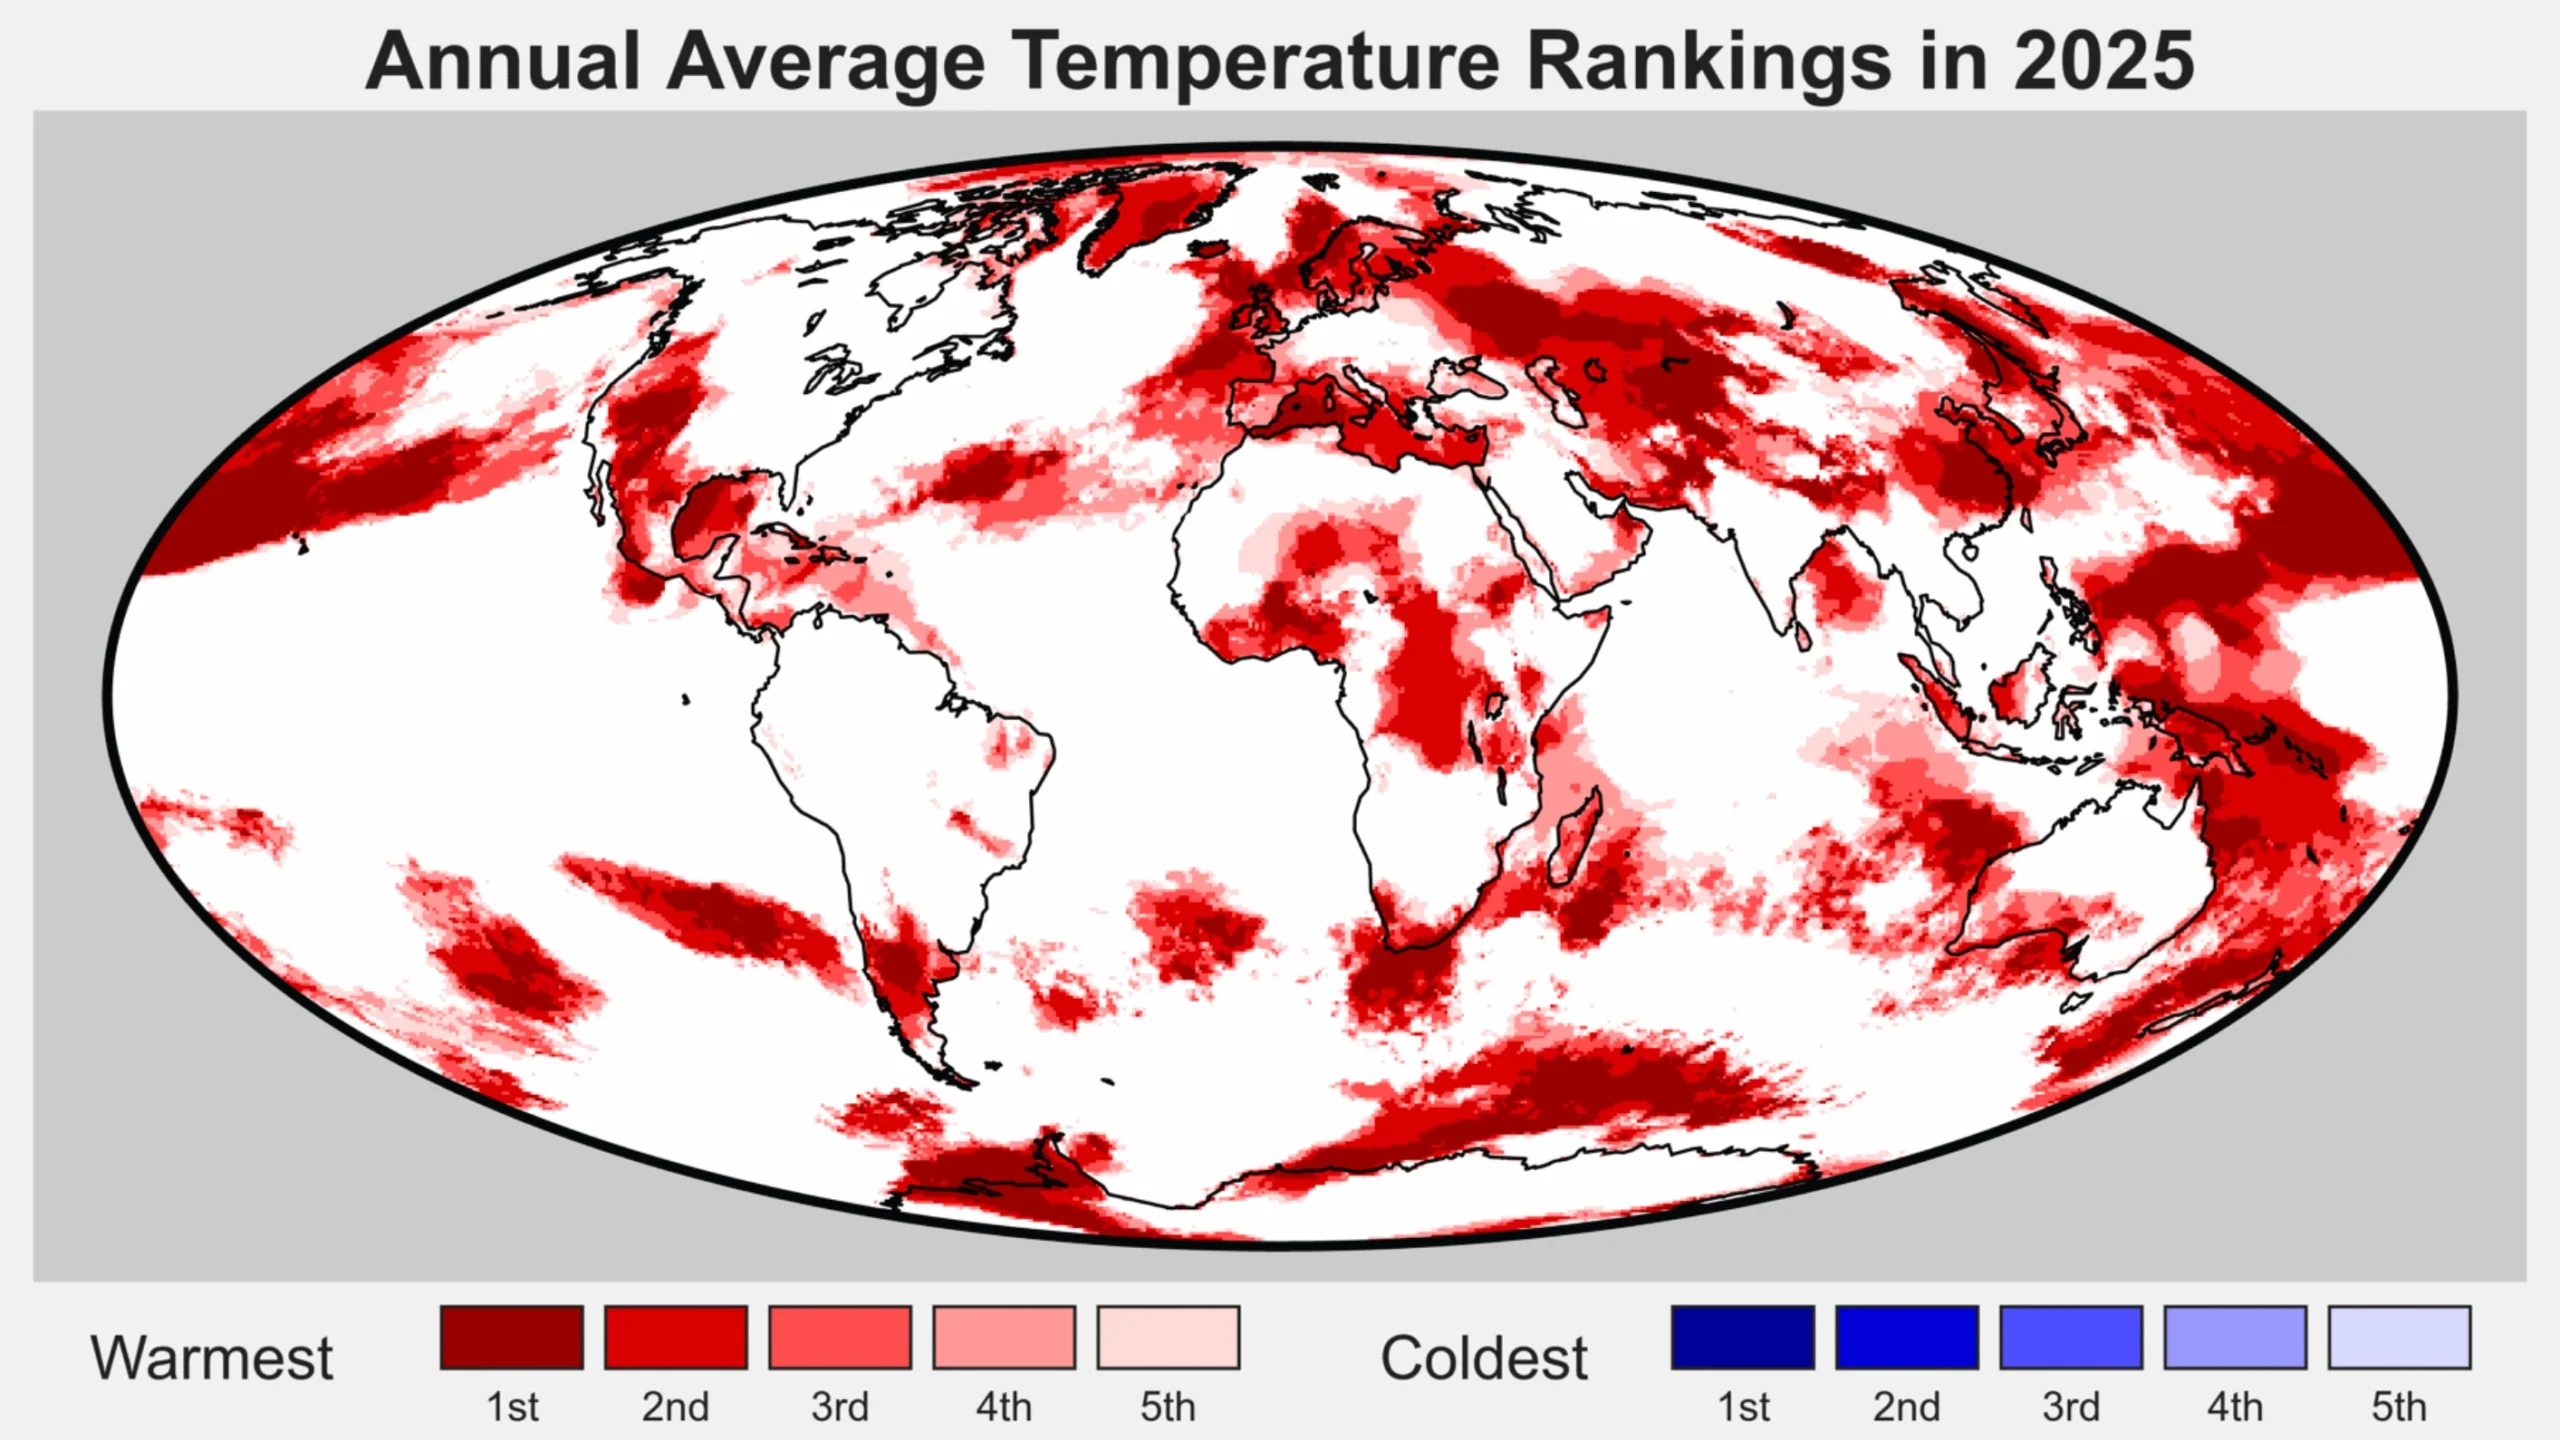
- Regional warming: It was the warmest year on record in areas where, collectively, more than 9% of the global population lives.
- Unusual warmth: The exceptionally warm, record-setting temperatures over the past three years (2023-25) were driven by continued increases in human emissions of greenhouse gases, reductions in planet-cooling sulphur dioxide aerosols, variability related to a strong El Niño event and a strong peak in the 11-year solar cycle.
- Comparison with climate models: Observations for 2025 were nearly identical to the central estimate of climate model projections in the Intergovernmental Panel on Climate Change (IPCC) sixth assessment report (AR6).
- Heating of the atmosphere: It was the second warmest year in the lower troposphere – the lowest part of the atmosphere.
- Sea level rise: Sea levels reached record highs, continuing a notable acceleration over the past three decades.
- Shrinking glaciers and ice sheets: Cumulative ice loss from the world’s glaciers and from the Greenland ice sheet reached a new record high in 2025, contributing to sea level rise.
- Greenhouse gases: Concentrations reached record levels for carbon dioxide (CO2), methane and nitrous oxide.
- Sea ice extent: Arctic sea ice saw its lowest winter peak on record as well as its 10th-lowest summer minimum extent, while Antarctic sea ice saw its third-lowest minimum extent.
- Looking ahead to 2026: Carbon Brief predicts that global average surface temperatures in 2026 are likely to be between the second and fourth warmest on record, similar to 2023 and 2025, at around 1.4C above pre-industrial levels.
Ocean heat content sets a new record
The year 2025 was the warmest on record for the heat content of the world’s oceans.
Ocean heat content (OHC) increased by around 500 zettajoules – billion trillion joules – since the 1940s.
The heat increase in 2025 alone compared to 2024 – about 23 zettajoules – is around 39 times as much as the total energy produced by all human activities on Earth in 2023 (the latest year in which global primary energy statistics are available). It was also the largest increase in ocean heat content since 2017 (following the strong El Niño event of 2016).
Human-emitted greenhouse gases trap extra heat in the atmosphere. While some of this warms the Earth’s surface, the vast majority – around of 93% – goes into the oceans. About two-thirds of this accumulates in the top 700 metres, but some also ends up in the deep oceans.
The figure below shows annual OHC estimates from the Chinese Institute for Atmospheric Physics (IAP) between 1950 and present for the upper 700 metres (light blue shading) and 700-2,000 metres (dark blue) of the ocean.
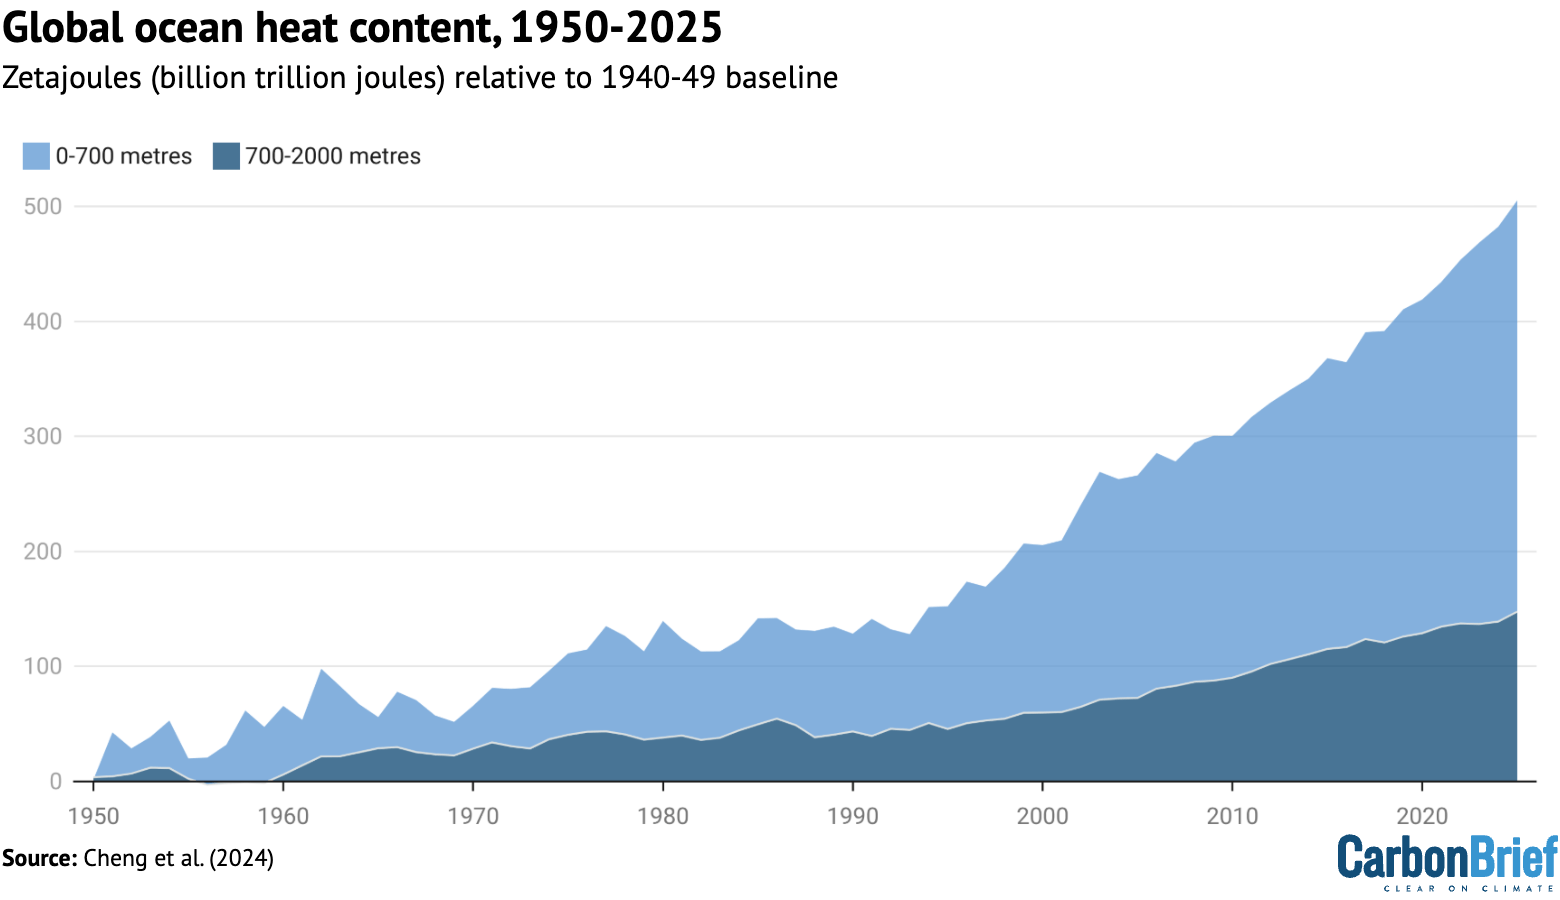
In a new paper published last week, researchers found that the rate of OHC increase over the past 15 years is unprecedented over the observational record in the IAP dataset. More broadly, there has been a distinct acceleration in OHC after 1991 – and recent OHC growth rates are generally consistent with satellite measurements of Earth energy imbalance (EEI).
(Energy imbalance is a measure of how much surplus heat there is in the Earth’s climate system. It is the difference between how much energy enters Earth’s atmosphere from the sun and how excess heat is radiated back into space as the world warms.)
In many ways, OHC represents a much better measure of climate change than global average surface temperatures, because it is where most of the extra heat ends up and is much less variable on a year-to-year basis than surface temperatures.
Surface temperatures tied at second warmest
To assess global surface temperatures in 2025, Carbon Brief uses eight independent datasets: NASA, NOAA, the Met Office Hadley Centre/University of East Anglia’s (UEA) HadCRUT5, Berkeley Earth, Copernicus ERA5, Japan’s JRA-3Q, DCENT and China-MST.
The analysis reveals that global surface temperatures were between the second and third warmest since records began in the mid-1800s. Temperatures effectively tied with 2023 within the margin of uncertainty, below the record set last year in 2024.
The figure below shows global surface temperature records from the eight datasets.

Global surface temperature records can be calculated back to 1850, though some groups such as NASA GISTEMP choose to start their records in 1880 when more data was available.
Prior to 1850, records exist for some specific regions, but are not sufficiently widespread to calculate global temperatures with high accuracy (though newly published research has attempted to extend this back to 1781).
These longer surface temperature records are created by combining ship- and buoy-based measurements of ocean sea surface temperatures with temperature readings of the surface air temperature from weather stations on land. (Copernicus ERA5 and JRA-3Q are an exception, as they use weather model-based reanalysis to combine lots of different data sources over time.)
Some differences between temperature records are apparent early in the record, particularly prior to 1900 when observations are more sparse and results are more sensitive to how different groups fill in the gaps between observations. However, there is strong agreement between the different temperature records for the period since 1970, as shown in the figure below.

Global temperatures over the past three years clearly stand out as much warmer than anything that has come before, well above the prior record set in 2016. More broadly, the 11 warmest years on record all happened in the past 11 years.
Two of the eight datasets analysed by Carbon Brief – NASA and DCENT – had 2025 as the second-warmest year behind 2024, while six of the datasets had 2025 as the third-warmest year behind both 2023 and 2024.
However, in nearly all cases the difference between 2023 and 2025 falls within each dataset’s published uncertainty range, making it effectively a tie between the two years.
The table below shows the reported 2025 global temperature anomalies (relative to each group’s 1850-1900 pre-industrial baseline), as well as a normalised 2025 value using a common pre-industrial baseline between the 1850-1900 and 1981-2010 periods across the five groups with data back to 1850 (NOAA, Hadley/UAE, Berkeley Earth, DCENT and China-MST).
| Dataset | 2025 Reported | 2025 Normalised | Ranking |
|---|---|---|---|
| NASA GISTEMP | 1.39 | 1.45 | Second |
| Hadley/UAE HadCRUT5 | 1.41 | 1.39 | Third |
| NOAA GlobalTemp | 1.33 | 1.41 | Third |
| Berkeley Earth | 1.44 | 1.44 | Third |
| Copernicus ERA5 | 1.47 | 1.47 | Third |
| JRA-3Q | 1.46 | 1.46 | Third |
| DCENT | 1.53 | 1.44 | Second |
| China-MST | 1.39 | 1.42 | Third |
Reported temperature anomalies range from as low as 1.33C (NOAA) to as high as 1.53C (DCENT), primarily reflecting differences in the early part of the record. The normalised 2025 values have a much smaller range, from 1.41C (NOAA) to 1.47C (Copernicus).
Separate land and ocean temperatures are not available yet from all of these groups. However, Berkeley Earth reports that global land temperatures in 2025 were the second warmest on record, at 2.03C above pre-industrial levels, while ocean temperatures were the third warmest at 1.03C.

Global land regions – where the global human population lives – has generally been warming around 70% faster than the oceans and 40% faster than the global average since 1970.
The year started off quite hot, with January 2025 setting a new record as the warmest January. All other months of the year ended up being either the second or third warmest on record after 2024 and 2023.
The figure below shows each month of 2025 in dark red, compared to all prior years since 1850. Each year is coloured based on the decade in which it occurred, with the clear warming over time visible, as well as the margin by which both 2023, 2024 and 2025 exceeded past years.

Extreme regional temperatures
While the globe as a whole was tied as the second warmest on record, many different regions of the planet set new records in 2025.
The figure below shows how global temperature deviated from the average in 2025 across the world. Areas shaded in red were warmer than the baseline period (1951-80) used by Berkeley Earth, whereas the few blue areas experienced cooler temperatures.
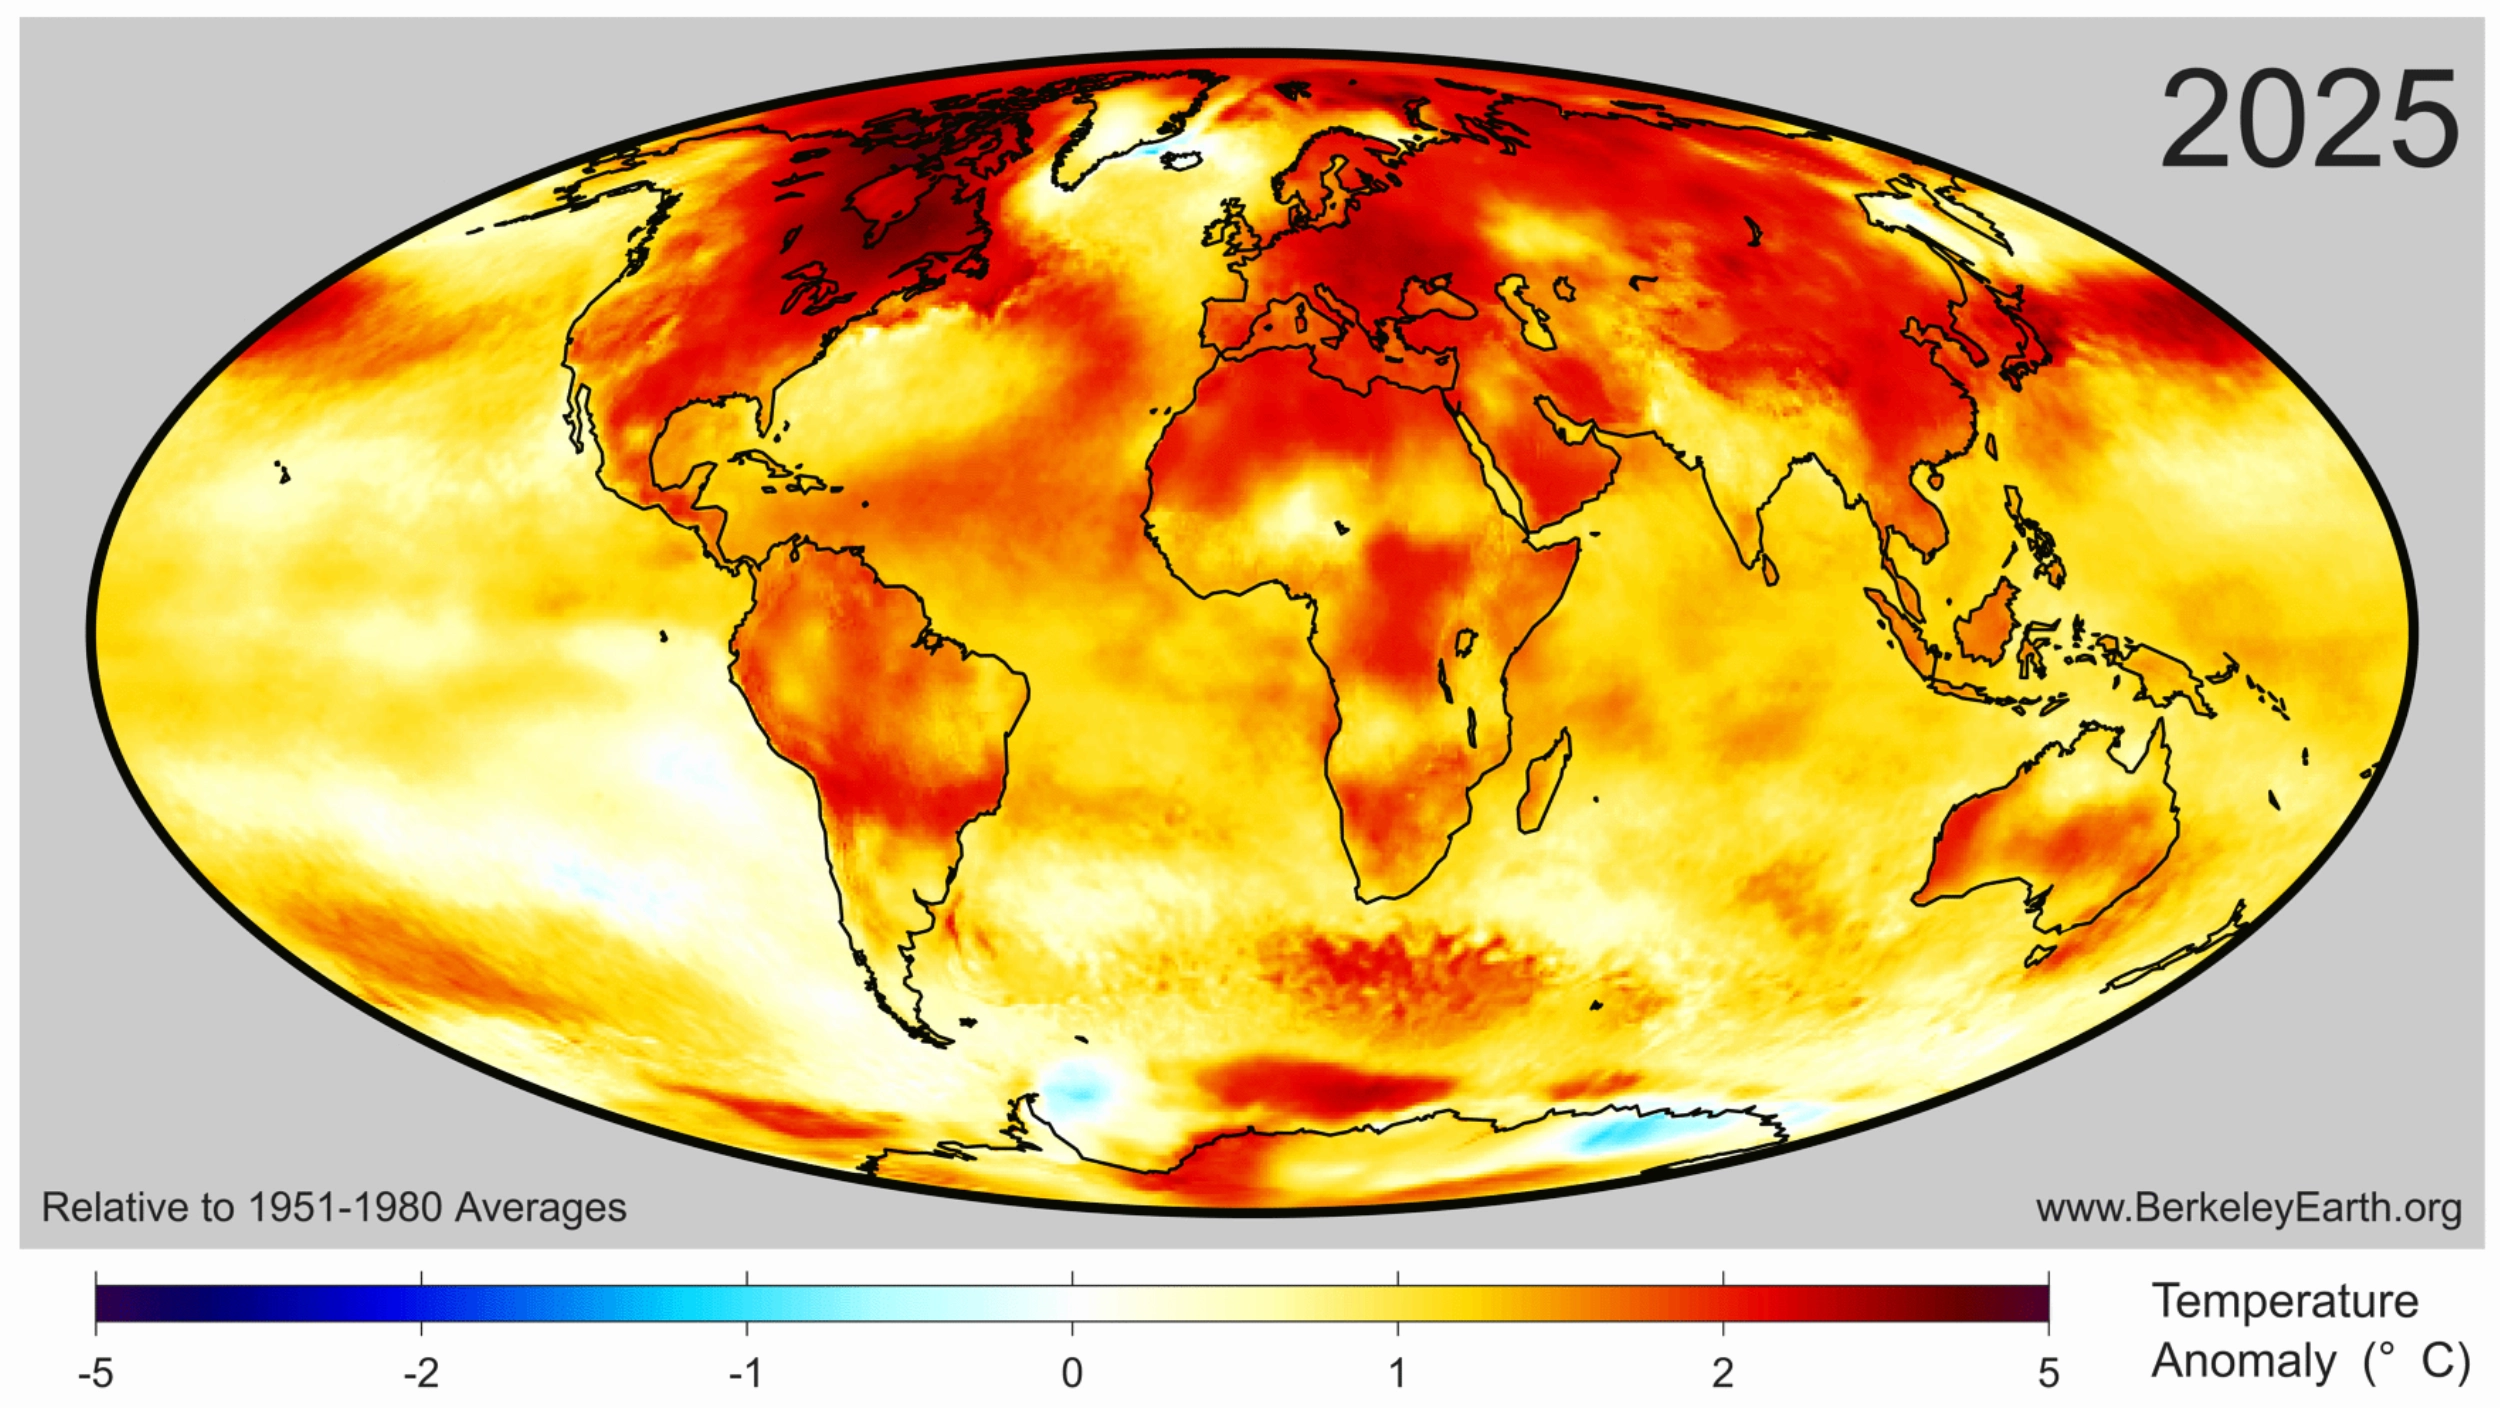
Collectively, approximately 770 million people – 9.3% of Earth’s population – live in places that experienced their warmest year on record in 2025. This was mostly concentrated in Asia, including around 450 million people in China.
The figure below highlights regions of the planet that experienced their top-five warmest (red shading) or coldest (blue) temperatures on record in 2025. Overall, around 9% of the planet set a new record, including 11% of the land and 8% of the ocean. No location on the planet experienced record cold temperatures – or even top-five record cold temperatures – for the year as a whole.
Drivers of recent record warmth
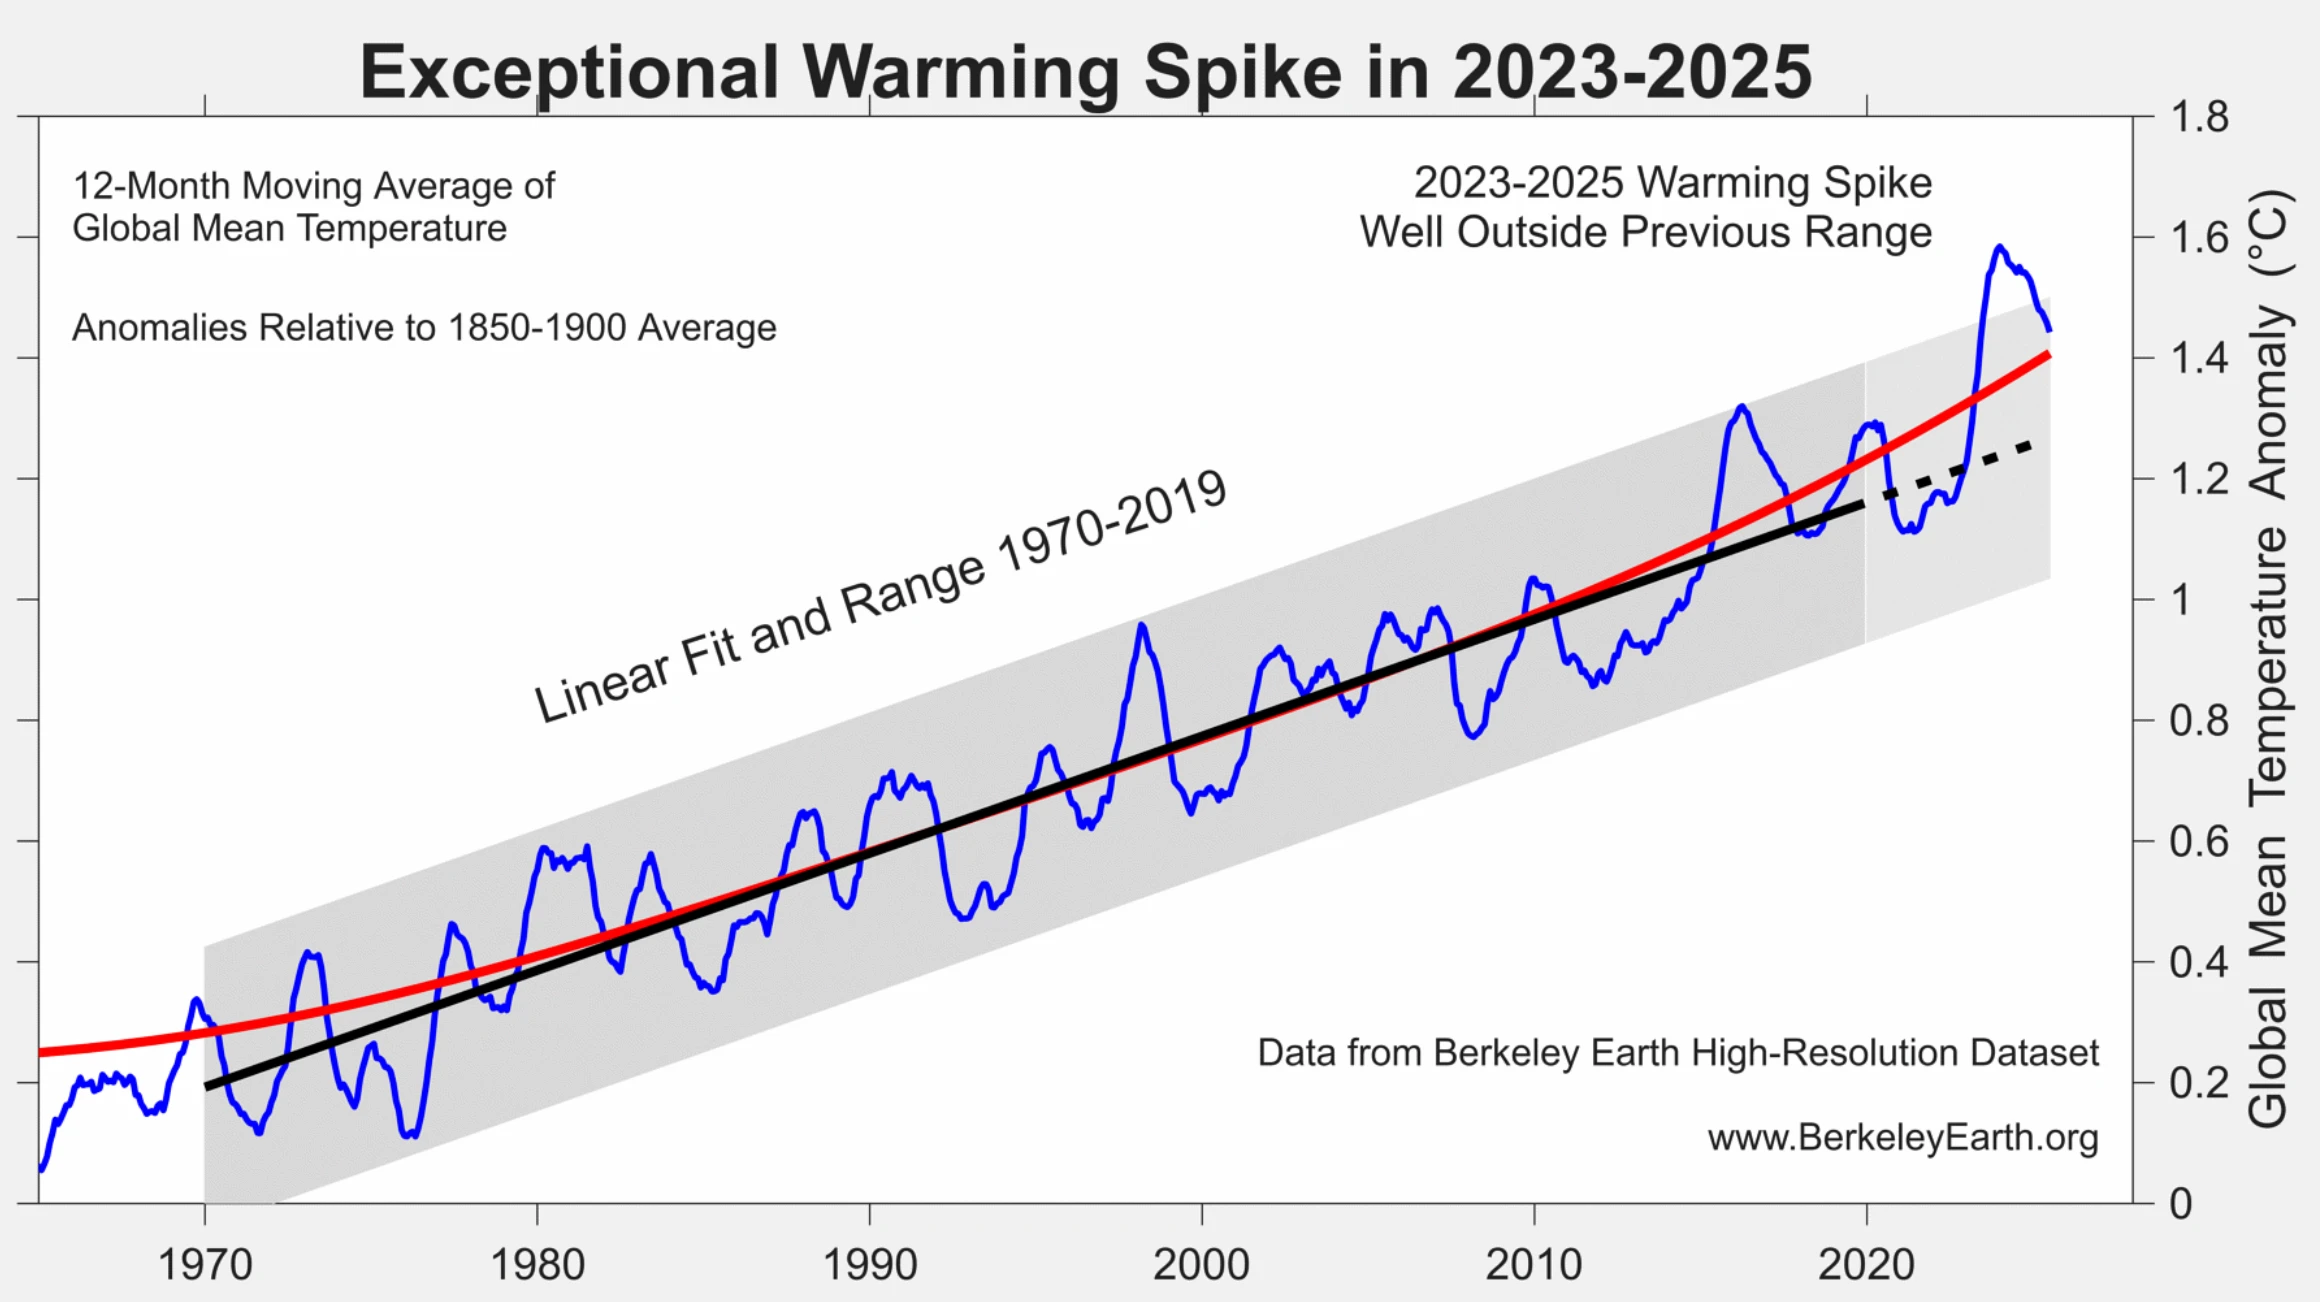
Global temperatures over the past three years have been unusually warm, well above what would be expected given the long-term warming trend of around 0.2C per decade since the 1970s.
Recent research has found that global warming has accelerated in recent years to around 0.27C per decade, though this acceleration is largely in-line with climate model projections under scenarios where greenhouse gas emissions continue to rise while emissions of planet cooling aerosols are reduced.
According to analysis from Berkeley Earth, the odds of global temperatures over 2023-25 occurring as a result of greenhouse gas emissions and natural variations in the Earth’s climate alone “is less than one-in-100” and “likely indicates that recent years have been impacted by additional warming factor(s)”.
The figure below shows how the exceptional warming spike of 2023-25 compares to the longer-term warming trend and historical climate variability.
Carbon Brief recently explored the drivers of recent warmth in more detail, finding that it is likely to have been driven by a combination of:
- A strong El Niño event that developed in the latter part of 2023.
- Rapid declines in sulphur dioxide emissions – particularly from international shipping and China.
- An unusual volcanic eruption in Tonga in 2022 that put a large amount of aerosols and water vapor into the upper atmosphere.
- A stronger-than-expected solar cycle.
This is illustrated in the figure below, which provides an estimate of the impact of each of these different factors on 2023 and 2024 temperatures, along with their respective uncertainties.
The sum of all the factors is shown in the “combined” bar, while the actual warming compared to expectations is shown in red. The upper chart shows 2023, while the lower one shows 2024.

The first bar includes both El Niño and natural year-to-year climate variability; the height of the bar reflects the best estimate of El Niño’s effects, while the uncertainty range encompasses year-to-year variability in global temperatures that may be – at least in part – unrelated to El Niño.
While a similar analysis has yet to be undertaken for 2025, the end of El Nino conditions and the development of a modest La Nina would have driven temperatures down, while the warming impact of shipping, Chinese aerosol declines would have slightly increased. The warming effect of the solar cycle would likely have remained flat or slightly declined as solar cycle 25 passed its peak.
Finally, a World Meteorological Organization (WMO) assessment of the Hunga Tonga-Hunga Ha’apai volcano found that “the record-high global surface temperatures in 2023-24 were not due to the Hunga eruption”.
The report suggested that the volcano had a small cooling effect (-0.03C) globally in 2023 and 2024. This might switch to a small warming effect (+0.03C) in 2025 and 2026 as the planet-cooling aerosols from the volcano fall back down to the surface but some of the stratospheric water vapour remains, it noted.
However, it added, these effects are “indistinguishable from background variability in the current climate”.
El Niño and La Niña are generally the largest drivers of year-to-year variability in global temperatures. The figure below shows the El Niño (red shading) and La Niña (blue) conditions over the past 40 years (collectively referred to as the El Niño-Southern Oscillation, or “ENSO”).

Carbon Brief has used the historical relationship between ENSO conditions and temperature to effectively remove the effects of El Niño and La Niña events from global temperatures, as shown in the figure below.
This analysis indicates that El Niño cooled global temperatures in 2025 around -0.05C, following a boost to global temperatures of around 0.12C in 2024, compared to the estimate of global temperatures with both El Niño and La Niña events removed.

This suggests that the shift from El Nino to La Nina conditions can fully explain the decline in global temperatures between 2024 and 2025 and that 2025 would have likely been the warmest year in the observational record if it had not been for the effects of ENSO.
Scientists provided estimates of where they expected 2025 temperatures to end up at the start of the year.
The figure below shows estimates by four different groups that provided temperature predictions for the year prior to any data being collected – the Met Office, NASA’s Dr Gavin Schmidt, Berkeley Earth and Carbon Brief’s own estimate — compared to what actually transpired.

Unlike in 2023 –and, to a lesser extent, 2024 –when start-of-year predictions were notably low, 2025 fell reasonably in-line with what was expected. The Met Office estimate was nearly exactly on target, with Berkeley Earth’s being close as well. Carbon Brief and Schmidt’s estimates were a little on the low side, but actual temperatures were well within the estimated error bars.
Observations in-line with climate model projections
Climate models provide physics-based estimates of future warming given different assumptions about future emissions, greenhouse gas concentrations and other climate-influencing factors.
Here, Carbon Brief examines a collection of climate models – known as CMIP6 – used in the 2021 science report of the IPCC’s sixth assessment.
In CMIP6, model estimates of temperatures prior to 2015 are a “hindcast” using known past climate influences, while temperatures projected from 2015 onward are a “forecast” based on an estimate of how things might change.
The figure below shows how observations compare to the full ensemble of 37 CMIP6 models under the middle-of-the-road SSP2-4.5 emissions scenario for future projections. The red line represents the average of all the models and the red areas showing the 5th to 95th percentile range. The average of the eight observational temperature datasets are plotted as dots on top of the climate model data.
The chart illustrates how observations have generally been a bit below the model average over the past two decades, were slightly above model average in 2024 and are more or less dead on in 2025.

However, the ensemble of CMIP6 models differs from the main projection of future warming in the recent IPCC AR6 report. A subset of CMIP6 models have unrealistically high climate sensitivity and they reproduce historical observations poorly.
To account for this, rather than simply averaging all the models – as had been done in prior assessments – the IPCC employed an approach that effectively weights models by their performance. As a result, the models align better with the range of climate sensitivity derived from multiple different lines of evidence.
The chart below shows the assessed warming projections from the IPCC AR6 report in red, with historical observations since 1850 as black dots.
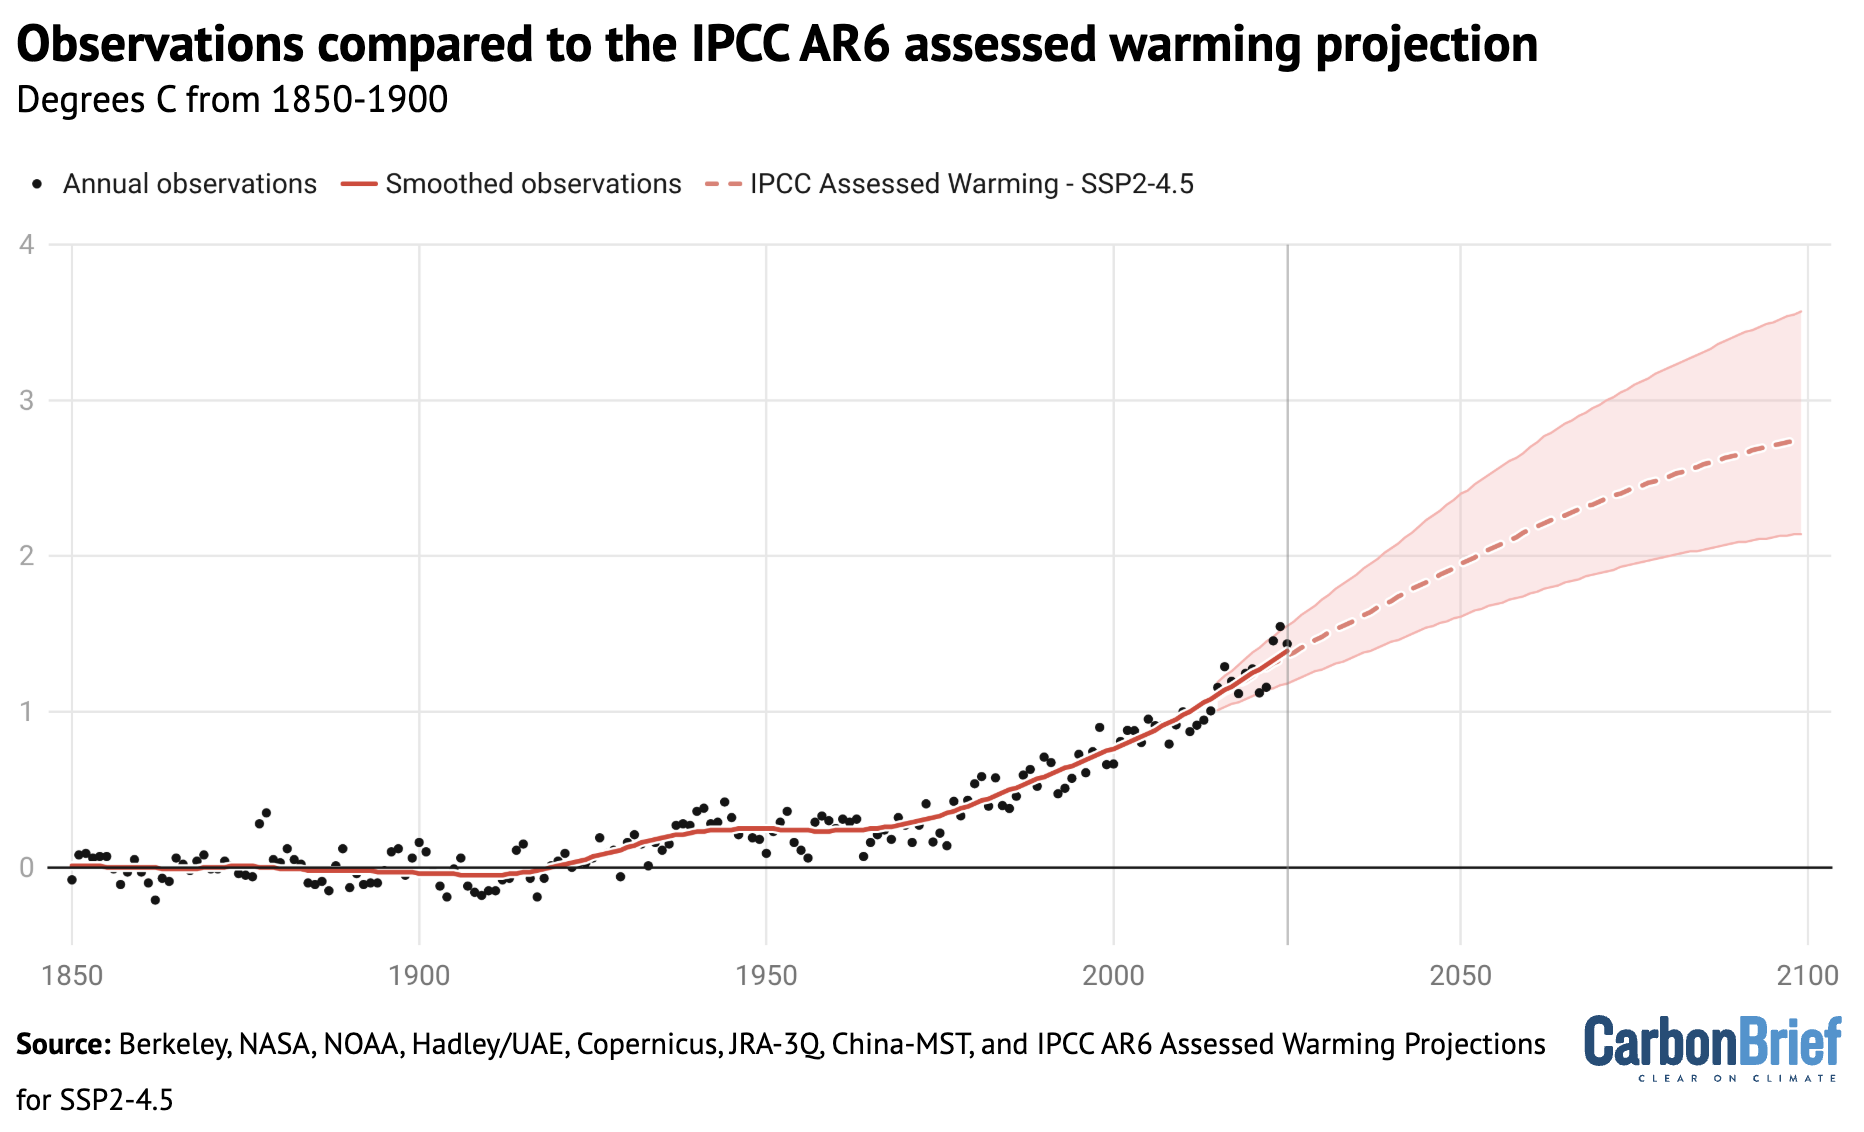
The chart reveals that observed global surface temperatures (black dots) are further above the modeled central estimate 2023-25, but generally remain within the IPCC assessed range.
Climate models broadly expect an acceleration of warming in the current period in a scenario like SSP2-4.5 where emissions of CO2 and other greenhouse gases continue to modestly increase, but emissions of planet-cooling aerosols like sulphur dioxide are rapidly reduced.
Second-warmest atmospheric temperatures
In addition to surface measurements over the world’s land and oceans, satellite microwave sounding units have been providing estimates of temperatures at various layers of the atmosphere since 1979.
The lowest layer of the atmosphere that satellite microwave units provide temperature estimates for is the lower troposphere. This data reflects temperatures a few kilometres above the Earth’s surface. It reveals a pattern of warming in the lowest troposphere that is similar – though not identical – to surface temperature changes.
The records produced by Remote Sensing Systems (RSS), the University of Alabama, Huntsville (UAH) and NOAA show 2025 as the second warmest year on record in the lower troposphere, after 2024. The chart below shows the three records for the lower troposphere, using a more recent baseline period (1981-2010) given the absence of satellite data before 1979.

The lower troposphere tends to be influenced more strongly by El Niño and La Niña events than the surface. Therefore, satellite records show correspondingly larger warming or cooling spikes during these events. This explains why there was both a bigger increase between 2023 and 2024 and a bigger decline between 2024 and 2025 in the satellite record than in surface records.
The lower-tropospheric temperature records show large differences after the early 2000s. RSS shows an overall rate of warming quite similar to surface temperature records, while UAH and NOAA show considerably slower warming in recent years than has been observed on the surface.
Greenhouse gas concentrations reach new highs
Greenhouse gas concentrations reached a new high in 2025, driven by human-caused emissions from fossil fuels, land use and agriculture.
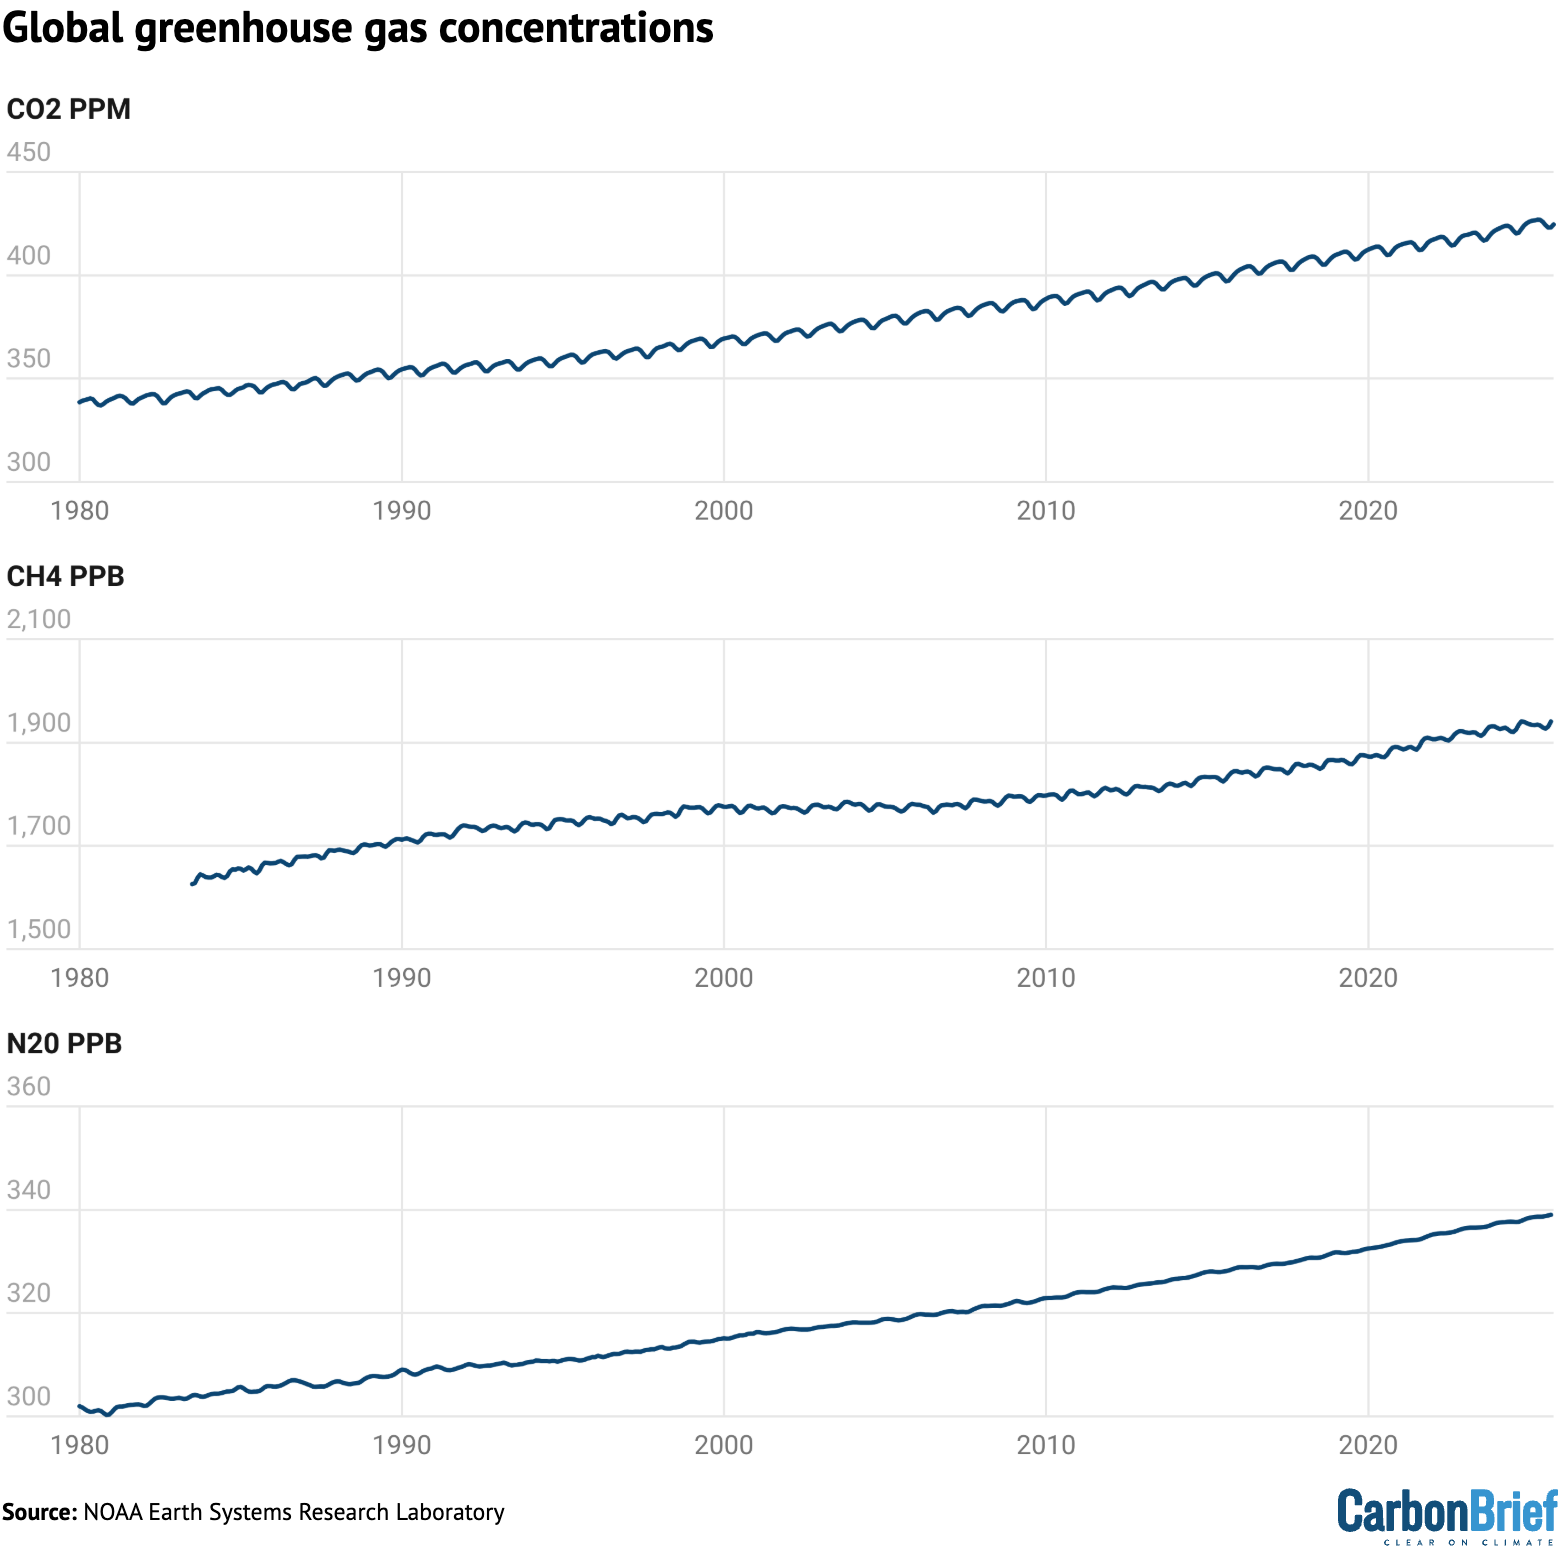
Three greenhouse gases – CO2, methane (CH4) and nitrous oxide (N2O) – are responsible for the bulk of additional heat trapped by human activities. CO2 is by far the largest factor, accounting for roughly 42% of the increase in global surface temperatures since the pre-industrial era (1850-1900).
Methane accounts for 28%, while nitrous oxide accounts for around 5%. The remaining 25% comes from other factors including carbon monoxide, black carbon and halocarbons, such as chlorofluorocarbons (CFCs).
Human emissions of greenhouse gases have increased atmospheric concentrations of CO2, methane and nitrous oxide to their highest levels in at least a few million years – if not longer.
The figure below shows concentrations of these greenhouse gases – in parts per million (ppm) for CO2 and parts per billion (ppb) for methane and nitrous oxide – from the early 1980s through to October 2025 for CO2 and September 2025 for CH4 and N2O (the most recent data currently available).
Sea level is rising rapidly
Modern-day sea levels have risen to a new high, due to a combination of melting land ice (such as glaciers and ice sheets), the thermal expansion of water as it warms and changes in land water storage.
In recent years, there have been larger contributions to sea level rise from melting ice sheets and glaciers, as warmer temperatures accelerate ice sheet losses in Greenland and Antarctica.
Since the early 1990s, the increase in global sea level has been estimated using altimeter data from satellites. Earlier global sea levels have been reconstructed from a network of global tide gauge measurements. This allows researchers to estimate how sea level has changed since the late 1800s.
The chart below shows five different modern sea level rise datasets (blue lines), along with satellite altimeter measurements as assessed by AVISO (in black) after 1993. (As sea level rise data has not yet been released for the whole year, the 2025 value is estimated based on data through to November.)

Sea levels have risen by over 0.2 metres (200mm) since 1900. While sea level rise estimates mostly agree in recent decades, larger divergences are evident before 1980. There is also evidence of accelerating sea level rise over the post-1993 period when high-quality satellite altimetry data is available.
(To understand more on how climate change is accelerating sea level rise, read Carbon Brief’s explainer.)
Shrinking glaciers and ice sheets
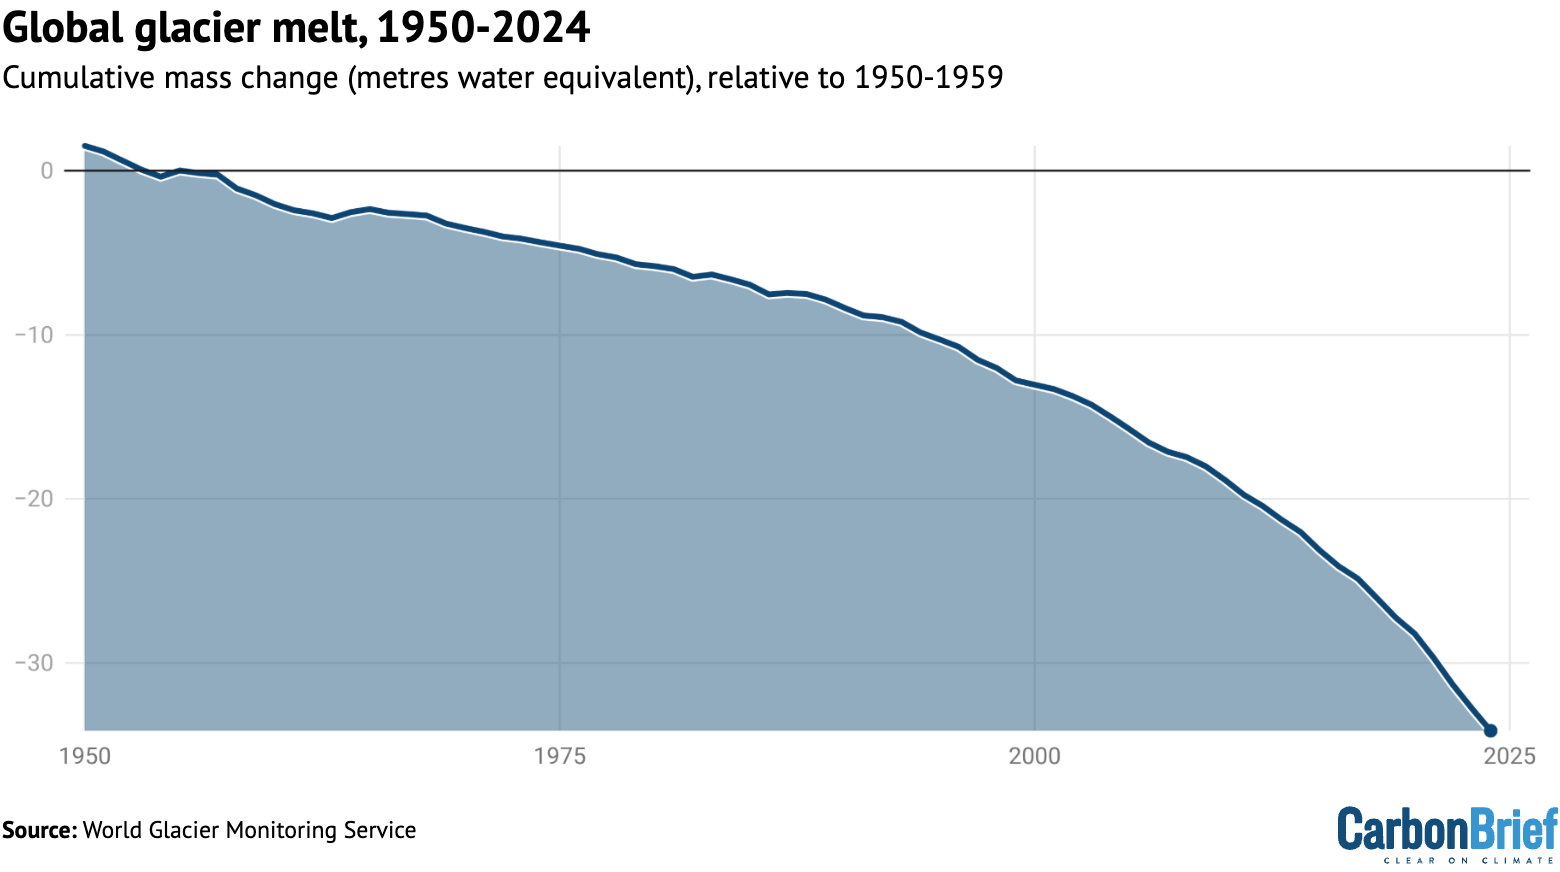
A significant portion of global sea level rise is being driven by melting glaciers on land.
Scientists measure the mass of glaciers around the world using a variety of remote-sensing techniques, as well as through GRACE measurements of the Earth’s gravitational field. The balance between snow falling on a glacier and ice loss through melting and the breaking off – or “calving” – of icebergs determines if glaciers grow or shrink over time.
The World Glacier Monitoring Service is an international consortium that tracks more than 130 different glaciers in 19 different regions around the world. The figure below shows the change in global average glacier mass from 1950 through to the end of 2024. (2025 values are not yet available.) Note that glacier melt is reported in metres of water equivalent, which is a measure of how much mass has been lost on average.
Greenland ice sheets have become a larger contributor to sea level rise in recent years due to accelerating loss of mass. The year 2025 was the 29th in a row where Greenland lost ice overall, with 105bn tonnes of ice lost over the 12 months from September 2024 to August 2025. Greenland last saw an annual net gain of ice in 1996.
The figure below shows the cumulative mass balance change – that is, the net ice loss – from Greenland between 1970 and 2025. The authors find that Greenland has lost around 6tn tonnes of ice over the past 50 years – more than 700 tonnes lost per person for every person on the planet.

Lowest winter Arctic sea ice extent
Arctic sea ice saw its lowest winter peak on record as well as its 10th-lowest summer minimum extent, while Antarctic sea ice saw its third-lowest minimum extent.
Both the Arctic and Antarctic were at the low end of the historical (1979-2010) range for most of 2025, with new daily lows recorded for Arctic sea ice extent in January, February, March, June and December.
The figure below shows both Arctic (red line) and Antarctic (blue line) sea ice extent for each day of the year, along with how it compares to the historical range (corresponding shading).

Looking ahead to 2026
There is reason for caution when estimating likely temperatures for 2026.
In 2023, temperatures were significantly higher than predictions made at the start of the year, while 2024 temperatures were towards the high end of annual predictions. Temperatures in 2025 were more in-line with predictions, albeit still on the higher side for three out of the four predictions included above.
There are currently weak La Niña conditions currently present in the tropical Pacific, which are expected to extend through February. This would somewhat suppress temperatures in the first half of the year. However, the latest forecasts suggest a growing likelihood of El Niño conditions developing by June, which may lead to warmer temperatures in late 2026 – and potentially much warmer temperatures in 2027.
Carbon Brief predicts that global average surface temperatures in 2026 are likely to be between the second and fourth warmest on record, similar to 2023 and 2025, at around 1.4C above pre-industrial levels.
This is the fourth published temperature prediction for 2026, after those already produced by the Met Office, NASA’s Dr Gavin Shmidt and Berkeley Earth.
The figure below shows the four different 2026 predictions compared to the average of eight different temperature records explored in this article. (These have been “normalised” to show 2026 warming relative to the 2023-25 average to allow a clear comparison, given that each of the predictions was originally presented for a different temperature record.)
Carbon Brief’s prediction of likely 2026 temperatures is based on a statistical model using the average temperature of the past year, the latest monthly temperature and projections of ENSO conditions over the first three months of 2026.

The Met Office, Dr Schmidt, Berkeley Earth and Carbon Brief estimates all have 2026 ending up as somewhere between the second- and fourth-warmest year on record, with the best estimate as being more or less tied with 2023 and 2025.
There is a very small chance that 2026 could end up beating 2024 as the warmest year on record, or end up below 2016 as the fifth or sixth warmest year.
However, with the growing likelihood of El Niño conditions developing in the second half of 2026, it is increasingly likely that 2027 will challenge 2024 for the title of the warmest year on record. The rate of warming has notably accelerated over the past 15 years and the period of exceptionally warm years that started in 2023 shows no signs of abating.



The post State of the climate: 2025 in top-three hottest years on record as ocean heat surges appeared first on Carbon Brief.
State of the climate: 2025 in top-three hottest years on record as ocean heat surges

The African continent’s hopes for a legally binding agreement to combat drought have been dashed again, as UN land restoration talks in Mongolia passed the issue onto the next set of talks in Egypt in two years’ time.
For over a decade, Africa has pushed for a UN protocol on drought risk management that would acknowledge drought as an issue requiring a regional and global – not just a national – response, potentially paving the way for more finance to help ensure water is available when drought hits.
A formal protocol would enable countries to transition from reacting to drought once it hits to “a proactive enabling mechanism to address drought and its effects such as migration”, said a Tunisian negotiator on behalf of the African Group of countries last week. Once land is regularly too dry and infertile to grow crops or graze animals, people often leave to seek a living elsewhere.
But this effort to adopt a protocol, led by Africa, has been resisted at successive land restoration COPs under the UN Convention to Combat Desertification (UNCCD), mainly by developed countries, which argue that a legally weaker alternative – a framework – would be faster and cheaper to set up.
Governments at the previous COP in Saudi Arabia in 2024 failed to reach agreement despite talks running past midnight, while this year’s saw African officials coordinate a walkout from negotiating rooms on Wednesday morning, according to two sources at the talks.
Drought deal delayed until 2028
The IISD’s Earth Negotiations Bulletin, a non-governmental organisation which unlike the media is allowed to watch and report on closed-door talks, said a call to suspend negotiations on Wednesday showed negotiations had reached “boiling point” and “made some jaws drop”.
Negotiations resumed after a lunchtime meeting with the Mongolian COP presidency although governments were only eventually able to agree that they could not find consensus in Ulaanbaatar and should resume talks on an instrument to deal with drought in 2028.
Christine Colvin, WWF’s head of freshwater policy, told Climate Home News that, with droughts hitting from Honduras to the English region of Hampshire, something concrete – whether a protocol or a framework – is needed urgently “rather than the can being kicked down the road for another two years as will now happen with the protocol procrastination”.

But, in a closing press conference on Friday, the Mongolian minister presiding over talks celebrated that governments had reached consensus on several “contentious” issues and that agenda items blocked at this year’s COP17 would be put on the agenda for COP18 in Egypt.
US blocks agenda items
Other agenda items that divided countries were on measuring land degradation’s effects on women, enhancing the involvement of civil society and women in land COPs, and the UNCCD working more closely and effectively with the UN’s climate and nature conventions.
On the COP’s opening day two weeks ago, the US representative said the Trump government objects to these agenda items “on their premise and no amount of negotiation will allow us to join consensus on these items. As such we request that they be struck from the agenda at which time we will then be able to approve it, saving us valuable negotiating time.”
A US State Department spokesperson later told Climate Home News that the US wants the UN “to get back to basics by refocusing on its core mandate, eliminating overlap, and reducing competition for scarce resources”.
The spokesperson added, “that means prioritising the concrete work member states created [the UN] to do – rather than diverting limited time, attention, and resources toward social and political agendas, including gender-related initiatives.”

On COP’s first day, the European Union and Brazil pushed back against the blocking of these agenda items, with a Brazilian negotiator saying his country attaches “great importance” to them. But the Mongolian presidency directed governments to adopt the rest of the agenda without the controversial items, which were discussed privately with countries throughout the two weeks.
An EU statement, read out later by Irish minister Timmy Dooley, accused “some parties” (meaning national governments) of having adopted a “less constructive approach” and preventing “discussions on important matters from even commencing”.
The agenda items the US refused to engage with were never discussed and were only placed onto the agenda for the next COP on the last day. Those talks will take place in Egypt in two years’ time, with Donald Trump due then to be in his last year as US president.
No restoration without women
The blocking of the gender agenda item has stymied attempts, agreed on by governments at the last COP, to develop gender-specific indicators for the UNCCD’s next overall framework and to facilitate more women delegates at COPs. Women made up only about a quarter of delegates to COP15 in 2022, UNCCD analysis with the latest data shows
Criticising the move to keep gender off the agenda, the EU said in a statement that it welcomes “the attention being given at COP17 to women pastoralists and herders, recognising their contribution to sustainable land management and resilient rural livelihoods”.
The head of the UNCCD, former Egyptian environment minister Yasmine Fouad, said on Friday that “regardless that the agenda item was blocked”, she was proud that she and COP17 President Batmunkh Battsetseg had led the COP as women and attended the gender caucus (a meeting of groups supporting women at the talks).

“Without the women,” she told the closing press conference on Friday, “we will not be able to restore land, restore hope, restore life or restore even our children and grandchildren. And we will keep on pushing that agenda.”
The civil society agenda item aimed to allow NGOs to attend land COP negotiations, as they do at climate COPs, and included terms of reference for an Indigenous Peoples Caucus.
A representative of Indigenous Peoples told the COP’s closing plenary meeting that the group had “deep disappointment that the agenda of this COP has removed the dedicated space for indigenous peoples”. “We cannot restore the land while removing the voices of those who care for it,” she said.
On Tuesday, the UNCCD’s deputy head Andrea Meza was asked about Indigenous Peoples’ participation. She said that the blocking of “one agenda item” is “generating uncertainty in the progress” towards creating caucuses for Indigenous Peoples and for Local Communities within the talks.
Because of the “complex geopolitical situation” making it hard to obtain consensus, coalitions of the willing have become more important, she added.
Mining out, money in
Outside the formal negotiations, the summit was marked by a focus on the strongly Mongolian issues of the role played by pastoralists and rangelands like grasslands, as well as mining, in both degrading and restoring land.
Part of the conference was sponsored by Australian mining company Rio Tinto and its local partner Oyu Tolgoi. Their presence was protested by campaigners wearing T-shirts calling on the companies to “stop wasting drinking water” and to “get out of Mongolia”.

The UNCDD and others praised the success of the summit in raising more finance for land restoration. The COP saw institutions like the Asian Development Bank and Global Environment Facility pledge money to combat land degradation, with the UNCCD estimating that $645 million of new commitments were made.
An estimated $355 billion a year is needed through 2030 to meet global land restoration commitments, compared with around $77 billion currently invested. Private finance accounts for only around 6% of global investment, according to the UNCCD.
UNCCD chief scientist Baron Orr told a press conference that many of the announcements were public-private partnerships that use government money to “even the playing field” for companies that want to protect land, in a bid to ensure they are not disadvantaged compared with those that do not.
Such partnerships are a “huge opportunity”, he said, especially as “we’re not in a moment of public finance – public finance is tight in every country.”
The post Despite African walkout, fractious land COP ends without drought deal appeared first on Climate Home News.
Despite African walkout, fractious land COP ends without drought deal
Burdened by rising fuel import costs and an “ocean crisis” of record-breaking heat, Pacific island nations are seeking to build support for a new regional fund ahead of COP31, intended to channel investment into renewable energy, community resilience and ocean protection, experts said.
Leaders from the 18-member Pacific Islands Forum (PIF), including Australia and New Zealand, are expected to issue a call for global pledges to the Pacific Resilience Facility (PRF) at a high-level meeting this coming week in Palau, seeking to build a new model for financing climate action.
The new regional fund was formally launched in May this year and is meant to “serve communities at a community level”, swiftly channelling investments for their projects on the ground, according to Fiji’s assistant minister for foreign affairs, Lenora Qereqeretabua.
“We are expecting pledges for the PRF, and these funds will go to communities that apply,” she told journalists at an online briefing. “We have organised it in such a way that it makes our application processes much, much easier than applying for global funding.”
Qereqeretabua added that she expects that PRF funds will be “utilised by communities to protect themselves from climate change and the effects of climate change.”
The Pacific Islands Forum meeting is expected to shape the region’s priorities ahead of this year’s pre-COP, hosted by Fiji and Tuvalu, and COP31, which will be co-led by Australia and Türkiye.
At COP31, a dedicated session on the climate finance needs of small island states will seek to drive pledges into the PRF. The fund has so far received about $172 million in capital – with about $67 million coming from Australia – and aims to close the year with $500 million.
-
Battle over cleaning up shipping set to resume at London talks
The US and Saudi Arabia want to scrap shipping’s Net-Zero Framework and have swung behind a far less ambitious alternative -
As marine heat breaks records, countries seek ocean roadmap at COP31
Africa and the EU are leading a push for COP31 to deliver a roadmap that lays out measures to protect fast-warming oceans -
Indonesia’s nickel production cuts are not enough to create a sustainable industry
The government is restricting nickel production to push up prices but producing more sustainable nickel for a premium requires addressing the industry’s coal issue


Ocean heat and fossil fuel shocks
Leaders from the Pacific will meet in Palau from Sunday amid an “ocean crisis” of record-breaking ocean heat caused by this year’s “super El Niño”, according to Kevin Chand, Pacific ocean policy director at National Geographic’s Pristine Seas conservation project.
Leaders at the PIF are expected to put forward commitments towards new marine protected areas, which will be key for shielding ecosystems from future climate extremes, Chand said. The forum is expected to issue a statement on the need for ocean action at COP31, and announce commitments towards reaching the global goal of protecting 30% of the planet’s land and sea ecosystems by 2030.
Rising ocean heat could lead to food insecurity and lost government earnings in the region, as key fish stocks like tuna start migrating away from their coastline in search of colder waters, said Coral Pasisi, director of climate change and sustainability at the Pacific Community (SPC).
Climate shocks are deepening existing economic pressures, as Pacific nations have spent up to a quarter of their GDP on fossil fuel imports due to the war in Iran, according to a recent report by the University of New South Wales (UNSW) in Australia.
Wesley Morgan, one of the study’s authors, told journalists that partner nations “ought to be putting their money where their mouth is”, and should support the energy transition in the Pacific by covering the upfront costs of switching from polluting diesel to solar power, batteries and electricity grid upgrades.
China keeps Indonesia’s battery dream afloat but future less certain
Given the increase in climate-related shocks and sea-level rise, the PIF should also mention the need to phase out fossil fuel extraction and consumption, said Sindra Sharma, international policy lead at the Pacific Islands Climate Action Network (PICAN).
Last year’s COP30 failed to deliver a global roadmap on transitioning away from fossil fuels, which led to a group of countries – including several Pacific island nations – pursuing their own fossil fuel phase-out summit in Santa Marta, Colombia. Next year’s conference will be hosted by Tuvalu and co-chaired by Ireland, which should also receive backing from the PIF, Sharma said.
Both the chairs of the Santa Marta coalition and the Australian COP31 co-presidency have vowed to continue a push for this topic to be discussed at COP31.

New fund to test allies
As local communities in the Pacific struggle to access global climate funds, the PRF’s planned model for quick, direct disbursements has “very solid and good” intentions, Sharma said, but it will need political and financial backing from donor countries.
“The proof is going to be when the fund actually starts operating and delivering to communities,” she added. “If there is too much bureaucracy in being able to access the funds, for example. These things will have to be scrutinised.”
The facility aims to deliver funds in two categories: one for climate adaptation and “disaster resilience”, and another for social and community resilience that includes areas like community capacity-building, education, data analytics and financial management, among others. It will launch its first call for proposals at the PIF.
Morgan added that Australia will need to “leverage global interests” so that funding is directed to the Pacific Resilience Facility “or else the Pacific won’t be able to trust Australia as a partner”. The country ratified the PRF treaty in May, triggering its entry into force.
“The perception [of Australia] in the region is genuinely divided, and it’s worth being honest about it,” Sharma said, adding that the pre-COP31 in Fiji, which is usually limited to a technical space for negotiations, will determine how meaningful Australia’s advocacy for the Pacific can be.
This time, Pacific nations want to use the pre-COP in early October as an opportunity to demonstrate the challenges their largely low-lying islands face and to advocate for their political priorities, including a renewed global effort to limit global warming to 1.5C by cutting emissions faster and deeper. World leaders are due to visit Tuvalu to experience the frontline of rising sea levels, although Australia and Fiji have yet to confirm who will attend.
“In Bonn, Australia was largely missing on the negotiated outcomes that we so urgently need to see. It’s not enough to get Pacific priorities on the agenda. Agenda placement is not delivery,” Sharma added.
The post Pacific islands seek backing for new regional fund ahead of COP31 appeared first on Climate Home News.
Pacific islands seek backing for new regional fund ahead of COP31
Climate Change
Climate change exposes 580 million children to 20 extra ‘heat-stress days’ every year
More than 40% of children under the age of 10 globally are already experiencing at least 20 additional “heat-stress days” due to climate change.
This is according to a new attribution study, published in Science Advances, which combines climate models with demographic data to assess the age groups and regions that are exposed to the most hot, humid days.
The study finds that children up to the age of nine already face more additional heat-stress days globally as a result of climate change than any other age group.
It adds that south Asia and west Africa are recording the greatest childhood exposure to dangerous levels of humid heat – largely because these regions have a rapidly growing population with the highest proportion of young children.
As the climate warms, children will continue to be more exposed to heat stress than any other age group, the paper warns.
The lead author of the study tells Carbon Brief that the findings should inform discussions about climate justice, noting that children in developing countries “have contributed the least to historical greenhouse gas emissions”.
Humid heat
High temperatures can be deadly. For example, the heatwaves that swept across Europe in the summer of 2026 have been linked to tens of thousands of “excess deaths”.
A prominent 2021 study found that children born in the 21st century will be exposed to more extreme weather events in their lifetimes than their parents and grandparents.
Four years later, a study conducted by scientists from the same team found that more than half of children born in 2020 – around 62 million people – will experience “unprecedented lifetime exposure” to heatwaves, even if warming is limited to 1.5C.
Now, the latest research from the same team finds that children already face greater exposure to dangerous levels of humid heat than adults as a result of human-caused climate change.
Extreme heat is particularly dangerous when combined with high humidity. In hot weather, the human body produces sweat to cool itself down. However, as humidity increases, sweating becomes less effective.
The study uses wet-bulb globe temperature – a measure of temperature that takes humidity and wind into account – to calculate heat stress. It defines a “heat-stress day” as any day with a wet-bulb globe temperature above 28C, as this is considered the threshold for “moderate heat stress”
The authors then use climate models to simulate global temperature patterns in the present-day climate. (The authors use the climate of 2023, in which human activity has caused 1.3C of warming, to represent the “present-day”.)
They then count the number of heat-stress days that each country records on average, per year. The authors then repeat this exercise, simulating a pre-industrial climate without human-caused warming.
By comparing the number of heat-stress days in the present-day climate with the number in a pre-industrial climate, the authors can determine how many extra heat-stress days were driven by climate change. They refer to these as “extra” or “attributable” heat-stress days.
The authors find that “low-latitude” countries, located in the tropics, record the most extra heat-stress days.
For example, the paper finds that people living in Côte d’Ivoire currently face 112 heat-stress days every year. It adds that around half of these are due to human-caused climate change.
In contrast, Germany sees only 0.1 heat-stress days per year in today’s climate on average, which is largely attributable to human-caused climate change.
Rosa Pietroiusti, a PhD student at Vrije Universiteit Brussel and lead author on the study, explains why this number may seem lower than expected.
She tells Carbon Brief that the paper “really focuses on humid heat, at levels that are relatively rarely felt in Europe”. She adds:
“Our data also doesn’t capture the urban heat island effect, due to the resolution of the data we use, which also would lead to underestimations of heat stress locally, and lead to a mismatch with what people are experiencing at local scales, particularly in cities.”
Inequality
Extreme heat affects some people more severely than others. Children, people over 65 and those with pre-existing medical conditions or certain disabilities are among the most vulnerable. This is because their bodies are less able to regulate their temperature.
The authors use gridded demographic data to determine the age structure of each country. From this, they calculate how many people from each age cohort are exposed to extra heat days as a result of climate change.
The research finds that globally, 583 million children under the age of 10 already live through at least 20 attributable heat days every year. This accounts for 44% of all children in this age bracket.
In comparison, 190 million people aged 60-69 face at least 20 attributable heat days per year, accounting for 30% of this age cohort.
The authors find that children face the greatest exposure to humid heat for two main reasons.
First, there are more young people alive today than older people, with 1.3 billion children aged under 10 in the world, compared to 0.6 billion people aged 60-69.
Second, they find that countries in Africa and Asia typically have rapidly growing populations with more young children. In contrast, many countries in the northern hemisphere – which are typically cooler – have older populations.
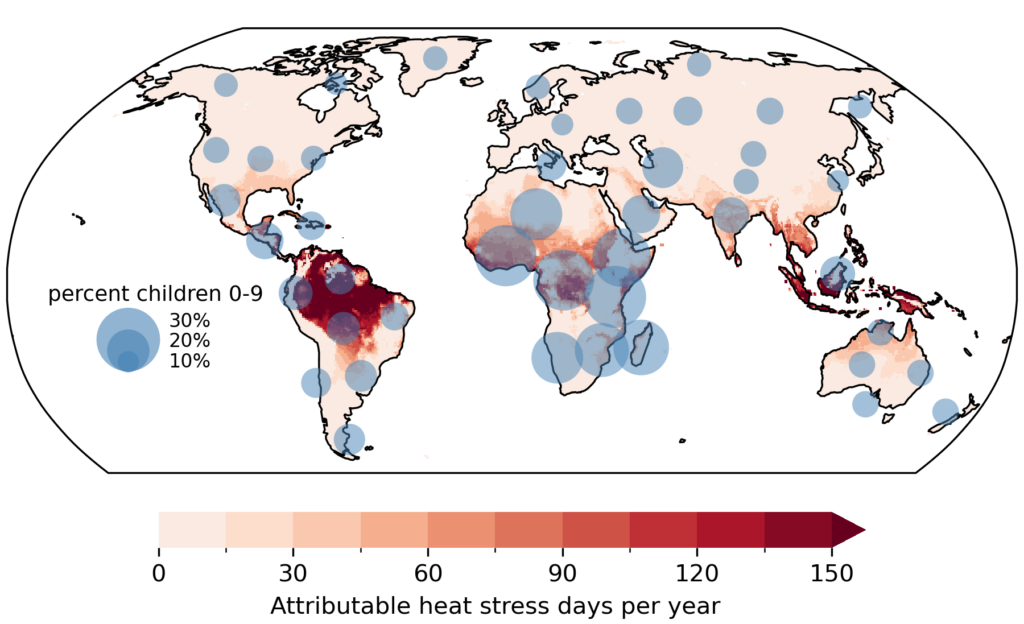
The map below shows how many extra stress heat days each country currently faces as a result of human-caused climate change. Darker reds indicate a higher number of attributable heat days. The blue circles show the percentage of the population under the age of 10, with larger circles indicating a higher percentage.
Warming world
The authors also repeat their analysis for a 1.5C and 2C warmer world. They use population estimates from the SSP2 scenario, which projects that the world’s population will peak at more than nine billion in the second half of the 21st century, with most growth occurring in low-latitude regions – especially in sub-Saharan Africa.
The research finds that, in today’s climate, 11% of all under 10s currently experience 100 or more extra heat-stress days per year due to climate change. In worlds warmed by 1.5C and 2C, the percentage rises to 13% and 23%, respectively.
In contrast, only 6% of all people aged 60-69 currently face 100 or more extra heat-stress days each year due to climate change. This number rises to 9% and 17% for 1.5C and 2C worlds, respectively.
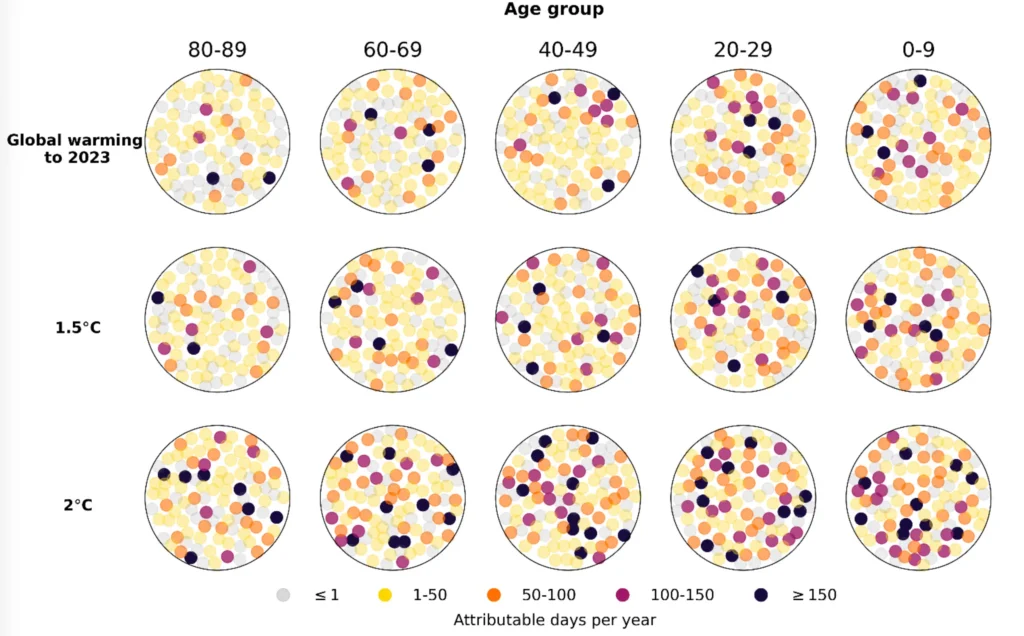
These results are shown in the plot below. The three rows represent the climates of 2023 (top), a 1.5C world (middle) and a 2C world (bottom). The columns show different age cohorts, from the oldest on the left to the youngest on the right.
Each circle contains 100 coloured dots, with each dot representing 1% of the age cohort.
The colour of the dot represents exposure to annual heat-stress day, with darker dots indicating more heat-stress days. Grey dots mean that people experience fewer than one extra heat-stress day per year due to human-caused climate change, while black dots mean more than 150 extra heat-stress days due to climate change.
The figure shows that higher warming levels expose more people to heat stress and that younger cohorts tend to be worst affected.
For example, the top-right circle represents heat stress for under 10s in the present-day climate. Three of these dots are coloured black, indicating that 3% faced at least 150 attributable heat-stress days in 2023.
Pietroiusti tells Carbon Brief the study uses wet-bulb temperature because it is a “well-established heat stress metric”. However, she notes that it was not “explicitly defined to focus on children”. She continues:
“A really important step forward in the research community would be to link up climate science and health science experts to do research on what metrics are really most representative of, for example, health impacts and educational impacts that children will be suffering.”
Vulnerability
Dr Qinqin Kong, a postdoctoral researcher at the departments of medicine and health policy at Stanford University, who was not involved in the study, praises its “robust” methodology.
He tells Carbon Brief that the research provides “a timely quantitative evidence for discussions of climate justice, children’s rights and intergenerational equity”.
However, Kong suggests that the paper “may overstate the contrast between children and the elderly and underestimate the relative burden of older adults”.
He says:
“The elderly may also be more vulnerable due to their social circumstances. Children often benefit from parental supervision and caregiving, whereas many older adults live alone, have limited mobility and face barriers to accessing cooling or emergency assistance during heat events.”
Kong also notes that “people and societies in the mid-latitudes [for example, across much of Europe and North America] are less adapted to heat”, which may make them vulnerable to its impacts.
For example, he says that Europe “shows substantially stronger relative risk of heat mortality likely due to less heat-acclimatised populations, lower air conditioning prevalence and urban designs that don’t favour heat dissipation”.
Similarly, Dr Daniel Vecellio – a researcher at the University of Nebraska, who was not involved in the study – tells Carbon Brief that children are an “understudied cohort”.
However, he says there is “reason for hope” because “children are typically pretty good behavioural adapters to extreme heat” and because people who are “chronically exposed to extreme heat” will “have a better chance at better acclimatisation”.
Pietroiusti tells Carbon Brief that global reporting on heatwaves is often skewed towards wealthier nations.
For example, she notes that large-scale databases of disasters, such as EM-DAT, often underrepresent heatwaves in Africa, due in part to a lack of news coverage and formal reporting. She adds:
“Studies like this, which start from the climate data, can start to fill some of these gaps.”
She adds that the paper should inform discussions about climate justice, noting that children in developing countries, who are most severely affected by the increase in heat-stress days, “have contributed the least to historical greenhouse gas emissions”.
Pietroiusti, R. et al. (2026) Age-specific exposure to human-induced increases in humid heat, Science Advances, doi:10.1126/sciadv.aeb3232


The post Climate change exposes 580 million children to 20 extra ‘heat-stress days’ every year appeared first on Carbon Brief.
Climate change exposes 580 million children to 20 extra ‘heat-stress days’ every year



-
Climate Change1 year ago
Guest post: Why China is still building new coal – and when it might stop
-
Greenhouse Gases1 year ago
Guest post: Why China is still building new coal – and when it might stop
-

 Greenhouse Gases2 years ago
嘉宾来稿:满足中国增长的用电需求 光伏加储能“比新建煤电更实惠”
-

 Climate Change2 years ago
嘉宾来稿:满足中国增长的用电需求 光伏加储能“比新建煤电更实惠”
-
Climate Change2 years ago
Bill Discounting Climate Change in Florida’s Energy Policy Awaits DeSantis’ Approval
-

 Renewable Energy10 months ago
Sending Progressive Philanthropist George Soros to Prison?
-
Greenhouse Gases1 year ago
嘉宾来稿:探究火山喷发如何影响气候预测
-

 Carbon Footprint2 years ago
US SEC’s Climate Disclosure Rules Spur Renewed Interest in Carbon Credits