

Greenland is closing in on three decades of continuous annual ice loss, with 1995-96 being the last year in which the giant ice sheet grew in size.
With another melt season over, Greenland lost 105bn tonnes of ice in 2024-25.
The past year has seen some notable events, including ongoing ice melt into the month of September – well beyond the end of August when Greenland’s short summer typically draws to a close.
In a hypothetical world not impacted by human-caused climate change, ice melt in Greenland would rarely occur in September – and, if it did, it would generally be confined to the south.
In this article, we explore how Greenland’s ice sheets fared over the 12 months to August 2025, including the evidence that the territory’s summer melting season is lengthening.
(For our previous analyses of Greenland’s ice cover, see coverage in 2024, 2023, 2022, 2021, 2020, 2019, 2018, 2017, 2016 and 2015.)
Surface mass balance
The seasons in Greenland are overwhelmingly dominated by winter.
The bitterly cold, dark winter lasts up to ten months, depending on where you are. In contrast, the summer period is generally rather short, starting in late May in southern Greenland and in June in the north, before ending in late August.
Greenland’s annual ice cycle is typically measured from 1 September through to the end of August.
This is because the ice sheet largely gains snow on the surface from September, accumulating ice through autumn, winter and into spring.
Then, as temperatures increase, the ice sheet begins to lose more ice through surface melt than it gains from snowfall, generally from mid-June. The melt season usually continues until the middle or end of August.
Over this 12-month period, scientists track the “surface mass balance” (SMB) of the ice sheet. This is the balance between ice gains and losses at the surface.
To calculate ice gain and losses, scientists use data collected by high-resolution regional climate models and Sentinel satellites.
The SMB does not consider all ice losses from Greenland – we will come to that later – but instead provides a gauge of changes at the surface of the ice sheet.
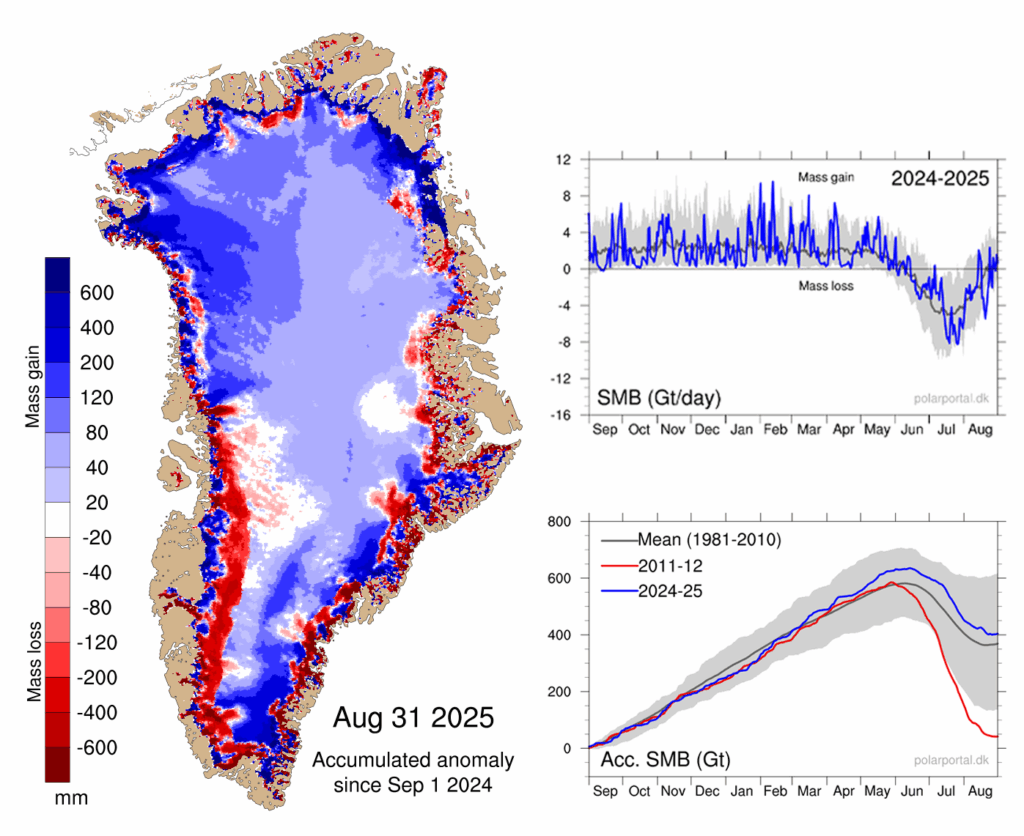
According to our calculations, Greenland ended the year 2024-25 with an overall SMB of about 404bn tonnes. This is the 15th highest SMB in a dataset that goes back 45 years, exceeding the 1981-2010 average by roughly 70bn tonnes.
This year’s SMB is illustrated in the maps and charts below, based on data from the Polar Portal.
The blue line in the upper chart shows the day-to-day SMB. Large snowfall events become visible as “spikes”. The blue line in the lower chart depicts the accumulated SMB since 1 September 2024. In grey, the long-term average and its variability are shown. For comparison, the red line shows the record-low year of 2011-12.
The map shows the geographic spread of SMB gains (blue) and losses (red) for 2024-25, compared to the long-term average.
It illustrates that southern and north-western Greenland had a relatively wet year compared to the long-term average, while there was mass loss along large sections of the coast, in particular in the south-west. The spikes of snow and melt are clearly visible in the graphs on the right.
Lengthening summer
Scientists have traditionally pinned the start of the “mass balance year” in Greenland to 1 September, given that this is when the ice sheet typically starts to gain mass.
However, evidence has started to emerge of a lengthening of the summer season in Greenland – as predicted some time ago by climate models.
The start of the 2024-25 mass balance year in Greenland saw ice melt continuing into September. This included a particularly unusual spike in ice melt in the northern part of the territory in September as well as all down the west coast.
In a world without human-caused climate change, ice melt in September would be very rare – and generally confined to the south.
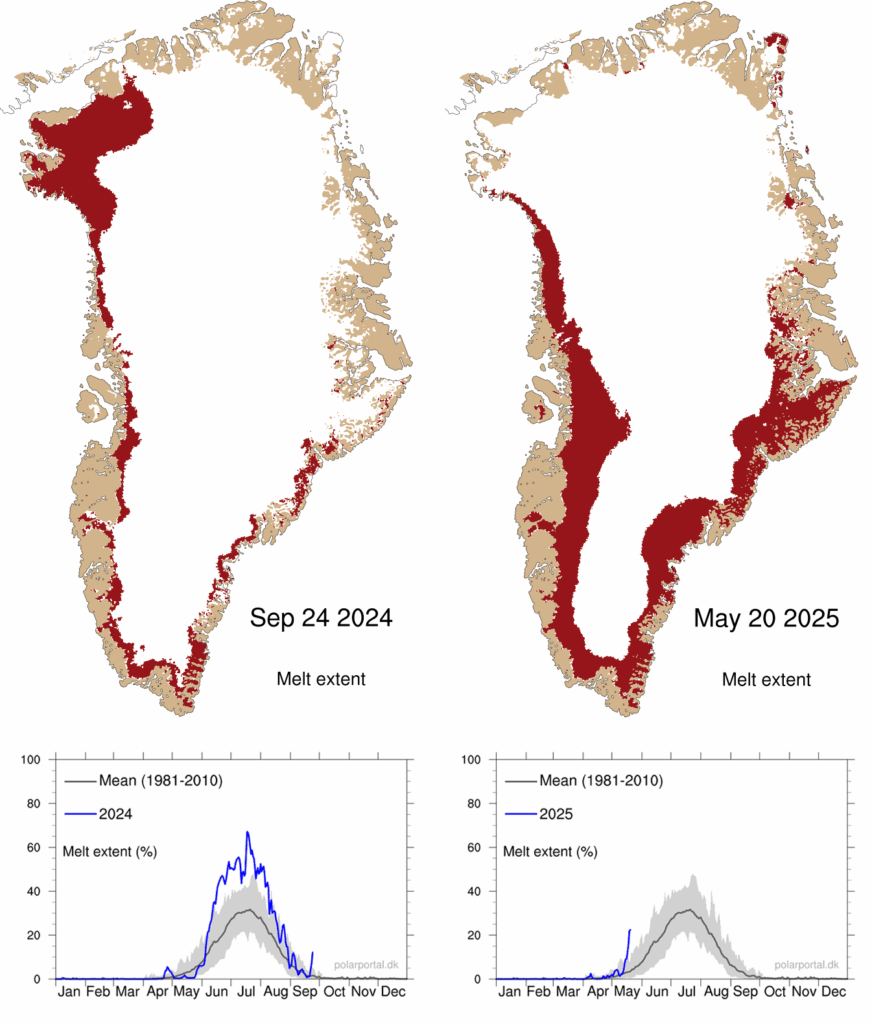
Greenland also saw an early start to the summer melt season in 2025. The onset of the melting season, defined as the first of at least three days in a row with melting over more than 5% of the ice sheet, was on 14 May. This is 12 days earlier than the 1981-2025 average.
The maps below show the extent of melt (red shading) across the ice sheet on 24 September 2024 (left) and 20 May 2025 (right). The blue lines in charts beneath show the percentage melt in 2024 (left) and 2025 (right), up to these dates, compared to the 1981-2010 average (grey).
The melt season began with a significant spike of melting across the southern part of the ice sheet. This happened in combination with sea ice breaking up particularly early in north-west Greenland, allowing the traditional narwhal hunt to start much earlier than usual.
Surface melt
The ablation season, which covers the period in the year when Greenland is losing ice, started a little late. The onset of the season – defined as the first of at least three days in a row with an SMB below -1bn tonnes – began on 15 June, which is two days later than the 1981-2010 average.
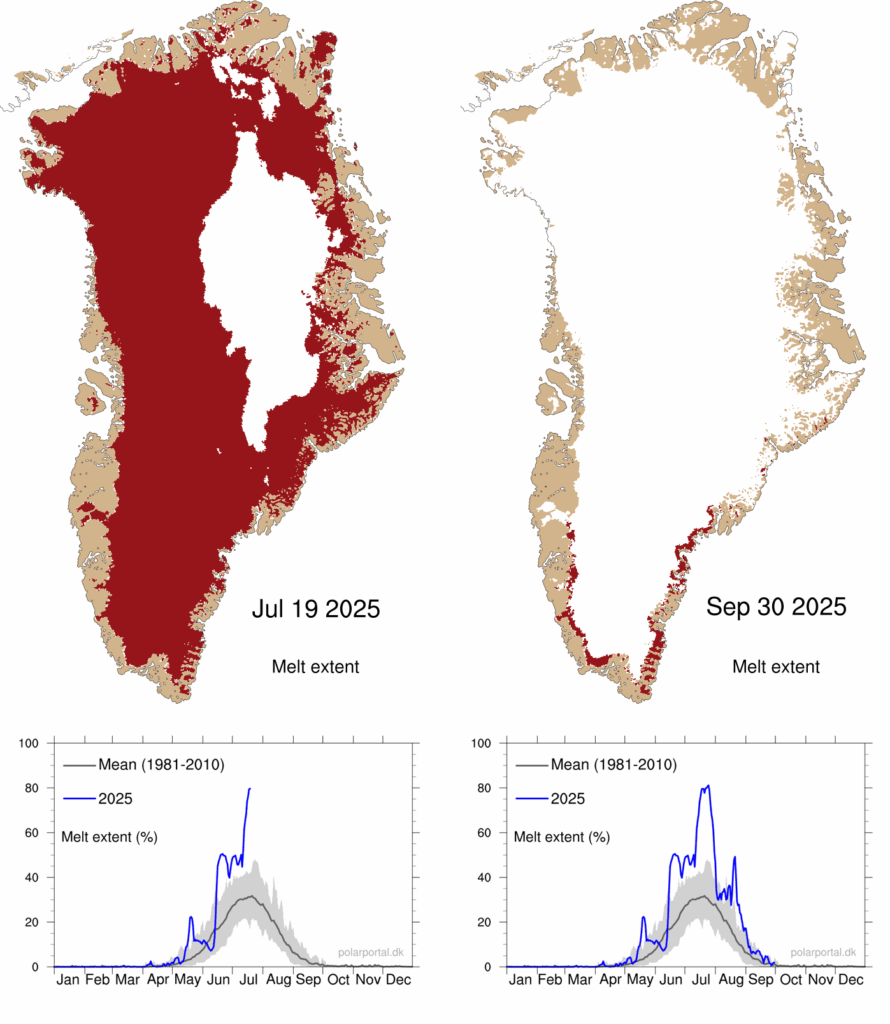
Overall, during the 2025 summer, a remarkably large percentage of the ice sheet was melting at once. This area was larger than the 1981-2010 average for three and a half months (mid-June to end of September).
In mid-July, melting occurred over a record area. For three days in a row, melting was present over more than 80% of the area of the ice sheet – peaking at 81.2%. This is the highest value in our dataset, which started in 1981.
The red shading in the maps below shows the extent of melting across Greenland on 19 July (left) and 30 September (right) 2025. The charts beneath show the daily extent of melting through 2025 (blue line), up to these dates, compared to the 1981-2010 average.
Snowfall
However, the SMB is not just about ice melt.
There was a lack of snowfall in the early winter months (September to January), particularly in south-east Greenland, which is typically the wettest part of the territory. The months that followed then saw abundant snow, which brought snowfall totals up closer to average by the start of summer.
A cold period at the end of May and in June protected the ice sheet from excessive ice loss. Melt then continued rather weakly until mid-July.
This was followed by strong melting rates in the second half of July and again in mid-August.
Overall, with both ice melt and snowfall exceeding their historical averages for the year as a whole, the SMB of the Greenland ice sheet ended above the 1981-2010 average.
These increases in snowfall and melt are in line with what scientists expect in a warming climate. This is because air holds more water vapour as it warms – leading to more snowfall and rain. Warmer temperatures also lead to more ice melt.
Total mass balance
The surface mass balance is just one component of the “total” mass balance (TMB) of the Greenland ice sheet.
The total mass balance of Greenland is the sum of the SMB, the marine mass balance (MMB) and basal mass balance (BMB). In other words, it brings together calculations from the surface, sides and base of the ice sheet.
The MMB measures the impact of the breaking off – or “calving” – of icebergs, as well as the melting of the front of glaciers where they meet the warm sea water. The MMB is always negative and has increased towards more negative values over the last decades.
BMB refers to ice losses from the base of the ice sheet. This makes a small negative contribution to the TMB.
(The only way for the ice sheet to gain mass is through snowfall.)
The continued mass loss observed in Greenland is primarily due to a weakening of the SMB – caused by rising melt combined with insufficient compensation of lost ice through snowfall.
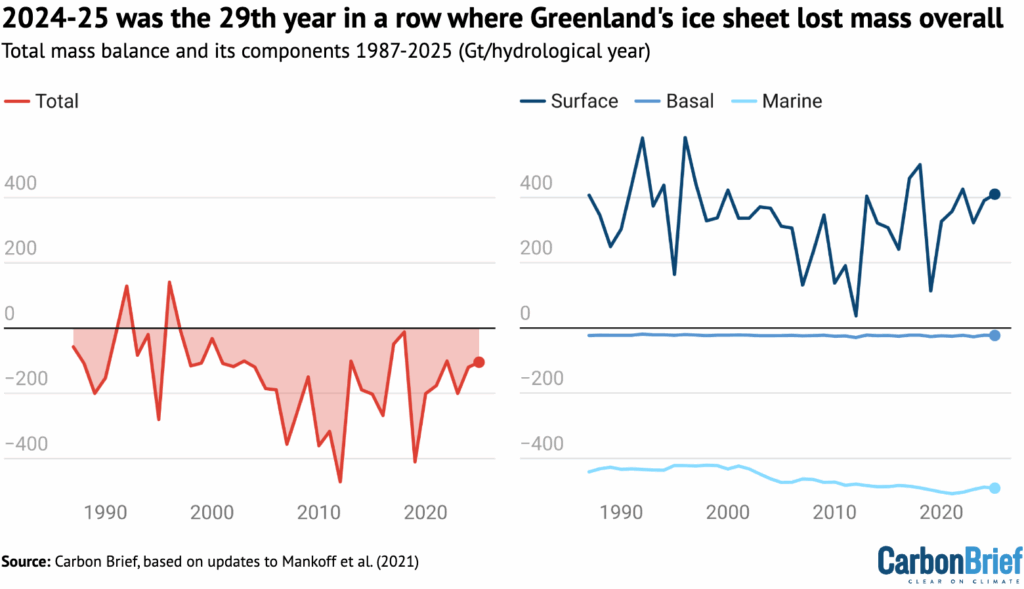
The figure below shows how much ice the Greenland ice sheet has lost (red) going back to 1987, which includes the SMB (dark blue), MMB (mid blue) and BMB (light blue). The analysis, which uses data from three models, is based on 2021 research published in Earth System Science.
Despite a relatively high SMB, high calving rates meant that Greenland lost 105bn tonnes of ice over the 12-month period.
This means that 2024-25 was the 29th year in a row with a Greenland ice sheet overall mass loss. As the chart shows, Greenland last saw an annual net gain of ice in 1996.
Satellite data
The mass balance of the Greenland ice sheet can also be measured by looking at the Earth’s gravitational field, using data captured by the Grace and Grace-FO satellite missions – a joint initiative from NASA and the German Aerospace Center.
The Grace satellites are twin satellites that follow each other closely at a distance of about 220km, which is why they are nicknamed “Tom and Jerry”. The distance between the two depends on gravity – which is, in turn, related to changes in mass on Earth, including ice loss.
Therefore, the distance between the two satellites, which can be measured very precisely, can be used to calculate loss of mass from the Greenland ice sheet.
Overall, the satellite data reveals that Greenland’s ice sheet lost around 55bn tonnes of ice over the 2024-25 season.
There is reasonably good agreement between the Grace satellite data and the model data, which, as noted above, finds that 105bn tonnes of ice was lost in Greenland over the same period.
However, the alignment of the two datasets – which are fully independent of each other – becomes more clear once a longer time period is considered.
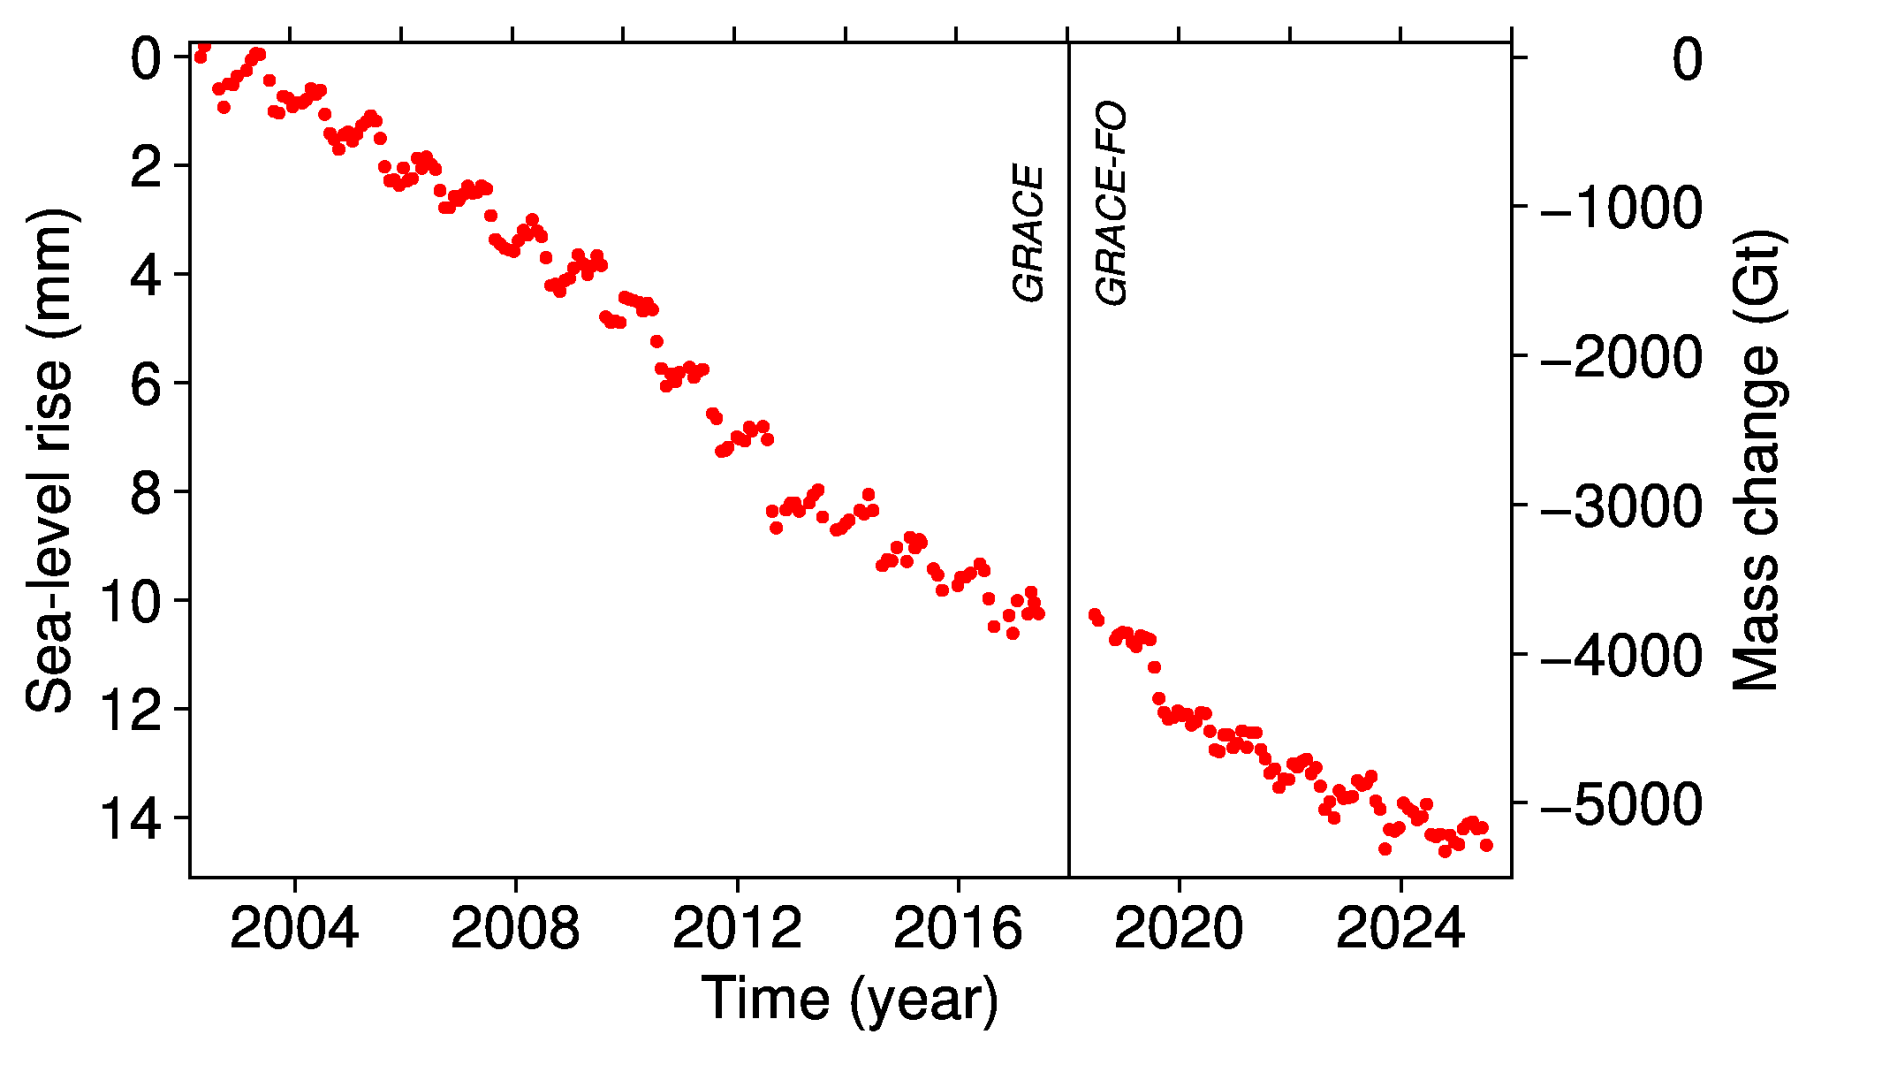
In the 22-year period between April 2002 and May 2024, the Grace data shows that Greenland lost 4,911bn tonnes of ice. The modelling approach, on the other hand, calculates that 4,766bn tonnes of ice was lost.
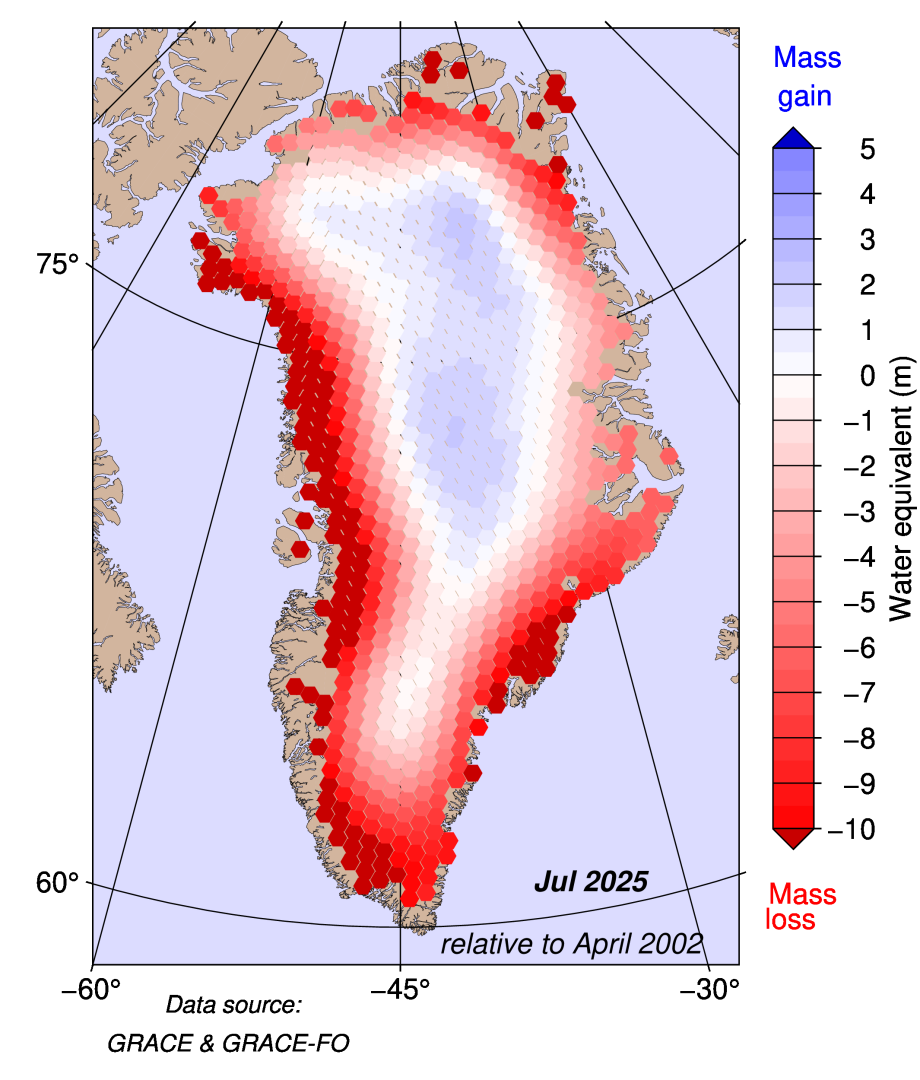
The figure below shows gain and loss in the total mass of ice of the Greenland ice sheet, calculated using Grace satellite measurements. It reveals that, over the past 23 years, there has been mass loss in the order of several metres along the coasts of Greenland, with the most significant losses seen on the western coast. Over the central parts of the ice sheet, there has been a small mass gain.
The lower figure shows the contribution of Greenland mass change to sea level rise over the last 23 years, according to the satellite data. It illustrates that more than 5,000bn tonnes of ice have been lost over the time period – contributing to roughly 1.5cm of sea level rise.
Warm over Europe and North America, cool over Greenland
As always, the weather systems across the northern hemisphere play a key role in the melt and snowfall that Greenland sees each year.
As in previous years, multiple heatwaves were observed in southern Europe and North America over the summer of 2025.
And, just like in 2024, there was only modest heat in northern Europe – with the notable exception of Arctic Scandinavia – with a comparably cool and rainy July followed by a warmer and sunnier August.
The high-pressure weather systems that bring heatwaves have a wide-ranging impact on weather extremes across the northern hemisphere.
Strong blocking patterns over North America and Europe were repeatedly present in the course of the summer of 2025. In such a blocked flow, the jet stream – fast-moving winds that blow from west to east high in the atmosphere – is shaped like the Greek capital letter Omega (Ω).
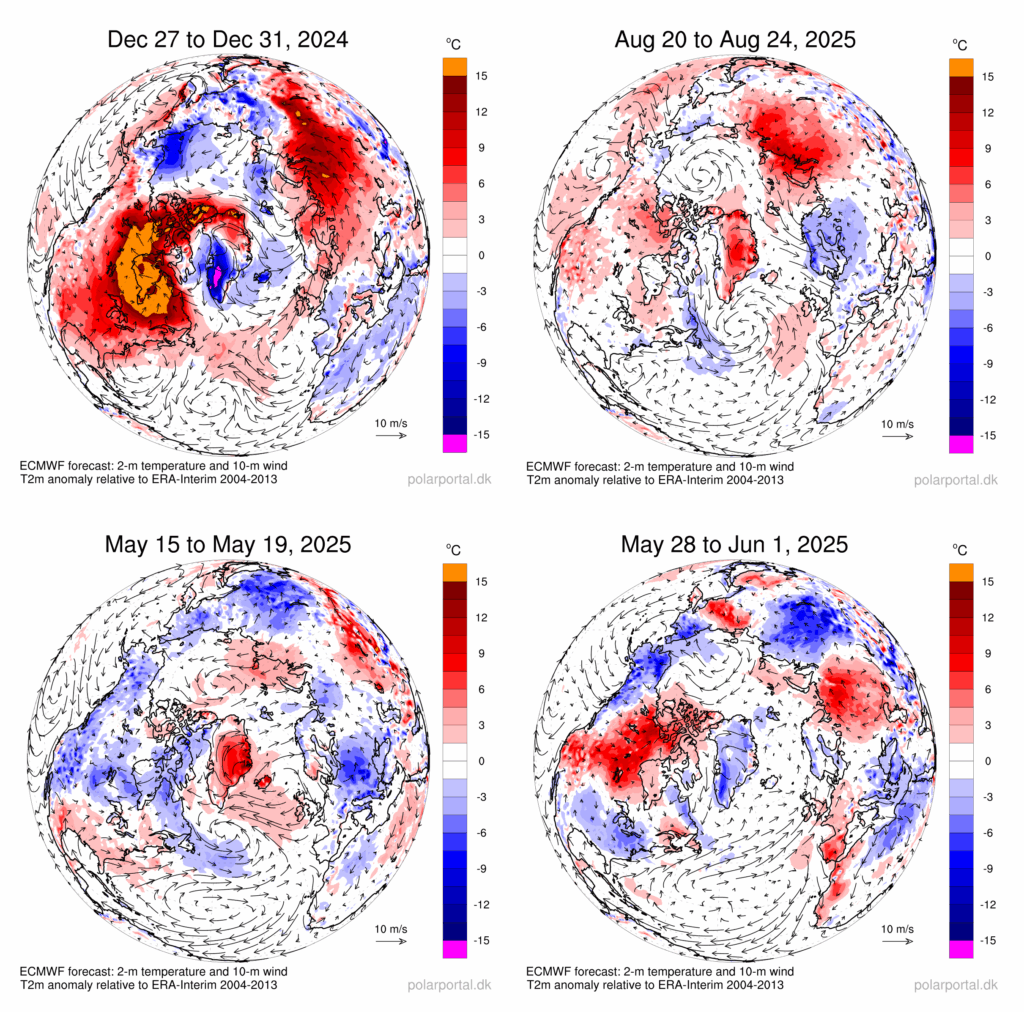
The jet stream bulged up to the north over Canada and northern Europe. West and east of these ridges, low pressure troughs were found at both “feet” of the Omega. One of these troughs was located over Greenland (top left panel in next figure).
This resulted in widespread heat near the cores of these high-pressure systems, fuelling fires in several countries, including large wildfires in Canada. Smoke from these wildfires reached Greenland and Europe in late May.
Unlike in previous years, no heavy precipitation events were observed near the “feet” of the Omega.
If the Omega pattern is displaced by half a wavelength, the opposite – warm over Greenland, with cool continents – is also possible.
This circulation pattern occurred in August 2025 and is shown in the top right panel of the figure below. The bottom panel depicts the large temperature variability in May 2025.




The post Guest post: How the Greenland ice sheet fared in 2025 appeared first on Carbon Brief.

What a week! Our Pacific team is back from Palau and the 55th Pacific Islands Forum Leaders Meeting, and preparing for the next big moment in our campaign for Pacific climate justice — the Pacific Pre-COP.
So grab a cuppa as we take stock of what unfolded in Palau and what it means for the voyage ahead.
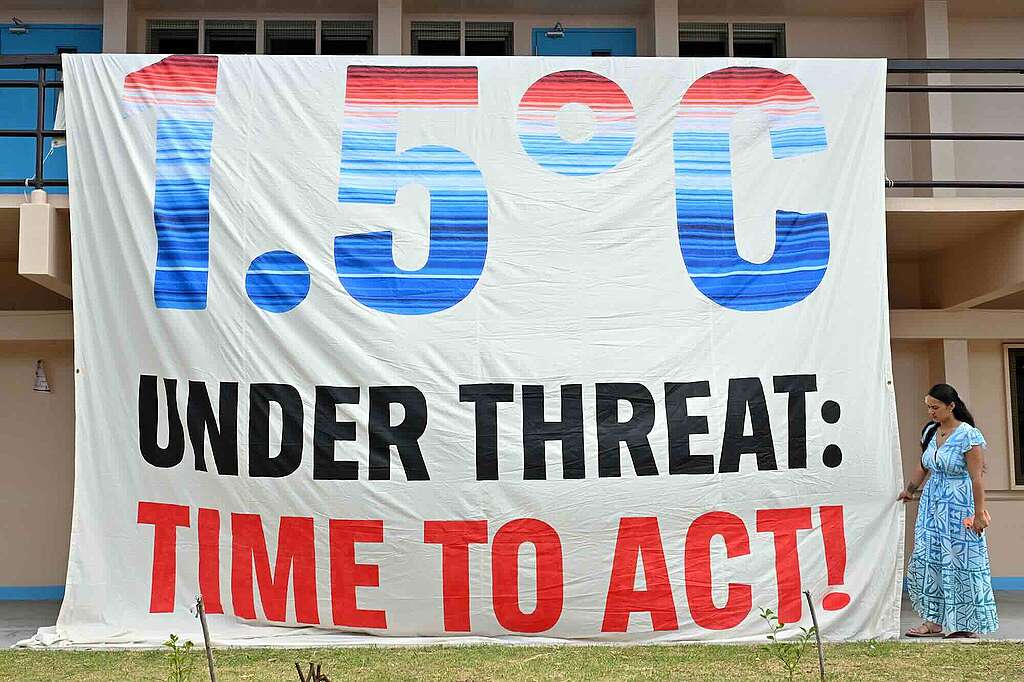
Keeping 1.5°C Alive
Immediately before leaders sat down for their negotiations, the UN Environment Program dropped a bombshell report confirming the world is set to overshoot the all-important goal of limiting warming to 1.5°C.
Limiting warming to 1.5°C is a non-negotiable survival line for Pacific communities. Every year above 1.5°C will increase irreversible harms to communities in the Pacific and around the world. The task now is to minimise the magnitude and duration of any temperature overshoot, and to return warming to 1.5°C as soon as possible.
The good news — there is a path back to 1.5°C. But it’s going to demand the very best of humanity, and all of us working together.
As a person from the Pacific, I know our communities will not quietly accept these dire warnings of climate overshoot as our fate; we are already living and fiercely resisting this reality every single day. With every increment of warming, our lands, our livelihoods, and our island homes are threatened, but the Pacific’s resolve only grows stronger.
Shiva Gounden, Head of Pacific, responds to the UNEP Limiting Overshoot report
Australia, get it together
In just two months, Australia will be chairing the world’s global climate negotiations — a role it has pledged to undertake in meaningful partnership with the Pacific. It’s a major responsibility, at a critical moment in the world’s response to the climate and energy crisis, and one that requires a focussed, all-of-government effort from Australia.
So you can imagine our shock at the start of the week, as images appeared of Australian Minister for Resources Madeleine King celebrating the first extraction of gas from the giant Beetaloo Basin, alongside Chief Minister of the Northern Territory Lia Finocchiaro. Needless to say, the image of the two leaders laughing as they turned on Australia’s largest gas tap, amid the still unfolding flood disaster in Nepal-Tibet, will not age well. Skip to Thursday, and the news came that the Australian Government had approved an expansion of one of Queensland’s largest coal mines. This was the 37th new, expanded or extended fossil fuel project approved by the Albanese Government since it was elected, and the second year in a row that Australia has approved a major fossil fuel expansion during the Pacific Islands Forum.
This is not the allyship that the Pacific has been promised from Australia, the largest member of the Forum, or the leadership the world needs. Expanding fossil fuel production is utterly incompatible with our moral, legal and scientific imperative to limit warming to 1.5°C.
Australia is not doing enough. Australia is a major producer of fossil fuels. We all know fossil fuels are the primary driver of the climate crisis. The very least a country like Australia should be doing is stopping future expansion, and it’s not doing that.
Ralph Regenvanu, Minister for Climate Change, Vanuatu
@greenpeaceap 1.5°C has never been just a number for the Pacific. It is our homes, ocean, cultures, people and our future at stake. Greenpeace is on the ground at the Pacific Islands Forum leaders’ meeting in Palau and we have a message of determination and a call for united, urgent and immediate action. Every fraction of a degree matters. This is not the moment to give up on 1.5°C. The pathway back cannot be paved with more fossil fuels. We need all hands, all heart, all minds, in this fight together


We need all hands, all heart, all minds, in this fight together
Moemoana Schwenke, Pacific Climate Campaigner
Powering up the Blue Pacific
On the bright side, the week helped bring the vision of a Fossil Fuel Free Pacific one step closer to reality.
Nowhere on Earth are the perils of fossil fuel dependence and the opportunities of renewable energy clearer than in the Pacific, where countries currently spend up to 25% of GDP on fuel imports, and renewables truly are the path to greater energy security, affordability and sovereignty.
Tuesday saw the launch of a 100% Renewable Blue Pacific Investment Prospectus, designed to attract more than $2 billion in investment to advance the vision of a Fossil Fuel Free Pacific.
Protecting our oceans
While sometimes called ‘small island states’ owing to their small land area and population, Pacific island countries are far better understood as ‘large ocean states’. If you were to divide Tuvalu’s ocean area by its population, you’d find that Tuvaluans are responsible for around 250x more ocean per person than Australians.
Pacific islanders are the world’s ocean protectors, and right now are in a fight to protect the ocean floor from deep sea mining. This year our team, led by Rae Bainteiti, hosted a moving talanoa on deep sea mining, with diverse perspectives grounded in Pacific values.
Greenpeace has been working hard to encourage more Pacific governments to join the call for a moratorium on deep sea mining, so that this destructive new industry can be stopped before it gets fully underway.

The voyage ahead
Earlier this week, a large crowd of Greenpeace staff and volunteers gathered on the dock to bid fair winds to our campaign ship Oceania as she set sail for Fiji and next month’s Pacific Pre-COP.
Hot on the heels of the Pacific Islands Forum, the Pacific Pre-COP is the next crucial moment in our voyage towards the year’s global climate negotiations (COP31) in Antalya. It is a unique opportunity to amplify Pacific leadership, and to ensure that the core priorities of keeping 1.5°C alive, accelerating the transition away from fossil fuels, and ensuring communities can access the financial support they need, are high on the agenda for COP31.

Follow our journey, and check back here for more ways to join the movement for climate justice.
Extreme heat is one of the deadliest climate hazards, but no two heatwaves are the same.
Heat extremes that happen outside of the peak summer months are often more dangerous because they can catch people off guard.
Heatwaves that hit during the spring or the first heatwave of the summer are riskier because people’s bodies are not yet accustomed to the heat and cooling strategies, such as air conditioning or public cooling centres, might not be available.
On the other hand, heatwaves that happen in the autumn, after a long summer season of heat exposure, can place further strain on bodies and local infrastructure that are already under stress.
As the climate changes and global temperatures rise, research has shown that heatwaves are becoming more frequent, intense and lengthy.
Our study, published in AGU Advances, is the first to measure whether the timing of extreme heat during the calendar year is changing around the world.
We find that, in more than half of the world, extreme heat events are spreading into the “shoulder seasons”, but doing so unevenly – in other words, they tend to creep more into autumn or spring, depending on the location.
Defining heat seasons
Meteorological summer is often assumed to be the warmest three-month period of the year. It is simplistically defined as June to August in the northern hemisphere and December to February in the southern hemisphere.
However, extreme heat seasons vary from place to place and do not always neatly map on to these defined periods.
Our study, therefore, goes beyond traditional definitions of seasons and instead focuses on “local heat seasons”. We define these as the three consecutive months when extreme heat events happened most often in the 1980s.
From this starting point, our research looks at how extreme heat is creeping into the two-month periods before and after a local heat season. We call these periods “shoulder seasons”.
This flexible definition of heat and shoulder seasons allows us to measure how the timing of extreme heat has changed over time.
Specifically, we look at the percent of annual heat days that occurred in the heat season and shoulder seasons at each location on Earth and measure how those relative shares have shifted over the last 45 years.
For our analysis, we use climate data from 1980-2024 from the MERRA2 reanalysis dataset. To ensure our results were robust, we repeated the process using ERA5 reanalysis data.
We picked the 1980s as our baseline decade as it was the start of the common time period between the two reanalysis datasets. We compared this to climate data in the decade between 2015-24.
Comparing these two time periods – the opposite ends of our datasets – allowed us to register a larger magnitude change and account for cumulative effects of climate change.
We consider measures of both dry and humid heat, as each has distinct impacts. Dry heat tends to be more dangerous to plant and ecosystem health, while humid heat is more strenuous for humans.
We use the dry-bulb temperature and wet-bulb globe temperature as our measures of dry and humid heat, respectively.
Created in the 1950s by the US military, wet-bulb globe temperature has a long history as an international standard used for outdoor sports and occupational hazard monitoring. It combines measurements of temperature, humidity, wind speed and solar radiation.
Changing heat seasons
Our research finds that, in the 1980s, extreme heat around the world was closely confined to a single heat season. For example, some 93% of the world’s land area experienced more than 80% of extreme dry-heat days during its traditional dry-heat season.
Surprisingly, this was even true in the tropics, where there is much less of a seasonal swing in temperatures.
We also show that extreme dry- and humid-heat seasons are often different from one another, typically offset by one month. This is especially true in places influenced by monsoon systems, such as north-western Mexico and central India, where the extreme dry-heat season precedes the extreme humid-heat season.
But, the edges of these extreme heat seasons are starting to blur.
Extreme heat events are spreading out significantly in the calendar year in more than half of global land areas.
This extension of the extreme dry- and humid-heat seasons means that dangerous heat has started to creep into the shoulder seasons – but not equally so.
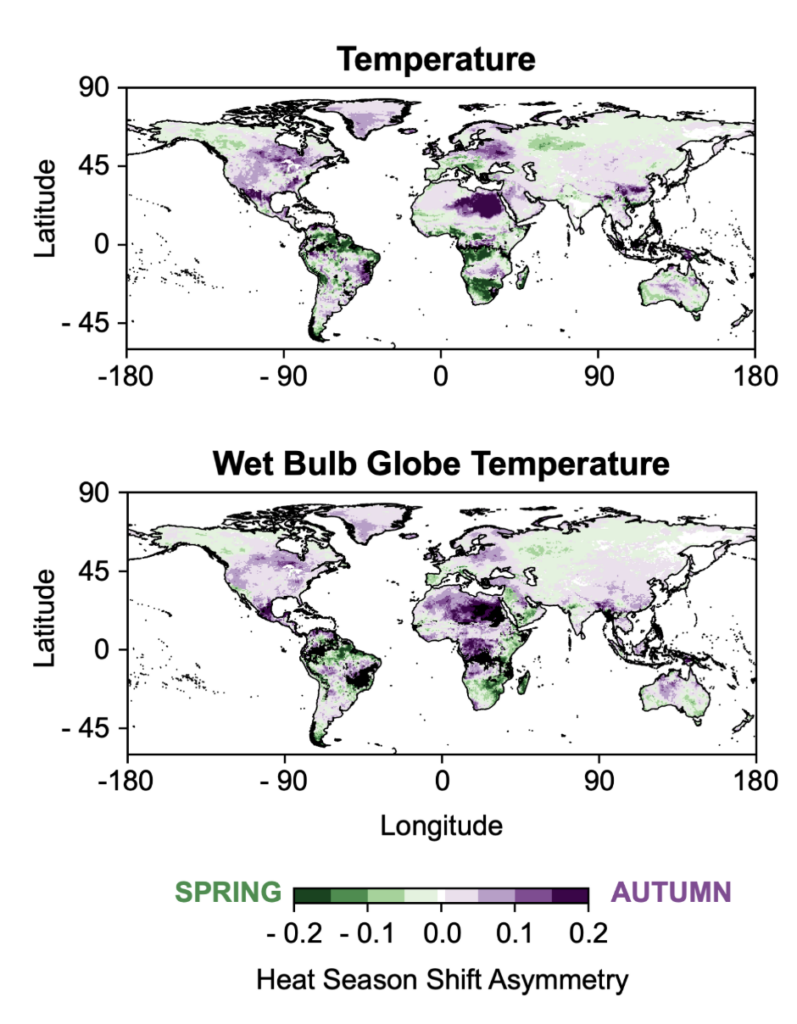
The maps below show how, in western Europe, southern Africa and north-western India, a larger fraction of each year’s extreme heat events are happening in the months before the historical dry- and humid-heat seasons. These regions are shaded in green.
On the other hand, in much of the US, eastern China, northern Africa and eastern Europe, extreme heat events are increasing in frequency in the months after the traditional heat seasons. These regions are shaded in purple.
Boosting existing seasons
It is possible that these observed changes have a straightforward – and somewhat simple – explanation.
In many regions, one shoulder season – spring or autumn – is warmer than the other. One hypothesis we explored was whether a simple step up in daily heat across the calendar year makes it more likely for extreme heat days to occur in one shoulder season over the other.
Our research shows that things are not so simple.
To investigate, we created a new, “synthetic” timeseries in order to identify the impact of annual average warming. To do this, we took the baseline 1980s timeseries and “shifted up” the data by the average change in local dry or humid heat between the first and last 10 years of our dataset (1980-89 compared to 2015-24).
We find that, in most locations, intensifying the baseline seasonality in a given location by warming evenly over the course of the year explains the changes in extreme heat timing within the traditional heat season.
However, annual average warming alone cannot explain the uneven changes in how extreme heat is occurring in the shoulder seasons.
As such, we conclude there must be other factors at play.
Long-term changes in seasonal precipitation and soil moisture – whether drying or moistening – could be contributing.
There could also be potential links to land-use changes, such as agricultural intensification or increased irrigation. Natural fluctuations in regional climates, caused by phenomena such as the Pacific Decadal Oscillation and Atlantic Multidecadal Oscillation, could also be playing an important role.
To tease out the contributions of each of these drivers, scientists will need to conduct more regionally-focused studies.
Managing hazards
The expansion of extreme heat events into the shoulder seasons indicates that key protections, such as heat early warning systems and the establishment of cooling centres, may be needed outside the traditional summer months.
Further research is also required to look into whether the overlap of extreme heat with other seasonal hazards is increasing.
For example, we find that, throughout much of the US, there is a larger expansion of the heat season into the autumn than the spring. In the western US, extreme heat which stretches later into the year could increase the overlap between the extreme heat and wildfire seasons.
Meanwhile, a similar extension of the heat season into the autumn in the eastern US could increase the overlap between the extreme heat and Atlantic hurricane seasons.
Understanding how the intersection of these seasonal hazards is changing is essential for developing targeted climate adaptation strategies, given that multiple hazards happening at once or in quick succession are much more dangerous than when they happen in isolation.
Ivanovich, C. et al. (2026) Extreme dry- and humid-heat seasons are changing asymmetrically, AGU Advances, doi:10.1029/2026AV002516
related
Guest post: Why tough methane cuts are crucial for keeping warming ‘well-below’ 2C

Guest post: France’s June heatwave caused more than 2,700 heat-related deaths
Guest post: Climate change has caused one-fifth of Pine Island glacier retreat

Q&A: What change of power in Colombia could mean for world’s fossil-fuel transition
The post Guest post: How extreme heat is ‘creeping’ from summer into autumn and spring appeared first on Carbon Brief.
Guest post: How extreme heat is ‘creeping’ from summer into autumn and spring
The UK government has slashed its hopes for electric planes and “sustainable aviation fuels” (SAFs), ahead of giving the green light to a third runway at Heathrow.
An “ambitious” rollout of new technologies and efficiency upgrades will only cut flight emissions by a quarter over the next two decades, according to forecasts quietly released in June.
This would leave aviation emissions in 2050 nearly 50% higher than expected under the “jet-zero” strategy, launched by the previous Conservative government in 2022.
The Labour government has signalled its support for a contentious third runway at Heathrow airport, with a final planning decision expected by 2029.
Ministers have justified this expansion by citing the rollout of clean-aviation technologies.
Yet, the updated forecasts suggest that rising flight numbers and a reduced role for “techno-fixes” will leave aviation emissions stubbornly high in 2050 – the UK’s legal target for net-zero.
If this is to be compatible with UK climate goals, then these higher emissions from flights in 2050 would need to be taken out of the atmosphere using costly and largely unproven “carbon dioxide removal” technologies – or by planting gigantic new forests.
Emissions up
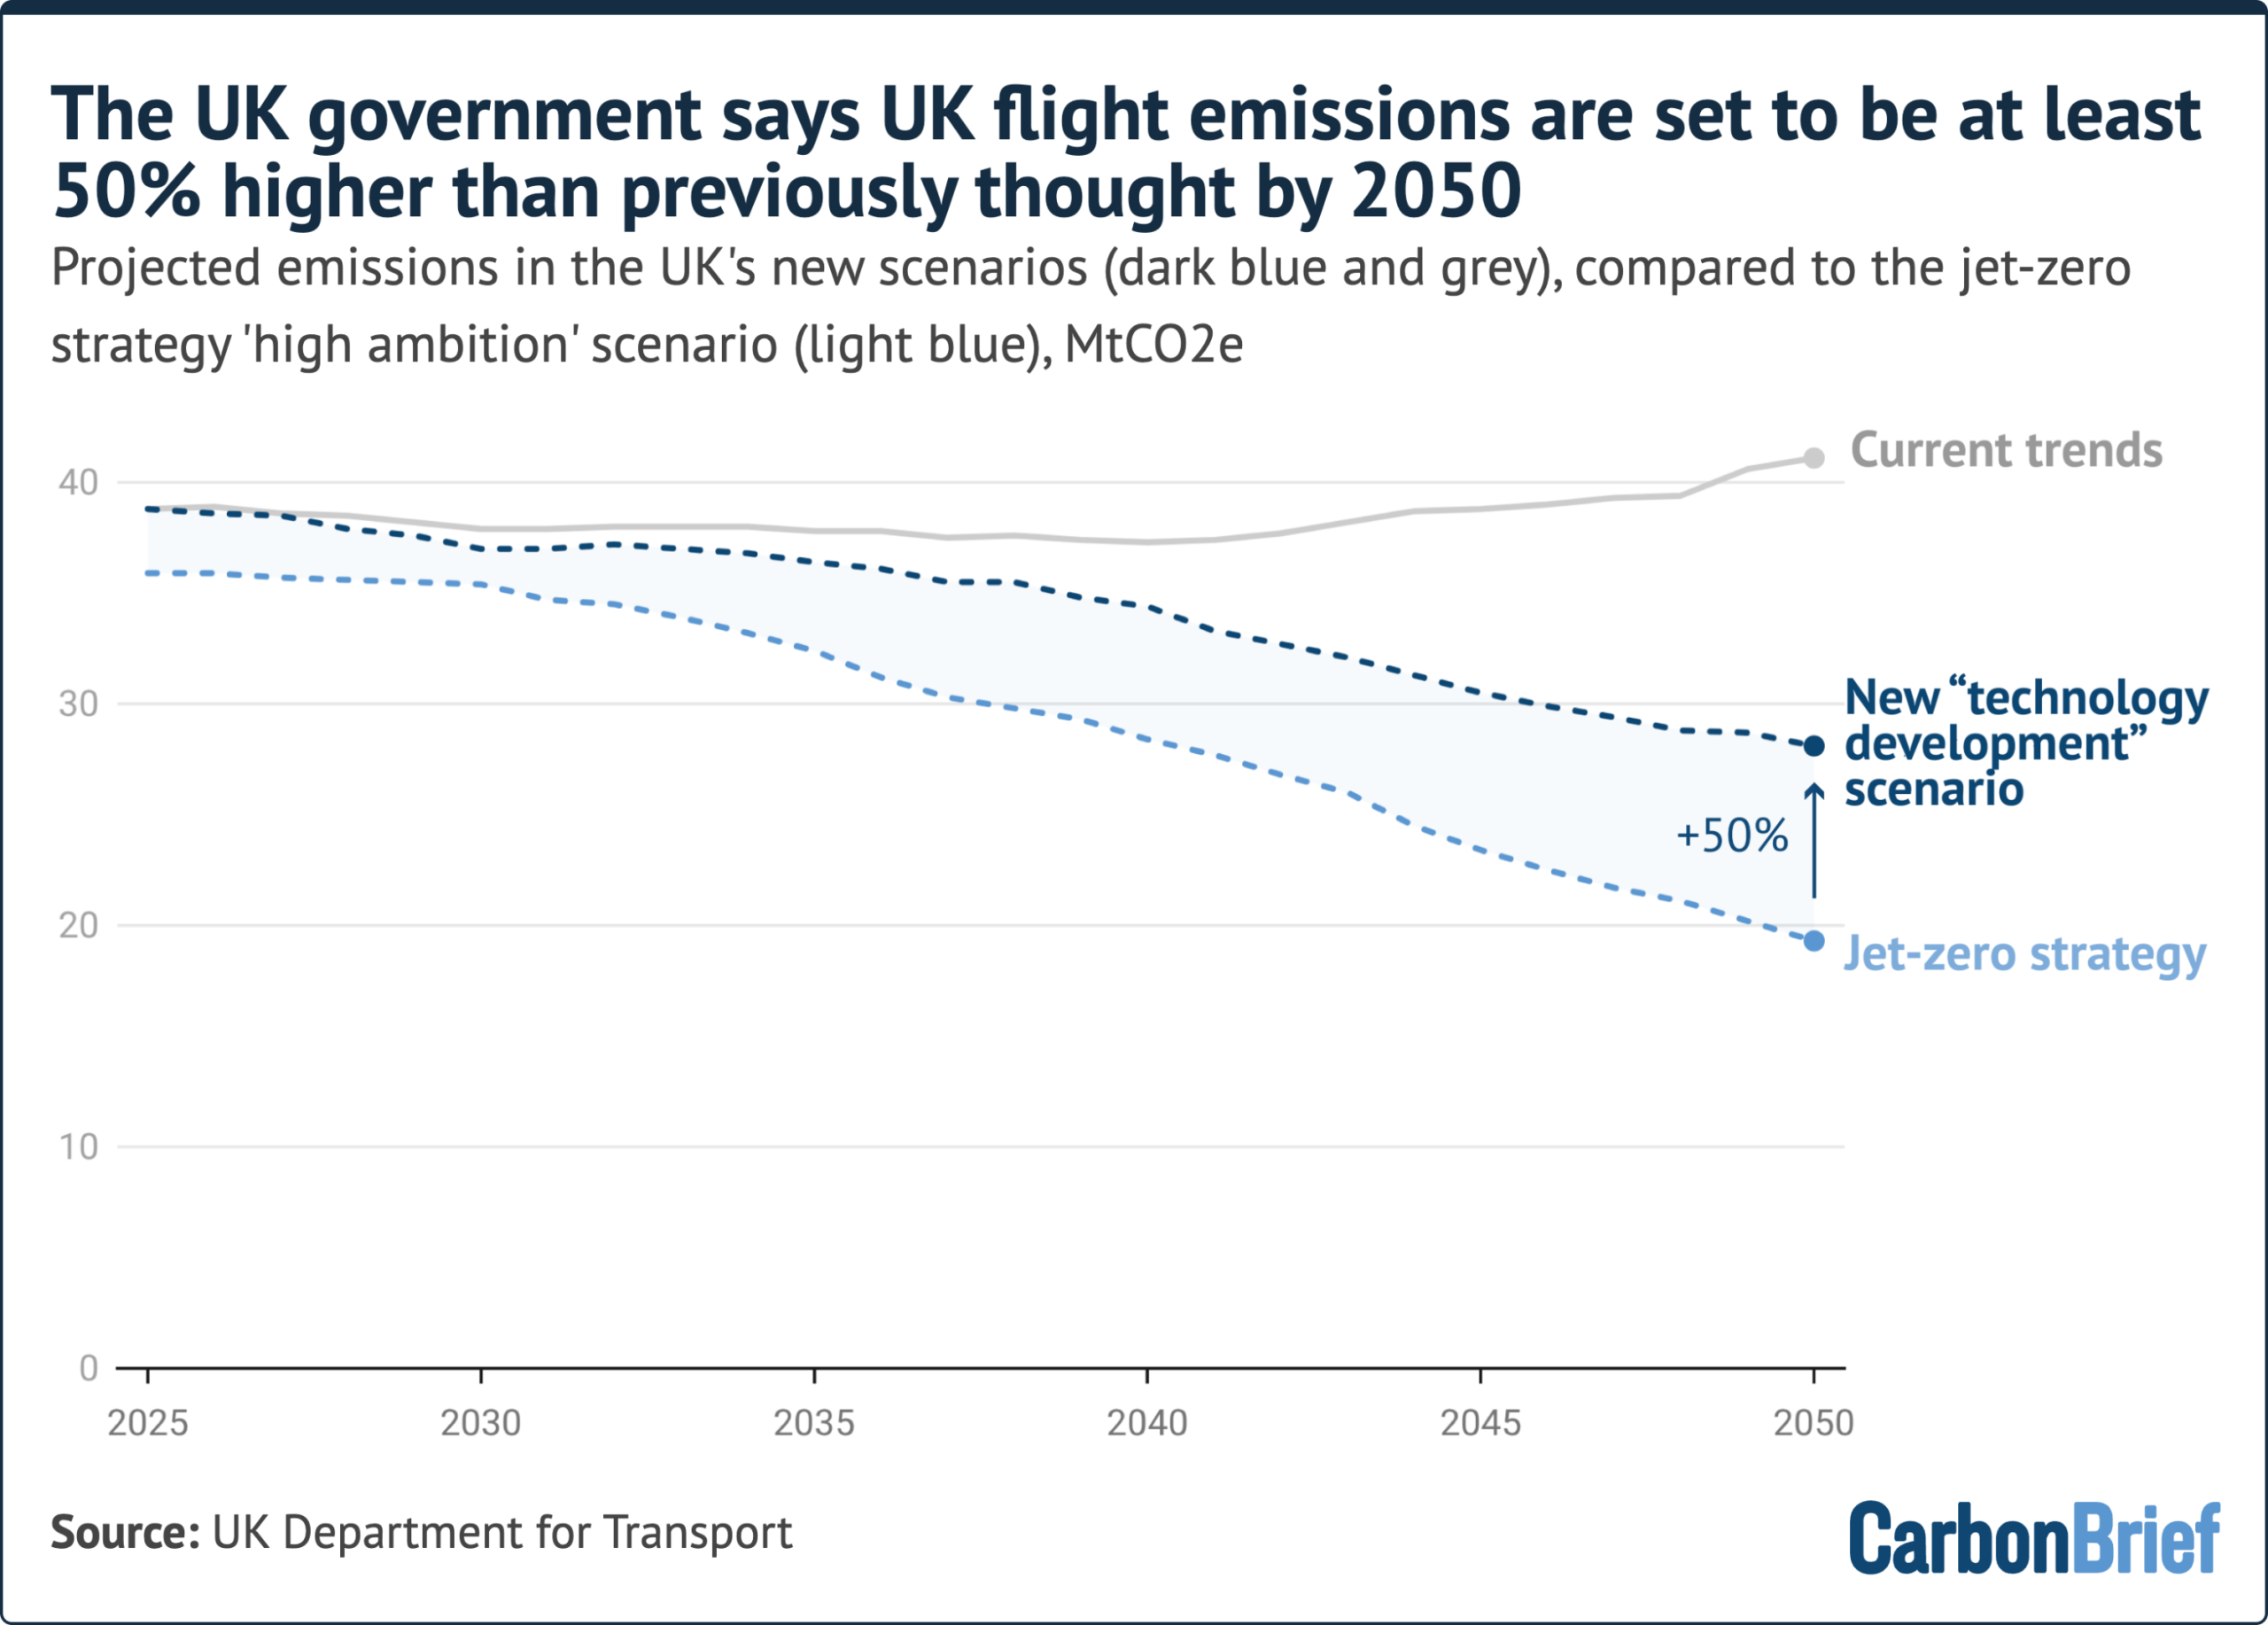
The previous government’s “jet-zero” strategy committed the UK to a “high ambition” pathway that would have seen aviation emissions peak at 38.2m tonnes of carbon dioxide equivalent (MtCO2e) in 2019 and drop to 19.3MtCO2e in 2050.
At the time, the Conservative government said this “clear goal” was achievable, alongside airport expansion and rising flight numbers.
Its strategy relied heavily on the extensive use of early-stage technologies, such as SAFs and battery-powered planes, as well as wider fuel-efficiency improvements.
In public statements, Labour has broadly continued this approach, backing new airport runways while supporting SAFs as a way to curb aviation emissions.
However, the government’s latest forecast, quietly published ahead of the formal approval of a new runway at Heathrow, sets far lower expectations for these technologies.
Its “technology development” pathway, with “ambitious carbon abatement measures”, only sees emissions drop to 28.1MtCO2e in 2050. As the chart below shows, this is around 9MtCO2e higher than the jet-zero strategy’s stated goal – a roughly 50% increase.
The shift is down to much lower expectations for SAF uptake, fuel-efficiency improvements and the roll-out of battery-powered planes, as well as lower international carbon prices.
The government now expects SAFs to make up 30% of aviation fuel by 2050, rather than 50%. It also concedes that SAFs will save less carbon over their lifecycle than previously thought.
SAFs have faced considerable criticism, due to limited supplies and uncertainty around the extent to which they cut emissions. Even meeting the UK’s relatively modest goal of 22% SAF uptake by 2040 would require enormous – potentially unattainable – volumes of waste products, which are currently the main source of the fuel.
For its new forecasts, the government commissioned a separate analysis of likely aircraft fuel-efficiency improvements over the next few decades. This analysis, from the Aviation Impact Accelerator, yielded “less optimistic” projections than earlier work.
Fuel-efficiency improvements have therefore been revised downward from 2% per year in the “jet-zero” strategy to 1.3% in the new “technology development” scenario.
There is also a reduced role for battery-powered planes, with only some of the smallest zero-emissions aircraft expected to be in use by 2035.
Crucially, even making the more limited emissions cuts in the new “technology development” pathway would require greater efforts to decarbonise the aviation sector.
If the UK fails to implement new policies or innovations, while flight numbers continue to rise, then aviation emissions would be even higher in 2050 than they are today.
This is illustrated by the pink “current trends” pathway in the chart above, in which emissions increase to 41.1MtCO2e by 2050.
This is roughly double the amount targeted by the jet-zero strategy and recommended by government climate advisors, the Climate Change Committee (CCC).
Budget ‘busting’
The new forecasts all account for the growth of several UK airports, including “planned Heathrow expansion”. Overall, passenger numbers would be at least 50% higher by 2050.
In contrast, the CCC and other experts have advised that the rise in passenger numbers may need to be limited, in order to keep emissions down.
In order to meet the UK’s net-zero target, any aviation emissions that remain in 2050 would need to be offset by planting many thousands of hectares of new forest, or by relying on costly and largely unproven CO2 removal technologies.
Tim Johnson, director at the Aviation Environment Federation (AEF), says the new forecasts present “a more honest and realistic vision of what’s possible in the next 24 years”. However, he tells Carbon Brief:
“Less reliance on cleaner technology and fuels reopens the debate about the role and scale of greenhouse gas removals and ways to tackle the projected 50% growth in demand for air travel.”
AEF calculations, based on government data and shared with Carbon Brief, suggest that emissions from the third runway at Heathrow would initially be relatively modest, reaching 3.5MtCO2e per year in 2050. Its emissions would then be expected to rise significantly beyond the legal 2050 net-zero deadline.
Previously, the Labour government has explicitly cited SAFs and other new technologies as part of its justification for expanding Heathrow airport.
Dr Lois Pennington, a research associate at the University of Manchester who has analysed Heathrow’s emissions impact, says the government’s new forecast shows “we are projected to be well over aviation’s share of the carbon budget even before a third runway is considered”.
She tells Carbon Brief:
“For Heathrow, it means expansion can no longer be waved through on the promise of technology, and any approvals will be in the full knowledge that it will bust our legally binding carbon budgets.”

The post UK aviation emissions to be 50% higher than thought by 2050, government admits appeared first on Carbon Brief.
UK aviation emissions to be 50% higher than thought by 2050, government admits



-
Climate Change1 year ago
Guest post: Why China is still building new coal – and when it might stop
-

 Greenhouse Gases2 years ago
嘉宾来稿:满足中国增长的用电需求 光伏加储能“比新建煤电更实惠”
-
Greenhouse Gases1 year ago
Guest post: Why China is still building new coal – and when it might stop
-

 Climate Change2 years ago
嘉宾来稿:满足中国增长的用电需求 光伏加储能“比新建煤电更实惠”
-

 Renewable Energy11 months ago
Sending Progressive Philanthropist George Soros to Prison?
-
Climate Change2 years ago
Bill Discounting Climate Change in Florida’s Energy Policy Awaits DeSantis’ Approval
-
Greenhouse Gases1 year ago
嘉宾来稿:探究火山喷发如何影响气候预测
-

 Carbon Footprint2 years ago
US SEC’s Climate Disclosure Rules Spur Renewed Interest in Carbon Credits