

Solar and wind capacity in the Association of Southeast Asian Nations (ASEAN) region increased by 20% in 2023, bringing the total to more than 28 gigawatts (GW).
The technologies now make up 9% of electricity generating capacity in ASEAN countries – Brunei, Cambodia, Indonesia, Laos, Malaysia, Myanmar, the Philippines, Singapore, Thailand and Vietnam – according to a new report from Global Energy Monitor (GEM).
Combined with a large base of hydropower, the growth in wind and solar takes the bloc close to its renewable energy capacity target of 35% by 2025, GEM says.
Building an additional 17GW of utility-scale solar and wind projects in the next two years – those that feed power directly into the electricity grid – would be sufficient to reach the goal, it adds.
In fact, it says the region is on track to sail past its target, nearly doubling wind and solar capacity in the next two years by adding a further 23GW of new projects
An even larger 220GW pipeline of new utility-scale wind and solar capacity has been announced, or entered pre-construction or construction stages, according to GEM’s analysis, though only 6GW of this is currently being built.
However, ASEAN countries collectively have one of the fastest-growing economies in the world and have seen very rapid recent electricity demand growth of 22% per year between 2015 and 2021. This has translated into continued support for gas and coal power in the region, even though demand growth is expected to slow.
While renewables have the potential to temper the growth in fossil fuel demand, wind and solar expansion face regulatory hurdles and a lack of supportive policy, GEM adds.
Success so far
ASEAN added 3GW of solar capacity in 2023, increasing installed capacity by 17% over 2022 levels, according to GEM’s report.
Despite solar seeing a larger overall capacity increase, operational wind capacity saw a larger comparative rise, growing by 29%, or 2GW, since January 2023.
Offshore wind now accounts for 2GW of the operating 9GW of utility-scale wind capacity in the region.
Given the technical challenges and associated higher costs of offshore wind, this is particularly noteworthy, GEM states.
Vietnam has by far the most utility-scale solar and wind capacity of all the ASEAN nations, as seen in the chart below.

The increase in utility-scale solar and wind capacity over the past year has come as a result of a supportive policy environment across many countries in the ASEAN region, says GEM.
In 2017, Vietnam deployed a series of investment policies designed to bring utility scale-solar projects into operation, for example. Two feed-in-tariff (FiT) programs were deployed by the country’s state-owned utility between 2017 and 2020.
However, when these programs expired, Vietnam failed to administer a replacement, GEM says. As such, despite the nation adding 12GW of utility-scale solar capacity between 2019 and 2021, gaps in energy policy have started to limit progress.
Just 1GW of utility-scale solar and wind was commissioned in Vietnam in 2022, in comparison with nearly 4GW in 2021.
Thailand and the Philippines currently have the second and third highest utility-scale solar and wind capacity in the region, with 3GW of operating capacity each.
Thailand is the second largest economy in ASEAN after Indonesia and has benefitted from being seen as a “low-risk country”, notes GEM, with few barriers for investment.
The Philippines, meanwhile, hosts a “streamlined project bidding system”, which allows for an “unencumbered pipeline of project development”, GEM says. Currently, around three-quarters of its operational utility-scale solar and wind capacity comes from solar.
Future growth
There is currently a total of 222GW of announced, pre-construction and construction-stage utility-scale wind and solar capacity in ASEAN countries, according to GEM’s research.
More than 185GW of this pipeline of projects is in the Philippines and Vietnam, meaning they account for more than 80% of prospective capacity in the region. This is shown in the figure below.

More than 60% of the pipeline in Vietnam and the Philippines comes from planned offshore wind development, GEM says, of 72GW and 52GW respectively.
The Philippines is responsible for 45% of prospective capacity in ASEAN countries. Its Green Energy Auction Program (GEAP) aims to facilitate the development of more than 11GW of renewable energy.
In March 2023, it held an auction securing just over 300 bids to develop 3GW of solar, onshore wind and bioenergy with 2024–2026 start dates.
This capacity fell short of the level targeted, but represented a 75% increase on the amount secured in 2022’s auction, notes GEM.
Offshore wind comprises 52% of the Philippines’ prospective utility-scale renewable capacity, with five times more offshore wind than onshore.
In April 2023, the nation issued an executive order, outlining cooperation between private investors and the government on offshore wind. Since then, offshore wind contracts have more than doubled to nearly 80, representing 61GW of capacity, GEM notes.
Vietnam has more than 86GW of prospective capacity, including 72GW of offshore wind. However, just 2% is currently being built, due in part to the country’s “lack of concise and reliable renewable energy policies that could serve as a crucial roadmap for project implementation”, states GEM.
A further 40GW of utility-scale solar and wind projects in Vietnam are considered by GEM to be “shelved”, because they have seen no progression or announcements in the past two years.
Vietnam is working on a just energy transition partnership (JETP) with a group of developed countries. It also released its latest national electricity development plan for 2021–2030, also known as the power development plan 8 (PDP8).
The alignment of these policies and funding schemes is still in development, and therefore their impact cannot yet be determined, notes GEM.
Laos is aiming to “punch above its economic weight” in the development of utility-scale solar and wind capacity, GEM says. At more than 3GW, its prospective capacity rivals that of Thailand, despite the country’s economy being only 2% of the size.
Laos’ prospective utility-scale solar and wind capacity surpasses that of Malaysia by more than 150%, despite having an economy that is more than thirty times smaller. This ambition is being driven by financial collaboration with ASEAN partners, according to GEM.
Laos is set to house the region’s largest onshore windfarm. Monsoon windfarm is currently under construction and expected to have a capacity of 600 megawatts (MW) when complete.
Despite this large pipeline of ASEAN wind and solar projects, however, only 6.3GW (3%) is currently under construction, notes GEM.
Reaching renewable ambitions
The target for renewables to make up 35% of electricity generating capacity by 2025 is “easily attainable and ultimately unambitious for ASEAN”, according to GEM.
Renewables already make up 32% of electricity capacity in ASEAN countries, GEM says, meaning the 35% target can be met easily.
Moreover, while annual growth in electricity consumption is expected to slow from the annual 22% since 2014 to just 3% a year out to 2030, GEM says rising demand will continue to drive expansion in fossil fuel power infrastructure in the region.
Hitting the 35% target would only require ASEAN countries to commission 17GW of new renewable capacity by 2025, GEM says, of which 6.3GW is already under construction.
Yet there is in excess of 220GW of prospective utility-scale solar and wind in development, with a total of 23GW set to be operational by 2025.
This means the region is on track to beat its target and nearly double its installed wind and solar capacity in just two years, according to GEM, with scope to go even further and reduce the need for fossil fuel expansion.
For now, fossil fuels remain entrenched in the region, restricting new investment in utility-scale wind and solar, GEM states.
Gas and coal each account for approximately 30% of ASEAN countries’ total installed capacity, and coal-fired power capacity has seen an annual growth rate of 7% since 2017.
With electricity demand growth currently outpacing the rollout of renewable energy capacity, gas and coal are expected to continue to grow in coming years, GEM says.
National energy policies have touted the use of gas as a “stepping stone” in the energy transition and ASEAN countries are likely to be net importers of gas by 2025.
Insufficient grid infrastructure investment is also a “persistent hurdle” for integrating utility-scale solar and wind, notes GEM.
As such, while there is a clear effort being made to ramp up renewable energy, this continues to be complicated by a buildout of fossil fuels and low solar and wind construction rates, concludes GEM. The report adds:
“By doubling down on bringing as much of the 220GW of prospective utility-scale solar and wind projects into fruition, ASEAN countries will be poised to not only meet regional renewable energy targets, but pave the way to transition from fossil fuels.”


The post Wind and solar capacity in south-east Asia climbs 20% in just one year, report finds appeared first on Carbon Brief.
Wind and solar capacity in south-east Asia climbs 20% in just one year, report finds

Scientists have vowed to keep working on the next flagship set of reports for the Intergovernmental Panel on Climate Change (IPCC), after a political row over the timeline for their release saw its latest session suspended on Friday evening without agreement.
During the weekend, government officials and scientists alike expressed disappointment over the inability to reach a compromise before some delegates from developing countries and small island states had to leave the week-long meeting in Ethiopia to catch flights home.
The disagreement – which has persisted since early 2024 – turns on whether the three key parts of the AR7 assessment should all be published before the conclusion of the UN’s next Global Stocktake of global climate action, which is due to be completed in late 2028.
The IPCC issued a statement after the close of the session, saying that “key agenda items” – the timelines for the three AR7 reports, as well as the IPCC budget – remain open and under discussion. It said the IPCC’s plenary session and its deliberations on the pending agenda “will resume at the earliest opportunity”, giving no further details of when.
IPCC Chair Jim Skea told delegates in closing remarks that recent months had been some of the most turbulent for the climate science panel and that, if there were stronger words than “profound disappointment” he would use them, according to a summary published by the Earth Negotiators Bulletin (ENB). IPCC discussions happen behind closed doors.
IPCC scientists remained committed
In an open letter, issued on Monday, a group of nearly 120 scientists – from a total of 664 AR7 authors – said they “stand committed to continue working to deliver the AR7 reports in a manner that is rigorous, timely and inclusive, in line with our mandate to be policy-relevant”.
“An assessment that arrives after the decisions it is meant to inform cannot serve its purpose,” they emphasised. “The second Global Stocktake in 2028 is such a decision point, and the world should not have to face it without the IPCCʼs latest assessment.”
Europe, small islands and the least developed countries, plus many Latin American and developed nations, want the IPCC to meet this deadline, arguing that the findings from the UN climate science body are irreplaceable in the UN climate policy-making process.
However, around a dozen developing countries plus Russia have argued that the reports should come later in order to allow for greater research input from the Global South – something that, in their view, would make the findings fairer. They also claim that a shorter timeline would put excessive pressure on experts.
-
Who shapes climate science? The equity question facing the IPCC
Early completion of the next global climate science assessment reports risks excluding research from the Global South, which is key to ensuring the findings are fair -
Governments that support climate science must stand firm against naysayers
The IPCC is meeting to decide the timing of its next major report, as some countries try to delay it and weaken the case for faster emissions cuts


The most vocal of this group at last week’s meeting were India and Saudi Arabia, according to the ENB summary and a developed country diplomat. Critics see this push for a longer timeline as an excuse to deprive government decision-makers of the latest science and ease pressure on emerging economies to raise their ambition, particularly on cutting emissions.
Commenting on last week’s meeting, France’s ambassador for climate negotiations Benoît Faraco said a broad coalition of developed and developing countries from all five continents, “united in their support for science and the timeline proposed by scientists”, had withstood pressure “from a few countries” seeking to slow down the process of adopting the IPCC reports.
He added that France would not back down and would “continue to fight tirelessly for science, protect the integrity of information, and convince our partners that without the best available scientific data, we will be less effective in tackling climate change and protecting our populations”.
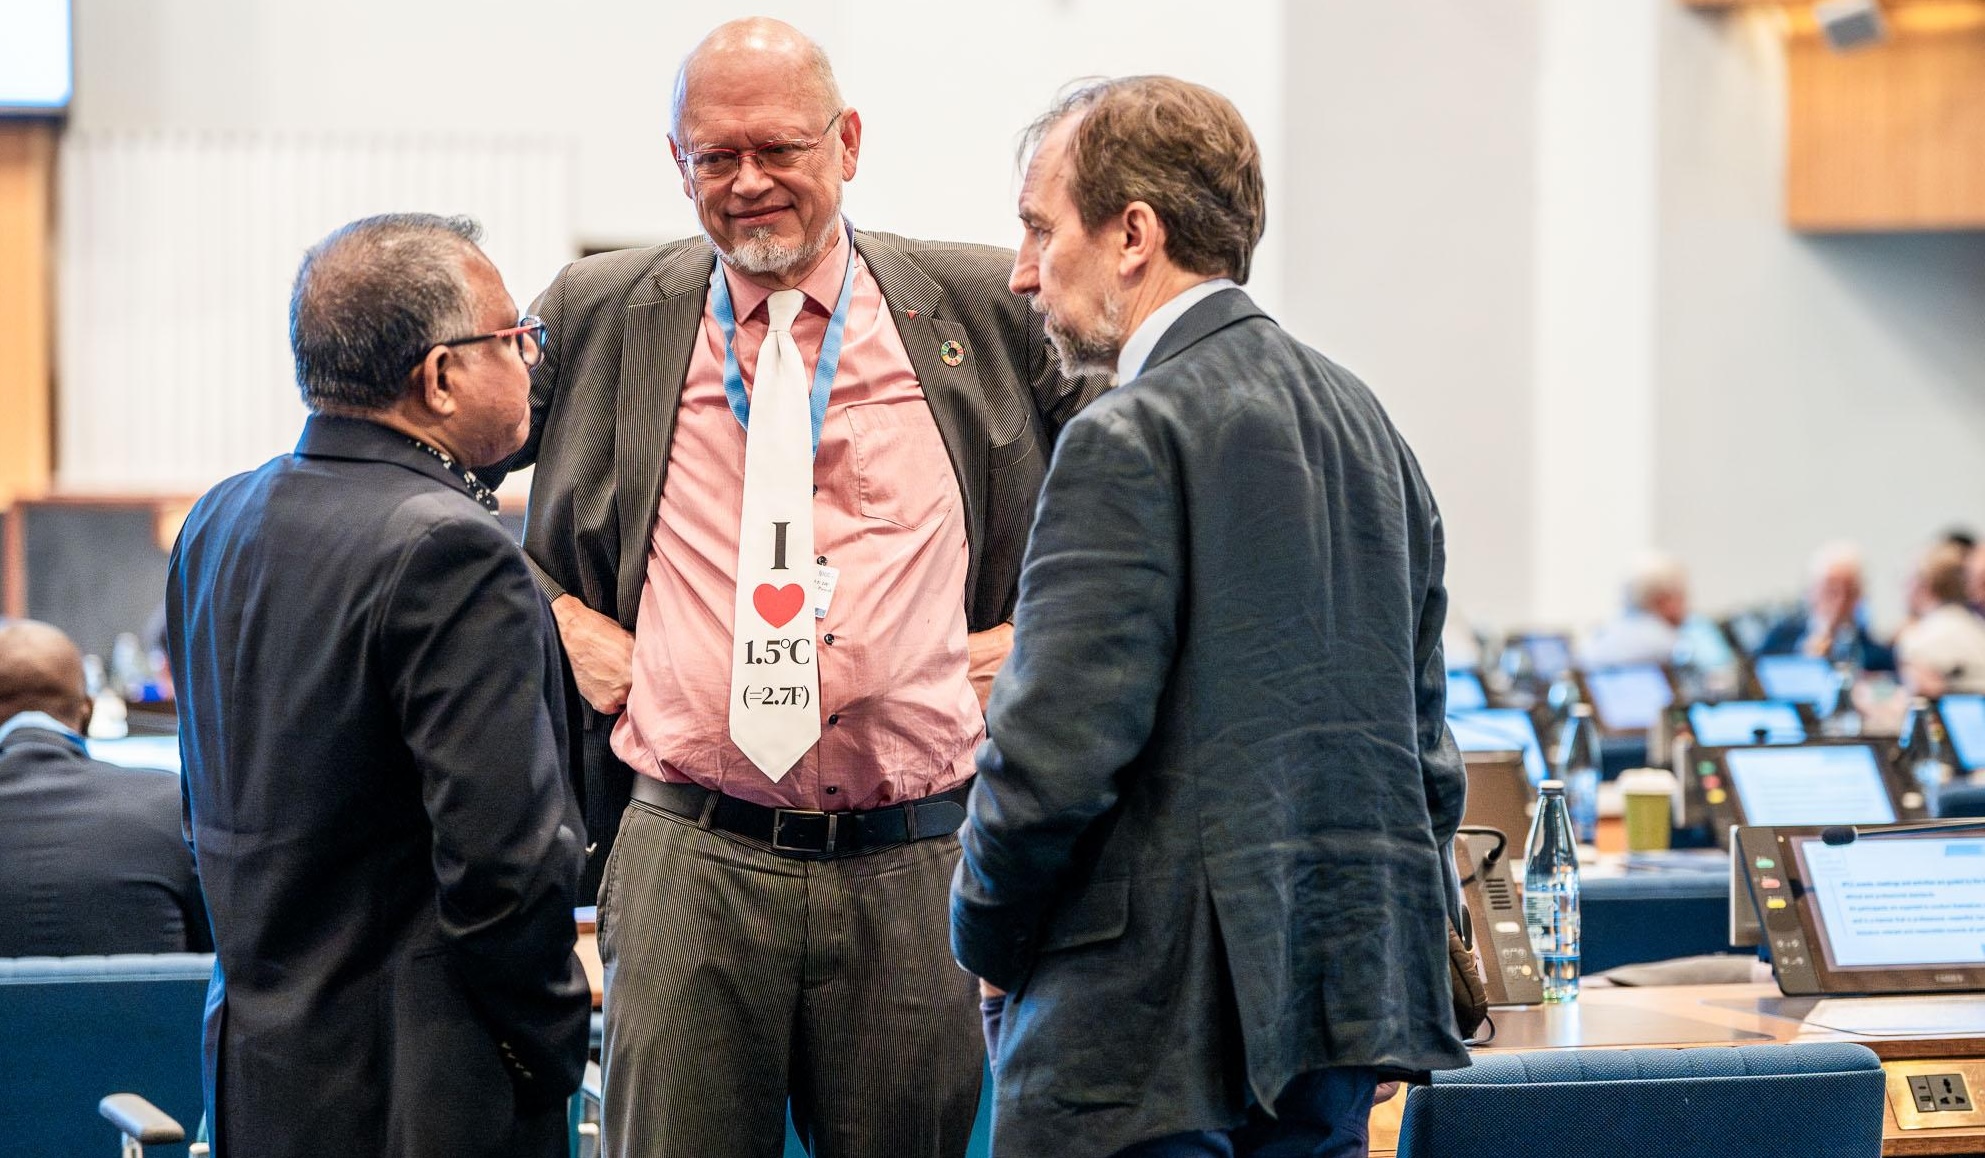
Inclusivity proposal stalled
In a bid to unlock a solution for the AR7 timeline, countries discussed ways to improve the inclusivity of the IPCC’s work. One option put on the table was for the IPCC to expand its funding for delegates from developing countries to attend some or all of its sessions from one to two participants, according to the ENB summary and a delegate speaking to Climate Home News.
That would increase the costs for the IPCC to complete AR7 by up to a quarter, according to an assessment shared by the secretariat. The panel’s budget is under severe strain and its officials have warned that, without additional voluntary contributions, it risks running out of money before it can deliver on this assessment cycle.
Climate Home News understands that some of the IPCC’s traditional donors – which mainly include European countries, Japan and Australia – indicated a willingness to support funding for an additional developing country participant. But without an agreement over the budget or the timeline for the reports, that option was ultimately not adopted.
‘Disappointed and worried’
The three reports are managed by working groups that collate and draw overall findings from the latest scientific studies and data on the physical effects of global warming around the world, how to adapt to it, and pathways for cutting planet-heating emissions in order to meet the temperature goals of the Paris Agreement.
Winston Chow, an urban climate professor at Singapore Management University who co-chairs Working Group II on adaptation, wrote in a LinkedIn post that he was “disappointed and worried” for the IPCC authors who have worked “extraordinarily hard” to assess the relevant climate science over the past two years.
He said he shared their concern that “the rigour, time and goodwill they’ve invested are now being put at risk by the Panel’s stalemate”.
As science comes under attack at UN talks, climate movement splits over how to respond
For Working Group II, a meeting for 250 experts writing that report is scheduled for January 2027, followed by the approval of a special report on cities and climate change in Singapore next March.
But because the IPCC’s budget has not been confirmed due to uncertainty about the AR7 schedule, travel support for those researchers is at risk, wrote Chow. “If they cannot participate, our assessments will lose vital expertise, perspectives and scientific breadth, and the collective effort of our authors will be undermined,” he warned.
Scientific work continues
Despite the political holdups, he – together with French climate scientist Robert Vautard, co-chair of Working Group 1 – agreed with IPCC head Skea who told the IPCC’s closing session on Friday: “The engine room of the IPCC is working, and it’s healthy.”
Vautard commented in a separate post on LinkedIn after it ended: “The boat is at full steam.” Working groups I and II are due to start revising the first drafts of their reports, while Working Group III on reducing emissions is finalising its first draft which will be out soon, he wrote.
“The most exciting two years of the cycle are ahead, for the authors. The momentum in the engine room is here and now. Trust the engine room!” he added.
The IPCC and some scientists report that progress has been made towards achieving an equitable balance of authors from the Global North and the Global South.
The group of researchers who signed the open letter on Monday noted that “inclusivity is at the heart of how we work”, with author teams bringing together experts from developed and developing countries with diverse backgrounds and at different stages of their careers.
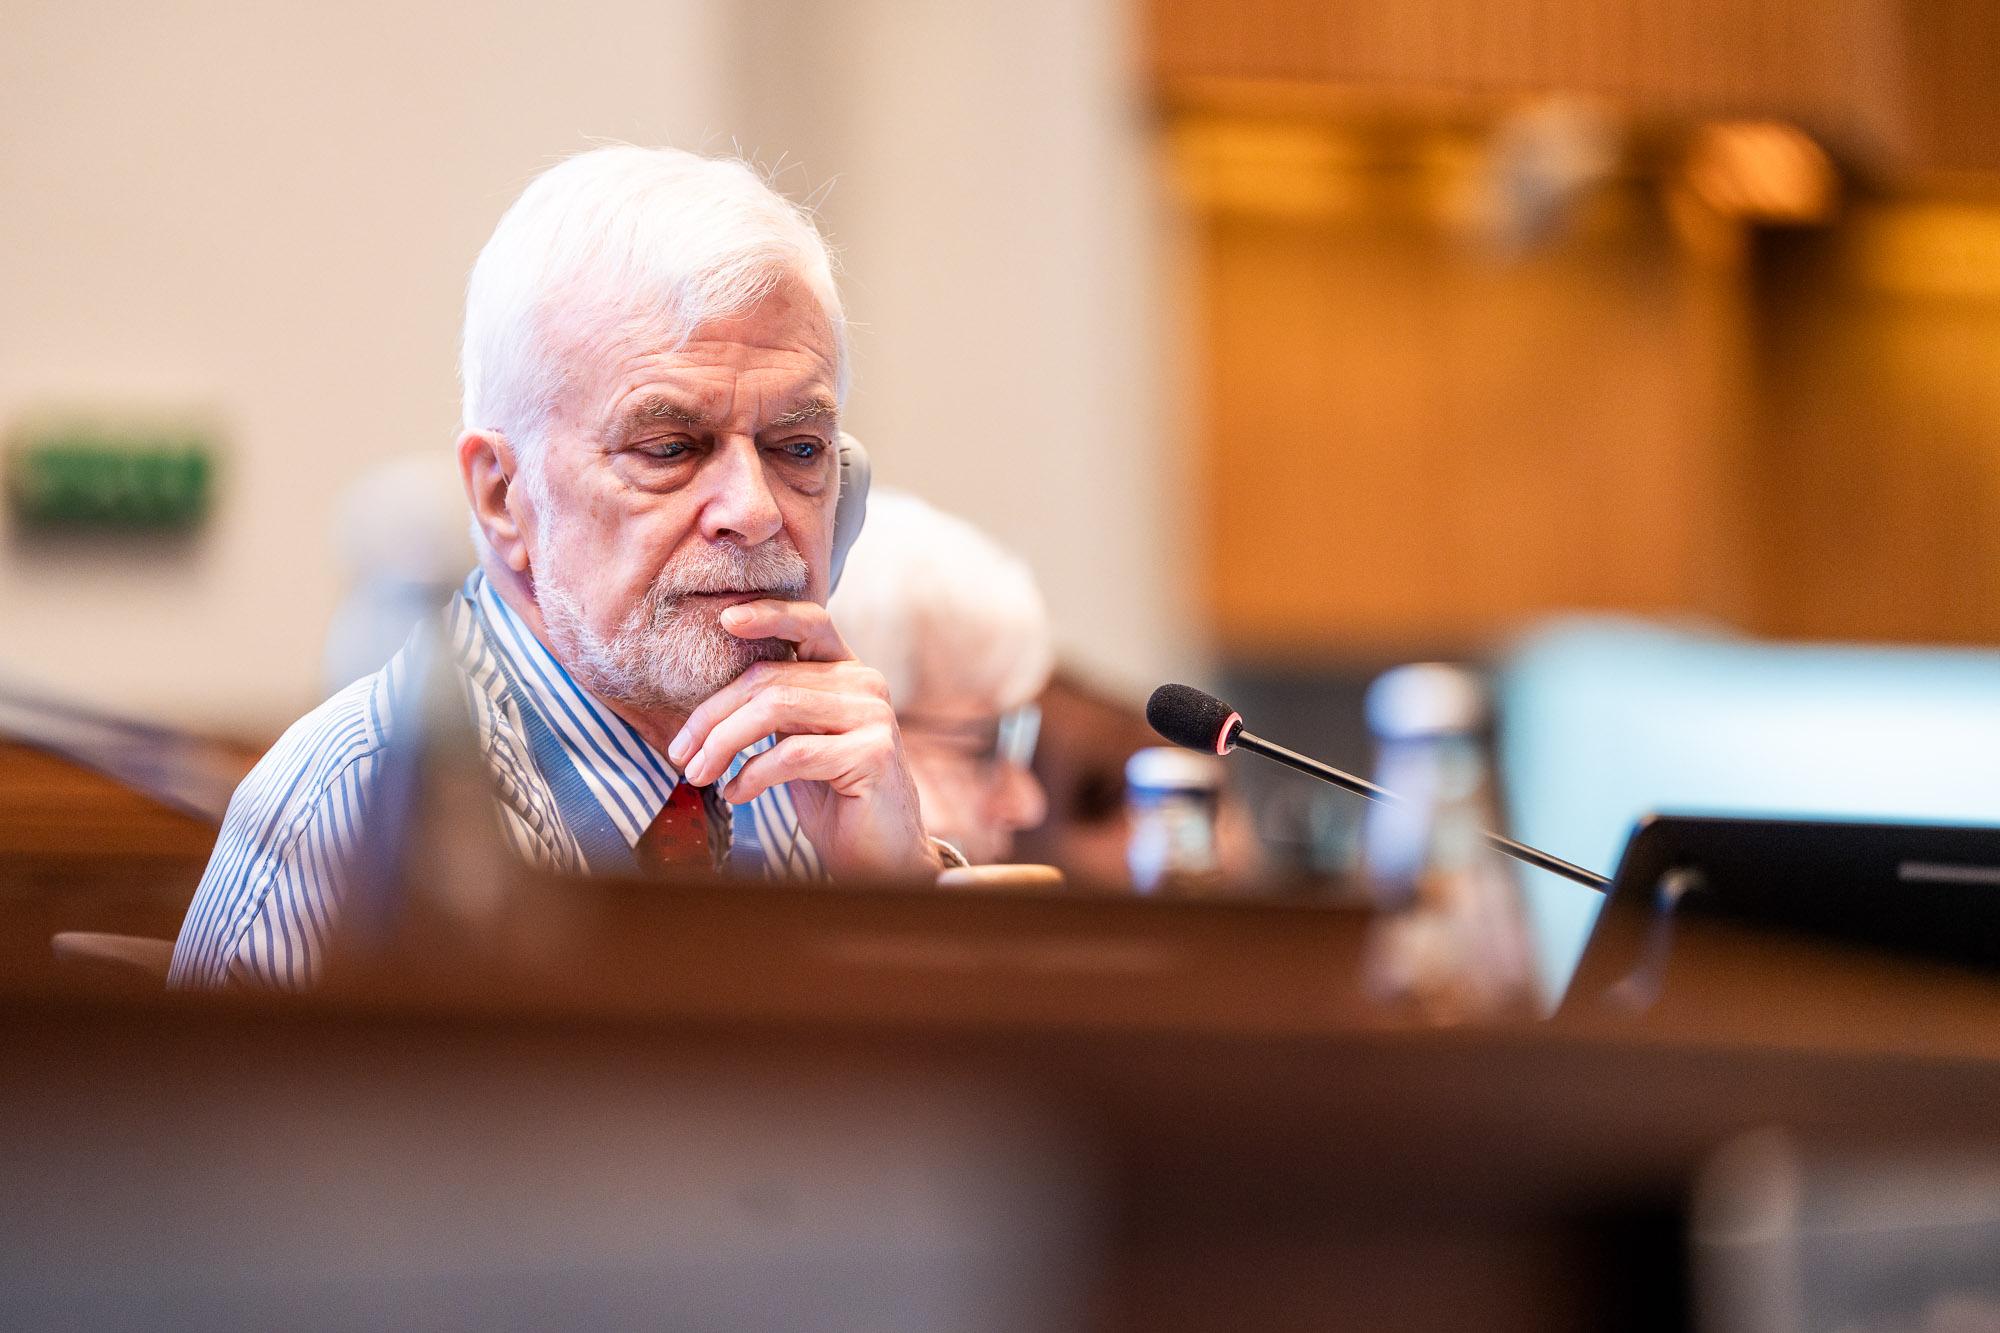
Plea to overcome political differences
The signatories include several scientists from some of the countries opposed to the alignment of all IPCC reports with the Global Stocktake.
“We are committed to an assessment in which the knowledge, experience and priorities of every region are fully reflected, a commitment we share with the leadership of the IPCC.
Equity is built into how our assessment is being drafted,” they added.
They appealed to governments that make up the IPCC “to overcome their political differences and work together as we do as a global scientific community, so that we can deliver the IPCC reports the world needs to hear”.
In a statement published on Monday, IPCC chair Skea said reaching consensus on the schedule for the reports is “vital”. He added that the assessments provide authoritative scientific evidence to inform national climate policies, strengthen adaptation and resilience and support access to climate finance, as well as helping communicate the scale of the climate crisis and the urgency of efforts to tackle it.
The post IPCC scientists vow to press on with climate reports despite political deadlock appeared first on Climate Home News.
IPCC scientists vow to press on with climate reports despite political deadlock
An Lambrechts is a biodiversity politics expert at Greenpeace International with extensive experience in biodiversity-related multilateral negotiations. She is the head of the Greenpeace delegation at the Convention on Biological Diversity (CBD) COP17 happening in Yerevan, Armenia.
In 2022, COP15 delivered the landmark Kunming-Montreal Global Biodiversity Framework to halt and reverse biodiversity loss by 2030. With COP17 starting in Yerevan, we are now halfway to the deadline, and according to the first Global Review of progress, countries are not on track to meet the biodiversity targets, and implementation must accelerate fast.
One of the main findings of the Global Review is that funding falls far short of the scale needed to halt and reverse nature loss. But the crisis facing the world’s biodiversity is not an absolute scarcity of capital – it is a profound public policy distortion.
The global economy currently spends roughly $30 destroying nature for every single dollar invested in its protection. According to a report from the Intergovernmental Science-Policy Platform on Biodiversity and Ecosystem Services, a staggering $2.4 trillion is spent in public subsidies for fossil fuels, agriculture and water use, while global investment in biodiversity conservation and restoration stands at a mere $220 billion.
Countries urged to ramp up “insufficient” nature policies at COP17
Yet, discussions about how to close the biodiversity finance gap continue to claim that salvation lies in mobilising private capital, scaling offsets and “derisking” investments in nature. This is a fundamental misunderstanding of both the nature of ecological stewardship and of the global financial architecture.
Biodiversity conservation is not a speculative investment portfolio – it is the foundation of human survival. The health of our planet is a non-monetisable, non-excludable public good. Expecting profit-seeking private capital to protect nature perpetuates the structural drivers of ecosystem destruction in the first place.
But if private market mechanisms cannot save biodiversity, where will the necessary public resources come from?
Money going to the wrong places
The answer lies in recovering the vast public wealth currently drained by cross-border tax abuse, financial secrecy and corporate impunity. Finance and environment ministers meeting in Yerevan must give a strong political signal that, to avert ecological breakdown, countries need to take swift action to reform global tax rules, eliminate harmful public subsidies and cancel unsustainable sovereign debts for the public revenues to end up where they belong.
Extractive sectors such as industrial agriculture, fishing, timber and mining continue business-as-usual, often heavily subsidised by public treasuries, while voluntary carbon and biodiversity offset markets pose a serious risk to nature conservation. Offset schemes have delivered only a negligible fraction of the funding needed to preserve ecosystems, allowing industries to continue with their destructive business-as-usual practices.
-
Global deforestation slowed in 2025 but Brazil’s election could undo “fragile” gains
Countries remain 70% off track to meet a goal to end deforestation by 2030, as progress in Latin America offset by failures in Africa -
Brazil confident new rainforest fund will reach $10bn donor milestone
Brazil’s environment minister said the Tropical Forest Forever Facility has raised billions in record time – which he hopes will convince more investors


In advanced economies, public funding often actively undermines biodiversity. In Europe, over €5.3 billion in public subsidies