

Global electricity demand is entering a decisive growth phase. IEA’s 2026 electricity report forecasts that over the next five years, power consumption is set to rise faster than at any time in recent decades, marking a structural shift in how the world uses energy. This trend reflects the rapid electrification of industries, transport, buildings, and digital infrastructure, alongside climate-driven demand for cooling and heating.
Unlike previous cycles, electricity demand is no longer simply following economic growth. Instead, power consumption is becoming a leading driver of economic activity. This shift signals the arrival of what analysts increasingly call the “Age of Electricity,” where power is the backbone of modern economies and decarbonization strategies.
Let’s deep dive into IEA’s report here to understand the present and the future of electricity demand.
Electricity Demand Breaks Away from Economic Growth
Global electricity demand is projected to grow at an average annual rate of around 3.6% between 2026 and 2030, significantly faster than the growth seen over the past decade. In contrast, total energy demand will rise much more slowly, meaning electricity will expand at least 2.5 times faster than overall energy consumption.
This divergence marks a fundamental change. Historically, electricity consumption closely tracked GDP growth. That relationship is now reversing. In 2024, electricity demand outpaced economic growth globally for the first time in three decades outside of crisis periods, and this trend is expected to continue.
Several structural drivers are accelerating this shift:
- Electrification of transport, especially electric vehicles
- Expansion of data centres and artificial intelligence workloads
- Rising demand for air conditioning due to climate change
- Industrial electrification and reshoring
- Growth in heat pumps and electric heating
Together, these trends are pushing electricity to become the dominant form of final energy consumption.
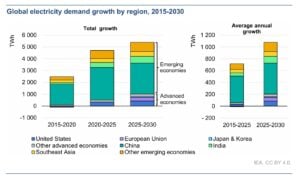
Emerging economies will remain the main engine of demand growth, accounting for roughly 80% of new electricity consumption through 2030. However, advanced economies are also seeing a resurgence after more than a decade of stagnation, driven by digitalization and electrification.
Global Power Mix: Renewables and Nuclear Take Half the Market
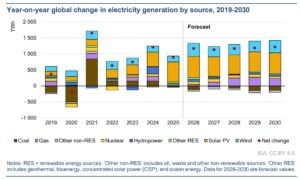
Globally, renewables and nuclear are on track to supply around 50% of electricity generation by 2030. Solar is the fastest-growing source, contributing more than half of annual generation additions.
Renewable generation is expected to grow by about 1,000 TWh per year through 2030, with solar alone adding more than 600 TWh annually. Nuclear power is also gaining momentum, supported by reactor restarts, lifetime extensions, and new builds in emerging economies.
However, coal will likely remain the single largest source of electricity in 2030, even as its share declines. Natural gas generation is also expected to rise, driven by US demand and fuel switching in the Middle East.
Overall, renewables, nuclear, and gas are projected to meet all net new electricity demand globally, displacing coal in aggregate but not eliminating it.
Advanced Economies Re-Enter the Demand Growth Cycle
Electricity demand in advanced economies is rising again after a prolonged period of stagnation. In the United States, demand is projected to grow by around 2% annually through 2030, with data centres accounting for roughly half of the increase.
In the European Union, electricity demand is expected to grow at around 2% per year, though consumption may not return to pre-2021 levels until the late 2020s. Other advanced economies, including Japan, Canada, Korea, and Australia, are also seeing accelerating growth.
This resurgence reflects:
- AI and cloud computing expansion
- Electrification of heating and transport
- Industrial reshoring and new manufacturing facilities
- Climate-driven cooling demand
Electricity is becoming a core input for economic competitiveness in digital and industrial sectors.
Power Sector Emissions: Plateau but Not Yet Declining Fast Enough
Electricity generation remains the largest source of energy-related carbon dioxide emissions, producing roughly 13.9 billion tonnes of CO₂ per year. After rising between 2022 and 2024, power sector emissions stabilised in 2025.
Looking ahead, emissions are expected to plateau through 2030, rather than decline sharply. This reflects the rapid growth in electricity demand, offsetting gains from clean power deployment.
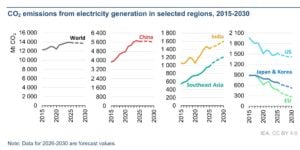
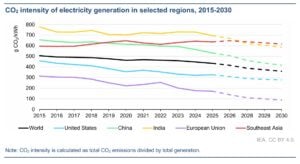
The carbon intensity of electricity has already fallen by around 14% over the past decade, and it is expected to decline faster as low-emission generation expands. This decline is mainly due to more renewable energy and strong nuclear power output.
- The trend is expected to accelerate. CO₂ intensity is forecast to fall by around 3.7% per year, dropping from 435 g CO₂ per kWh in 2025 to about 360 g CO₂ per kWh by 2030.
However, absolute emissions reductions will be harder to achieve due to rising demand. China’s trajectory is particularly critical. As the world’s largest power market and emitter, its pace of renewable deployment, coal retirement, and grid reform will heavily influence global climate outcomes.
China: The Single Largest Driver of Global Electricity Growth
China will remain the central force shaping global electricity demand over the next decade. Despite slower economic growth and structural shifts toward services, China’s sheer scale means it will contribute close to half of global electricity demand growth through 2030.
Electricity demand in China rose by just over 5% in 2025, down from roughly 7% in 2024. Looking ahead, demand is expected to grow at an average of around 4.9% annually between 2026 and 2030, slower than the past decade but still massive in absolute terms.
The drivers are multifaceted:
- Continued electrification across industry and households
- Expansion of manufacturing, including clean energy supply chains
- Growing services sector electricity use
- Rising cooling demand due to extreme heat events
- Digital infrastructure and smart technologies
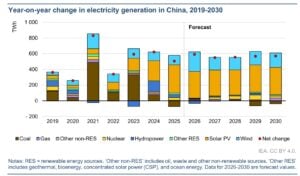
China’s power demand growth over the next five years alone is expected to match the current total electricity consumption of the European Union. This highlights the scale of China’s influence on global power markets, fuel demand, and emissions trajectories.
At the same time, efficiency improvements are tempering demand growth. Government policies targeting lower energy intensity and more efficient appliances are helping reduce electricity use per unit of GDP. However, these gains are not enough to offset the scale of electrification and economic activity.
MUST READ:
- China Adds Power 8x More Than the US in 2025, with $500B Energy Build-Out in a Single Year
- How China’s $180B Clean-Tech Investments Transform the Global South
Renewables Surge, But Grid Constraints Loom Large
China’s renewable energy buildout continues at an unprecedented pace. Solar generation jumped by more than 40% in 2025, while wind grew by double digits. The share of variable renewable energy (VRE) in China’s power mix reached around 22%, up sharply from the previous year.
Record capacity additions are transforming the power system. More than 300 GW of solar and over 100 GW of wind were added in a single year, driven partly by developers rushing to complete projects before the end of fixed-price tariffs.
However, this rapid expansion is creating new challenges. Curtailment rates for solar and wind increased, reflecting grid congestion and integration constraints. This highlights a global issue: generation is growing faster than grid infrastructure.
Coal’s Role Is Changing, Not Disappearing
Despite the renewable boom, coal remains a dominant force in China’s power sector. Coal-fired generation declined slightly in 2025, but coal still accounts for the largest share of electricity generation.
China’s coal share is expected to fall from around 55% in 2025 to about 43% by 2030, reflecting the rapid expansion of renewables and nuclear. However, coal capacity continues to grow, driven by projects approved during the 2022–2023 permitting boom.
Rather than serving as baseload power, coal plants are increasingly being used as flexibility and backup resources to support variable renewables. Capacity utilisation is expected to decline, even as installed capacity rises.
This shift illustrates a broader global trend: coal is becoming a reliability asset rather than a growth engine, but its persistence complicates decarbonization efforts.
Grids and Flexibility: The Hidden Bottleneck
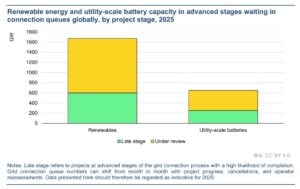
The transition to an electricity-centric energy system depends on grid expansion and flexibility. Investment in grids currently lags far behind generation capacity additions. Worldwide, more than 2,500 GW of projects are stuck in grid connection queues, including renewables, storage, and large industrial loads such as data centres. Without faster grid expansion and smarter system management, power shortages and curtailment risks will rise.
Meeting projected demand will require around 50% higher annual grid investment by 2030, rising from roughly USD 400 billion today. Without this, congestion, curtailment, and reliability risks will increase.
Flexibility solutions are also scaling rapidly. Utility-scale battery deployment is accelerating, especially in regions with high solar and wind penetration. However, conventional power plants still provide most flexibility today.
Policy reforms, grid-enhancing technologies, and non-firm connection agreements could unlock 1,200–1,600 GW of stalled projects, significantly accelerating the transition.
The Global Outlook: A Power-Centric Energy System
The global energy system is undergoing a structural transformation. Electricity is becoming the dominant vector for economic growth, digitalization, and decarbonization. Demand growth is accelerating across emerging and advanced economies, with China playing the most decisive role.
Renewables and nuclear are rapidly expanding, but coal and gas will remain part of the mix for reliability. Emissions are stabilising but not falling fast enough to meet climate targets, highlighting the scale of the challenge ahead.
The next five years will be critical. Grid expansion, flexibility solutions, and policy reforms will determine whether the Age of Electricity delivers a clean, affordable, and resilient energy future—or locks in new infrastructure bottlenecks and emissions risks.
- ALSO READ: 2026: The Year Nuclear Power Reclaims Relevance With 15 Reactors, AI Demand, and China’s Expansion
The post How Power Demand, Emissions, and China Will Shape the Global Energy System to 2030 appeared first on Carbon Credits.

Insetting program design starts with your supplier map. The carbon claim comes much later.
Consider a coffee procurement team that funds a farm intervention before checking its sourcing data. The supplier aggregates coffee lots from several regions. The buyer lacks farm-level traceability. Another purchaser expects to report the same outcome. A more attractive project brochure solves none of these problems.
If the distinction between a value-chain intervention and a purchased credit is still open, read CCC’s Insetting vs Offsetting guide before you set the brief.
Insetting program design begins with the purchasing relationship and works outward. You need to decide 1) where an intervention belongs, 2) what business problem it addresses, 3) who pays for it, 4) how results will be measured, and 5) what the evidence will let you say about them. This five-step playbook turns that sequence into a procurement plan.
Step 1: Insetting program design starts with supplier mapping
Start with the commodities that matter most to your Scope 3 inventory and sourcing continuity. Ask finance for spend by supplier, sustainability for the emissions baseline, and category managers for origin and volume records. Then identify which suppliers can trace material to a jurisdiction, sourcing region, producer group, or individual land-management unit.
The level of traceability affects what you can account for. Under the GHG Protocol Land Sector and Removals Standard, the spatial boundary for purchased land-based products depends on the traceability associated with each volume. Farm-specific factors or removals require physical traceability through an acceptable chain-of-custody model. A contract with a tier-one trader, by itself, does not establish a link to the farms behind its deliveries.[1]
Build a first-pass table with five columns: commodity and annual volume; supplier and origin; current traceability level; land-use and production risks; and the business owner who can change the purchasing terms. Mark missing data plainly. A blank cell is cheaper to fix before a program starts than after a claim is drafted.
If your company sets an SBTi Forest, Land and Agriculture target (FLAG), keep its land-related target boundary separate from energy and industry emissions. The current FLAG guidance also requires relevant companies to assess primary deforestation-linked commodities in their value chains.[2]
Step 2: Choose a commodity and jurisdiction for a pilot
Select one supply corridor where the sourcing connection can be established and procurement has a reason to stay. A useful pilot has repeat purchases, suppliers willing to share records, an intervention matched to a diagnosed problem, and a defined plan to measure the result. Carbon potential alone is a poor selection rule if the supplier cannot deliver the crop your business needs.
Compare candidate regions on land-use risk, supplier concentration, local rights and tenure, the availability of baseline data, and exposure to drought, erosion, or forest conversion. Check the relevant legal requirements separately. A nature project does not satisfy a due-diligence obligation merely because it has a carbon method attached.
Consider a coffee buyer sourcing from two districts. In the first, producer-group records identify the farms, while recent dry seasons have increased rejected green coffee lots. In the second, deliveries pass through several intermediaries and farm origins are unknown. Pilot shade management in the first district, with local agronomic advice and quality checks built into the plan. The buyer can trace purchases there and test the intervention against a defined sourcing problem.
Use a short decision memo to record why the selected corridor beats the alternatives, what remains uncertain, and what would stop the pilot. That memo is the first control against a project drifting toward whatever happens to photograph well.
Step 3: Design the supplier engagement and commercial model
The intervention needs an owner on each side of the contract. Decide who supplies planting material or training, who maintains the practice, who bears the cost if a harvest disappoints, and how long the buyer expects to purchase from participating suppliers. Where smallholders participate, budget cash flow and technical support for practices that offer a later return.
Put these terms in a supplier agreement or pilot addendum. It should cover eligible farms and volumes, consent to data collection, access for monitoring, any land or carbon rights that matter, benefit sharing, and what happens if the purchasing relationship ends. Ask local counsel and producer representatives to review the arrangement. The Accountability Framework is a useful reference for supply-chain work involving forests, ecosystems, and human rights.[3]
Avoid assigning an automatic carbon benefit to the buyer. The contract should say which party has the right to report each outcome, how overlapping claims will be checked, and how any issued credits will be handled. A reduction reported in a buyer’s inventory cannot simply be sold for someone else’s offset claim without an accounting review. SBTi FLAG guidance excludes purchased credits used as offsets from near-term FLAG target achievement.[2]
Set commercial measures beside environmental ones: delivered volume, rejection rate, supplier retention, and procurement cost. They tell you whether the program works as a supply-chain investment, even if carbon accounting takes longer to resolve.
Step 4: Build monitoring, reporting, and verification before rollout
Agree on the baseline and data flow before paying for a full rollout. Identify the land units or sourcing regions in scope, the practices that change, the records suppliers already keep, and the additional measurements the program requires. Decide which data can come from field visits, transaction records, or remote sensing, and who checks each source.
For carbon, separate three questions. Did the practice happen? Did emissions or removals change under an applicable method? Can the buyer attribute a defensible share to its purchased goods without double counting? The GHG Protocol’s 2026 guidance includes dedicated chapters on spatial boundaries, data and methods, evaluating actions, credited outcomes, and assurance.[1] These are distinct jobs. A photograph of a planted tree answers only part of the first.
CCC’s MRV and Additionality article explains the separate evidence questions a project reviewer will ask.
Create an evidence file for every reporting period: dated supplier and farm records, purchase volumes, methods and emission factors, uncertainty, quality checks, and changes from the baseline. Specify who can challenge the data and how corrections are recorded. If a project also seeks credit certification, keep project accounting and corporate inventory accounting separate. The GHG Protocol says its land standard focuses on entity-level inventories and does not set the rules for credit certification.[4]
Start with the minimum viable measurement design that can survive review. Add complexity when the pilot tells you which data actually changes a decision.
Step 5: Decide what can be reported and claimed
Insetting program design needs reporting rules before the marketing copy. Procurement, sustainability, finance, and legal should agree on four distinct outputs: operational performance; observed land or nature outcomes; inventory effects, if the accounting criteria are met; and any separately issued credits. One dashboard can display them, but they should not share a single unqualified headline.
SBTi FLAG guidance allows certain land-based removals within a company’s operations or supply chain to contribute to FLAG pathways, subject to criteria including permanence, traceability, data quality, and allocation. It does not allow purchased offsets to meet near-term FLAG targets.[2] Eligibility therefore depends on evidence and the applicable target rules, not on calling an activity “insetting.”
Draft a claims register. For each proposed sentence, record the period, boundary, data owner, calculation method, reviewer, and whether the result is measured, estimated, or still a goal. If the evidence supports only “we funded a pilot with 200 farms,” say that. Do not turn a funding fact into a verified emissions reduction.
What good looks like by year three
Treat year three as a review point, not a promised payback date. A mature pilot should have mapped participating supply volumes, a stable supplier agreement, a repeatable data collection process, and a comparison of commercial and environmental results against the baseline. It should also have a documented answer for outcomes that cannot be included in the buyer’s inventory.
Scale only where the pilot improves a sourcing decision and the evidence can follow the product. If neither condition holds, redesign the intervention or change the corridor. A disciplined program can conclude that a site is unsuitable. That is useful procurement intelligence.
Discuss your insetting program with CCC
Carbon Credit Capital designs nature-based supply chain investments around sourcing needs and measurable sustainability outcomes. Schedule a consultation with our carbon and sustainability experts to map your tier-one supplier network, FLAG exposure, and first pilot decision.
Sources
[1] GHG Protocol, Land Sector and Removals Standard, version 1.1, and companion Guidance, June 2026: https://ghgprotocol.org/land-sector-and-removals-standard ; https://ghgprotocol.org/land-sector-and-removals-guidance
[2] Science Based Targets initiative, Forest, Land and Agriculture Science-Based Target-Setting Guidance, version 1.2, March 2026, especially pp. 16–17, 37, and 41: https://sciencebasedtargets.org/resources/files/SBTiFLAGGuidance.pdf
[3] Accountability Framework initiative, Accountability Framework and guidance for companies: https://accountability-framework.org/
[4] GHG Protocol, Frequently Asked Questions: Land Sector and Removals Standard, questions 10 and 18: https://ghgprotocol.org/blog/frequently-asked-questions-land-sector-and-removals-lsr-standard
Nature-based carbon investments deserve consideration when they address a specific business dependency and produce outcomes you can measure. Imagine Moonbucks, a global coffee roaster planning next season’s espresso blend. It is considering natural Grade 4 coffee from Jimma, in southwestern Oromia, Ethiopia. Its sourcing decisions affect the roasting schedule and the cash tied up in coffee purchases. Moonbucks needs to understand which measures could protect that supply, what they would cost and how it would judge the results.
1. Define the sourcing problem before choosing a project
Moonbucks needs a dependable component for its espresso blend. Its procurement team wants continuity of volume and an agreed cup profile. Replacing a shipment at short notice could require new sample approval and changes to the blend, and given the schedules for cultivation, processing, and freight delivery, is practically impossible. Moonbucks needs to get this right, and its initial concern is inconsistent deliveries. It commissions an assessment of the supplying farms and post-harvest chain. The questions cover land condition, harvest availability and whether drying or storage problems are affecting saleable lots.
This distinction changes the investment brief. A tree-planting proposal cannot be assumed to fix drying problems. Better storage cannot restore eroded land. The team must establish which problem exists before selecting the response.
CCC’s guide to finding nature-based solutions in your supply chain explains where to look. Here, the next task is to turn a broad concern into a testable proposal.
2. Develop nature-based carbon investments around the actual supply chain
The assessment would trace Moonbucks’ purchases back through the exporter and supplying producer groups. Which farms supply the contracted lots? Who controls land-management decisions? How long does the buyer expect to maintain the purchasing relationship?
Furthermore, Jimma natural Grade 4 cannot be treated as interchangeable with every Ethiopian coffee. Moonbucks would need to test any substitute against its own blend and quality requirements.
Suppose Moonbucks’ assessment identifies an opportunity to maintain shade trees and restore vegetation along exposed streambanks. The IPCC describes agroforestry as a way to store carbon in vegetation and soil, with potential benefits for erosion control and water quality.1 Moonbucks would need local advice on species, growing conditions and maintenance before deciding how these measures fit its sourcing plan.
The proposal now has a defined sourcing connection and a candidate intervention. The next steps are to test its effect on production, assess carbon eligibility and build the financial case.
3. Compare the proposal with other ways to protect supply
WBCSD’s Nature-based Solutions Blueprint recommends comparing nature-based options with other responses across their benefits and costs.2 For Moonbucks, that means evaluating the landscape proposal alongside drying improvements, storage controls and alternative sourcing arrangements.
The product’s natural-process designation matters. Moonbucks should examine the drying and dry-milling chain alongside land conditions. Its team would check storage practices, contamination risks and incoming-lot quality to see whether problems arise before or after the coffee leaves the farms.
The revised proposal might combine land stewardship with separate post-harvest controls. Each component needs its own purpose and budget. A sustainability label should not obscure which activity is expected to solve which problem.
The project develops as the evidence improves. Its scope should follow the diagnosis rather than preserve the first idea unchanged.
4. Establish what the carbon outcome could count toward
Moonbucks’ sustainability team now tests the proposed carbon case separately from the sourcing case. Is the objective a measurable change in Moonbucks’ value-chain emissions, verified credits for separate voluntary use, or distinct outcomes under carefully defined arrangements?
Scope 3 covers value-chain emissions. A purchasing relationship alone does not prove that a farm intervention can be included in Moonbucks’ inventory. The team needs an applicable accounting method, defensible boundaries and evidence supporting attribution.
SBTi’s FLAG Guidance (forest, land and agriculture), version 1.2, says purchased credits used as offsets cannot meet near-term FLAG or energy and industry targets. Eligible land-based removals are subject to accounting requirements.3 Moonbucks needs to test its proposal against those rules before including an outcome in its targets.
For Moonbucks’ Jimma proposal, maintaining existing trees and establishing new vegetation could involve different carbon questions. Specialists must examine the baseline and additionality, meaning what changes because the project proceeds. They must also assess measurement and the risk that stored carbon is lost. CCC’s MRV and additionality article introduces those tests.
Until that work is complete, Moonbucks should not budget an assumed Scope 3 reduction or credit-sale receipt. Direct emissions reductions remain the priority.
5. Build a financial case that survives weaker assumptions
Moonbucks’ finance team would now build a multi-year budget. UNEP’s State of Finance for Nature 2023 compares current finance with the investment needed to meet climate, biodiversity and land-restoration goals.4 The company would cost its proposed activities, farmer participation and ongoing monitoring. Verification, where required, is a separate expense. Maintenance and responsibility for replacing failed plantings must remain visible after the initial establishment budget ends.
Operational benefits need equally careful treatment. If fewer rejected lots reduce emergency purchasing, count that saving once. Do not add “supply resilience” as another financial benefit when it represents the same avoided cost.
Moonbucks should compare a base case with slower benefits, higher implementation costs and no carbon revenue. It should also distinguish production outcomes from quality and shipment outcomes. A single good harvest would not prove that the landscape intervention caused better delivery performance.
A project can remain worth funding even when its carbon case needs more work. That decision must rest on the operational evidence and the company’s objectives, without unsupported environmental claims.
6. Fund a pilot with a clear expansion decision
Moonbucks’ first approval would fund a bounded pilot, rather than commit the entire sourcing program. Before spending, Moonbucks would agree on participating farms, responsibilities and the evidence needed at review.
Its scorecard could track farmer participation, implementation costs and plant survival, alongside accepted coffee volumes and lot-quality results. Carbon measurements would follow the selected method. Farm-level traceability must connect the intervention to the actual sourcing relationship.
Suppose Moonbucks’ review later finds that storage changes explain most quality improvements, while the land measures need longer observation. Those findings would shape the next decision: expand the proven component, adjust the landscape work or pause further spending. They would not justify crediting all improvements to tree planting.
This gives nature-based carbon investments a practical place in a multi-year strategy. Funding increases as the evidence supports it, and the project can change direction before a larger commitment.
Discuss a sourcing opportunity with CCC
Carbon Credit Capital’s nature-based supply-chain investment service uses its Dual-Value Model to examine supply-chain economics alongside potential sustainability outcomes.
Schedule a consultation to discuss your sourcing exposure and the questions to resolve before allocating capital.
Sources
- Intergovernmental Panel on Climate Change (IPCC), Climate Change 2022: Mitigation of Climate Change, Chapter 7, Agriculture, Forestry and Other Land Uses, section 7.4.3.3 (Agroforestry).
- World Business Council for Sustainable Development (WBCSD), Nature-based Solutions Blueprint, 5 June 2024.
- Science Based Targets initiative (SBTi), Forest, Land and Agriculture Science-Based Target-Setting Guidance, version 1.2, March 2026, section 3.1.4, pp. 37–38.
- United Nations Environment Programme (UNEP), State of Finance for Nature 2023, 2023.