

The global carbon credit market reached a clear turning point in 2025. Volumes declined. Prices rose. Buyer behavior shifted. Policy signals strengthened. At the same time, long-term commitments surged through record-breaking offtake deals.
These changes show a market moving away from scale at any cost. Instead, quality, integrity, and compliance eligibility now shape value. This article reviews the major trends that defined the carbon credit market in 2025 using various industry reports and explains what they mean for 2026 and beyond.
Why 2025 Marked a Turning Point for the Carbon Credit Market
For much of the past decade, growth in the voluntary carbon market was driven by volume. More credits were issued. More were retired. Prices stayed low. Quality concerns often came second.
That model no longer holds.
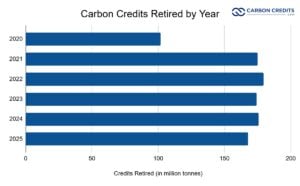
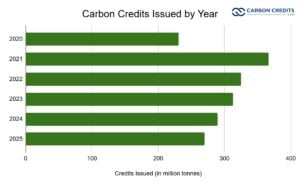
In 2025, total credit retirements fell to about 168 million tonnes, down 4.5% year on year, according to Sylvera report. New issuances also declined, reaching roughly 270 million tonnes, the lowest level since 2020. On the surface, this looks like a contracting market.
Yet market value moved in the opposite direction. Total spending on carbon credits rose to around $1.04 billion, up from about $980 million in 2024. The average price paid increased to roughly $6.10 per credit.
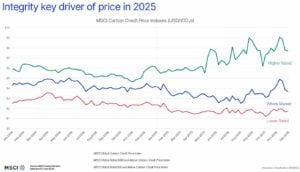
This shift matters. It shows that market growth is no longer tied to volume alone. Instead, it is driven by higher prices for credits seen as credible, durable, and compliant with future rules.
The reports point to two forces driving this change. First, buyers are paying more for higher-quality credits. Second, compliance-driven demand is starting to reshape the market. Together, these forces signal a transition toward a more structured and selective market.
Supply, Demand, Issuances, and Retirements: What Really Changed in 2025
The balance between supply and demand changed in important ways during 2025.
On the supply side, issuances declined across several major project types. Renewable energy credits saw the sharpest drop. These projects have long faced questions around additionality. Many buyers now see them as low impact. As a result, fewer new renewable credits entered the market.
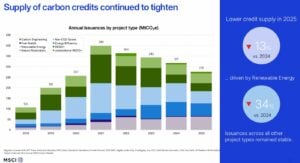
Nature-based credits still dominate total volumes. Forestry and land-use projects remain the largest source of issued and retired credits. However, within this category, the mix is changing.
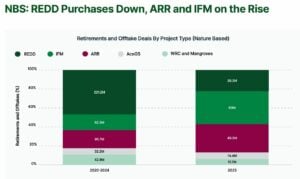
Buyers are moving away from older REDD+ projects and toward improved forest management, afforestation, reforestation, and agriculture-based projects. Allied Offsets data show the following mix:
On the demand side, retirements fell slightly, but this does not signal weakening interest. Corporate demand remained stable in terms of buyer count. What changed was how companies bought credits and what they were willing to pay.
Importantly, compliance use now accounts for about 23% of all retirements. Programs in California, Quebec, South Africa, and Chile contributed to this growth. This share is expected to rise as new compliance systems scale up.
Another key signal comes from inventory data. Credits rated BBB or higher have been in deficit since 2023. In 2025, this deficit continued for a third straight year. At the same time, lower-rated and unrated credits remained heavily oversupplied. Unrated credits alone added an estimated 88 million tonnes to inventory in 2025.
This split highlights a structural imbalance. The market does not lack the credits overall. It lacks the credits that buyers trust.
Nature, Tech, and Removals: The Credit Mix Evolves
The mix of credit types continued to rotate in 2025, reflecting buyer concerns about integrity and future eligibility.
-
Nature-based credits
Nature-based credits still make up the majority of market activity. However, not all nature credits are treated equally.
Legacy REDD+ projects lost market share. High-profile integrity concerns reduced buyer confidence. Prices weakened for lower-rated REDD+ credits. In contrast, well-rated afforestation and reforestation (ARR) projects gained ground. Buyers showed a clear preference for projects with stronger monitoring, permanence, and land tenure controls.
Agriculture-based credits also expanded. These projects often offer measurable co-benefits for soil health and livelihoods. Buyers increasingly value these attributes.
-
Technology-based avoidance credits
Credits from renewable energy projects continued to decline. Waste management, landfill gas, and industrial efficiency projects filled some of this gap. These projects often face lower additionality risks and clearer baselines.
-
Carbon removal credits
Carbon removal credits remain a small share of current retirements. In 2025, durable removals accounted for well under 1 million tonnes of issuances and retirements.
Yet removals are central to the market’s future. This is most visible in the forward market. Most large offtake deals focus on durable carbon removal, such as direct air capture, biochar, BECCS, and enhanced mineralization.
The CDR-focused report highlights why. Net-zero targets increasingly require removals to address residual emissions. Avoidance credits alone are not enough. This structural demand explains why removals command much higher prices and long-term commitments.
Prices, Quality Premiums, and What Buyers Are Paying For
Headline prices only tell part of the story.
In 2025, the average spot price was around $6.10 per credit. But actual prices varied widely by project type, rating, and co-benefits.
Afforestation and reforestation credits traded anywhere from $2 to over $50. Half of the ARR credits fell between $5 and $25. REDD+ credits showed similar dispersion but at lower levels. Quality became the main driver of these differences. For the first time, ratings were clearly embedded in pricing.
ARR projects rated BBB or higher averaged about $26 per credit. Lower-rated ARR projects averaged closer to $14. Unrated projects traded even lower. A similar pattern appeared in REDD+ credits.
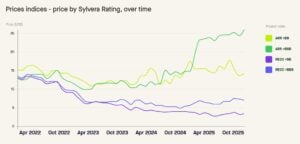
Co-benefits added another layer. Projects with strong biodiversity or community outcomes earned clear price premiums. Buyers were willing to pay more for credits that delivered visible social and environmental value beyond carbon.
In the forward market, prices looked very different. Offtake agreements signed in 2025 implied average prices of around $160 per credit. These prices reflect the high costs and limited supply of durable removals, not spot market conditions.
The result is a two-tier market. One tier is a fragmented spot market with wide price ranges. The other is a concentrated forward market built around high-integrity removals.
Investments and Movers: Who’s Driving the Market
Private investment in carbon removal companies between 2021 and 2025 reached approximately $3.6 billion, with direct air capture (DAC) attracting the largest share of capital over that period.
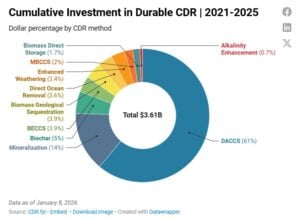
However, investment activity contracted in 2024 and continued into 2025, even as offtake deals expanded. This highlights a gap between commercial commitments and early‑stage funding scaling.
Major Corporate Buyers and Retirees
Corporate engagement shapes much of the 2025 retirement landscape. Several household names emerged as significant purchasers and retirees:
- Microsoft remained the single largest buyer of carbon removal credits, accounting for over 90% of removal volume in the first half of 2025.
- Energy and utility firms accounted for a sizable portion of total retirements, as indicated in broad market data on retiree sectors.
- While comprehensive ranked data for all major buyers in 2025 is not fully disclosed publicly, MSCI analysis of prior data indicates that energy companies, transport firms, and services sectors have historically been among the top retirees when disclosure is available.
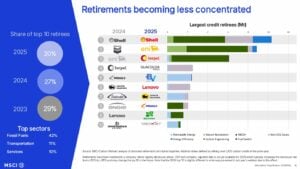
Regional retirements also suggest significant corporate participation from Asia, Europe, and North America. This reflects global corporate climate commitments.
Offtake Spotlight: Forward Deals Speak Louder Than Volumes
Offtake agreements were one of the clearest signals of future market direction in 2025.
The total value of offtake deals announced during the year reached about $12.25 billion, up from roughly $4 billion in 2024. This is more than 12 times the value of credits retired in the spot market.
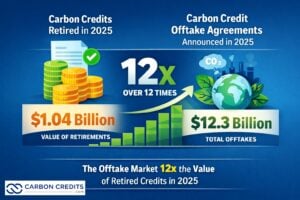
Yet the volumes involved remain modest. These deals are expected to deliver around 10 million credits per year through 2035. That is less than 10% of current annual retirements.
This gap matters. It shows that buyers are willing to commit large sums to secure limited volumes of high-quality supply. A small group of buyers dominates this space. Microsoft alone accounted for the vast majority of durable removal offtake volume in 2025.
These agreements serve two purposes. They secure future supply in a tight market. They also send strong price signals. If even a fraction of spot market demand shifts toward similar quality thresholds, total market value could grow significantly without higher volumes.
Integrity Meets Policy: Compliance and Ratings Reshape Value
Integrity concerns shaped much of the market’s evolution in 2025.
Buyers are no longer satisfied with claims alone. Ratings, improved methodologies, and third-party assessments now influence decisions. This shift is reinforced by policy.
Compliance and voluntary markets are converging. Credits that can meet compliance rules often command higher prices. This is especially true for credits eligible under CORSIA or aligned with ICVCM’s Core Carbon Principles.
In 2025, nearly half of all credits issued came from methodologies potentially eligible for CORSIA. This share continues to rise. At the same time, Article 6 moved from theory to practice. Twenty new bilateral deals were signed in 2025, bringing the total to over 100 agreements.
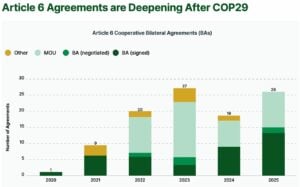
Moreover, corresponding adjustments emerged as a central issue. Credits with a corresponding adjustment are now clearly differentiated from those without. This distinction affects pricing, eligibility, and long-term demand. Some analysts expect corresponding adjustments to become a tradable element of the market.
Policy signals also strengthened corporate demand. Draft updates to the SBTi Net-Zero Standard clarified how credits can be used alongside emissions reductions. This reduced uncertainty for buyers planning long-term strategies.
The Outlook for 2026 and Beyond
The near-term outlook points to a tighter and more complex market.
In 2026, supply constraints for high-quality credits are likely to persist. New issuances are not rising fast enough to meet demand for BBB+ credits. Prices for trusted nature-based projects are likely to remain firm or increase.
Compliance demand will continue to grow. Modeling suggests compliance use could exceed voluntary demand as early as 2027, driven by CORSIA Phase 1 and expanding domestic systems. By the mid-2030s, domestic compliance markets could become the largest source of demand.
Carbon removal credits will remain scarce in the short term. Actual retirements will lag commitments. However, investment and offtakes signal strong long-term growth. As methodologies mature and costs fall, removals will play a larger role in both voluntary and compliance settings.
The carbon credit market in 2025 did not collapse. It restructured.
For the market as a whole, the direction is clear. Volume alone no longer defines maturity. Quality, integrity, and policy alignment do. Buyers became more selective and prices began to reflect integrity. Policy moved closer to implementation. Offtake deals revealed long-term expectations.
The carbon credit market of 2026 and beyond will likely be smaller in volume than past projections, but higher in value, more regulated, and more closely tied to real climate outcomes.
- FURTHER READING: Top Carbon Credit Companies to Watch in 2026
The post The Carbon Credit Market in 2025 is A Turning Point: What Comes Next for 2026 and Beyond? appeared first on Carbon Credits.

EU carbon credit claims changed on 27 September 2026, the day the Directive (EU) 2024/825 began to apply across the European Union. The change is narrow. It changes how a company can talk about the credits it buys. A product can no longer be called neutral on the strength of compensation alone; however, every specific, evidenced statement about what a company measured, reduced, and funded stays fully available.

The post Promoting Improved Cooking Practices in Nigeria appeared first on Terrapass.



-
Climate Change1 year ago
Guest post: Why China is still building new coal – and when it might stop
-

 Greenhouse Gases2 years ago
嘉宾来稿:满足中国增长的用电需求 光伏加储能“比新建煤电更实惠”
-
Greenhouse Gases1 year ago
Guest post: Why China is still building new coal – and when it might stop
-

 Climate Change2 years ago
嘉宾来稿:满足中国增长的用电需求 光伏加储能“比新建煤电更实惠”