

The degradation of trees at the edges of tropical forests is more widespread than previously thought, according to new research.
The study, published in Nature, explains that trees near deforested or degraded areas of the forest are more vulnerable to drought, as well as to human activity such as logging. These “edge effects” are measurable up to 1.5km into the forest, the authors find.
This is an “amazing result”, a study author tells Carbon Brief, because previous studies detected these effects only within the first 120 metres of the forest edge. The new figure indicates that 18% of the remaining tropical moist forests are impacted by edge effects – an area more than 200% larger than previously estimated.
Experts not involved in the study tell Carbon Brief that quantifying tropical forest degradation is “frustratingly elusive”. And while some praise the methods used in the paper, others advise caution when interpreting the conclusions.
Two Brazilian scientists also tell Carbon Brief that the study overlooks important work from institutions in the global south who are also working on this problem. They advise that scientists from local groups should be invited to contribute to research in this area.
Forest height
Tropical forests account for around 45% of forest cover globally. These forests are well-known for their high biodiversity and the crucial ecosystem services that they provide. They also hold around one-quarter of all land-based carbon.
The new study assesses how deforestation and degradation affect “moist tropical forests” – tropical forests in the equatorial belt with a fairly consistent annual temperature and high levels of rainfall. Tropical dry forests and deciduous forests are not included in the analysis.
Research shows that around 17% of tropical moist forests disappeared over 1990-2021, largely due to human activity such as logging and fires. Of the 1,071m hectares that remained globally in 2019, around 10% were degraded, the new study says. This means that they suffered human-induced “disturbances” that led to a partial loss of their tree cover or function.
Furthermore, trees at the edges of tropical forests have higher mortality rates than trees in the centre, because they are more exposed to disturbances such as fire and drought. When intact forest landscapes become fragmented – for example, due to logging, fire, drought or the construction of roads into the forest – these “edge effects” can lead to further forest degradation.
The authors use data collected by the Global Ecosystem Dynamics Investigation (GEDI) instrument on the International Space Station to assess the forest structure – such as canopy height and aboveground biomass – over the past four years.
To measure canopy height, the authors calculate the “RH98” value – the height of the top of the canopy or the nearest tallest vegetation in the area. This is an important measure of forest health and maturity. Aboveground biomass measures the aboveground woody biomass per unit area and is also a good measure of forest health.
They combine this with data from the Tropical Moist Forest dataset, which uses Landsat satellite imagery to show how tropical moist forests have changed over 1990-2022.
The plot below shows the canopy height for different types of moist tropical forests. The rows show intact forests at least 3km from a forest edge (top row), degraded forests (second row), the edges of forests (third row) and forest regrowth (bottom row), as shown in the maps below.
Darker blues indicate taller forest canopies. The map shows where the forests are located, and the bar charts on the right hand side show the overall distribution of different tree heights.

The tallest intact moist tropical forests are found in south-east Asia, where the average canopy height is 34m, the study finds. West and central Africa and Central and South America have average forest heights of 29m. This is because intact tropical forests in Asia, which are typically dominated by “hardwood wind-dispersed species”, are typically taller, the authors say.
The map also shows that degraded forests, forest edges and areas of forest growth have a greater proportion of shorter trees on average.
The forest edge
The study investigates two different types of forest edge effects, exploring how areas of deforested and degraded land impact nearby trees.
Dr Lilian Blanc is an author on the study and researcher at the French Agricultural Research Centre for International Development. He tells Carbon Brief that the effect of nearby degraded land “was not considered in previous studies”.
The graphs below show how areas of deforested land affect tree canopy height. The charts at the top show the average distribution of canopy heights of undisturbed forests in the Americas, Africa and Asia. The line colours indicate the distance of those trees from the forest edge, with yellow indicating a short distance and blue indicating a large distance.
The bottom map shows how far into the forest edge effects are present, by measuring the distance from the forest edge at which the height of the forest reaches 95% of the height of the intact, undisturbed forest.

The authors find the greatest edge effects from deforestation along the “forestation fronts of the Amazon”, in Borneo and Sumatra coasts marked by high fragmentation levels, and on the borders of the Congo basin.
They also record a decrease in canopy height up to 350, 400 and 1,500 metres from the deforested edge in the Americas, Africa and Asia, respectively.
The authors find that within 120 metres of trees that have been degraded due to logging and burning, the average canopy height in undisturbed forests is 15% and 22% lower, respectively.
The authors also investigate how quickly the forest can recover from logging and fires, concluding that while there is “fast regrowth of pioneer and understory species”, there is “no significant recovery in canopy height in the 30 years following the creation of a forest edge”.
Forest degradation can also increase the likelihood of deforestation, the authors say. They warn that forest height and distance to the edge of the forest are “strong predictors of deforestation”, as forest fragmentation makes the interior of the forest more accessible to loggers.
It adds that there has been selective logging 500 metres from the forest edge in Africa and the Americas, and even deeper in Asia.
Agriculture and road expansion trigger a 20-30% reduction in canopy height and biomass at the forest edge, with “persistent effects” measurable up to 1.5km inside the forest, the authors find. Blanc tells Carbon Brief that this is “an amazing result” as previous studies only looked for edge effects up to 120 metres from the forest edge.
The authors also calculated the edge effect using total above ground woody biomass, instead of canopy height. Using this metric, the authors conclude that the total area of forest with this edge effect is 18% of total global forest area in 2022 – an area more than 200% larger than previously estimated.
Prof Simon Lewis – a professor of global change science at University College London’s department of geography – tells Carbon Brief that this is a “striking new result”.
It implies that “the negative impacts on remaining forest from the creation of forest edges are much more extensive than has been commonly documented”. It also means that “forest protection of large blocks of forest is going to be more important than we previously thought”, he says.
Overall, the study is “an important step forward in monitoring forest disturbance, which is a very tough problem”, Lewis says. However, he adds that “care is needed” when looking at some of the observational data, saying that he “trust[s] the broad patterns of biomass loss following logging, edge creation and fires, but not the specific biomass loss values from these disturbances”.
Dr Peter Potapov – a researcher in the department of geographical sciences at the University of Maryland, whose work was cited extensively in the new study – says “the conclusion that edge effects are degrading 18% of the remaining humid tropical forest is an overstatement”.
He says that forest degradation depends on other factors, such as land-use regulations, and argues that “the assumption that all forests 1.5km away from the edges are degraded may undermine ongoing conservation efforts.
Expert response
These comments reflect the mixed response that the new study has received.
Prof Matthew Hansen – a remote sensing scientist at the University of Maryland’s department of geography – tells Carbon Brief that forest degradation is “a frustratingly elusive dynamic to quantify”. However, he praises the study for being “very clear and ambitious”.
Potapov, who has published research with Hansen, tells Carbon Brief that the results broadly confirm existing findings, but warns that there are some “major limitations” with the study.
For example, he says the method does not include a “matching technique” to separate the effect of human management on tree height from the natural factors such as elevation, soil quality and floods. He also warns that the observations “failed to correctly map anthropogenic disturbances in humid tropical forests”, adding:
“The authors greatly underestimate selective logging in Gabon, while the natural non-fire disturbances like river meandering and windfalls in South America were probably treated as human-caused degradation.”
Dr Flávia de Souza Mendes, a programme manager in forest and land use at satellite imagery firm Planet Labs, says the study is “well written”. However, she laments that “there are several local groups from the global south that have been studying this topic and are not part of this study”. She suggests that scientists carrying out similar studies should “invite more local researchers to take part”.
She also tells Carbon Brief that this paper “did not take into account studies carried out by local researchers on the relationship between degradation and deforestation”.
For example, she highlights a report by Brazilian researchers which finds that, in some regions of the Amazon, 86% of degraded areas were not subsequently cleared in the following decades. This is not in line with the findings of the new study, where degradation “has a crucial role in predicting future deforestation”, she says.
Prof Celso Silva-Junior – a research scientist in amazon ecology and remote sensing at Brazil’s Universidade Federal do Maranhão – tells Carbon Brief that the study “reproduces the findings of our research group, which has been investigating large-scale forest edge effects, using remote sensing technologies, since 2016”.
He says that the paper’s findings concerning biomass loss beyond 120 metres from the forest edge are “critical”. However, he emphasises the importance of the “local knowledge of tropical scientists” who are “deeply involved in the establishment of the conceptual framework for treating this relevant problem”.


The post Tropical forest degradation due to ‘edge effects’ is 200% higher than thought appeared first on Carbon Brief.
Tropical forest degradation due to ‘edge effects’ is 200% higher than thought

Drought and heatwaves occurring together – known as “compound” events – have “surged” across the world since the early 2000s, a new study shows.
Compound drought and heat events (CDHEs) can have devastating effects, creating the ideal conditions for intense wildfires, such as Australia’s “Black Summer” of 2019-20 where bushfires burned 24m hectares and killed 33 people.
The research, published in Science Advances, finds that the increase in CDHEs is predominantly being driven by events that start with a heatwave.
The global area affected by such “heatwave-led” compound events has more than doubled between 1980-2001 and 2002-23, the study says.
The rapid increase in these events over the last 23 years cannot be explained solely by global warming, the authors note.
Since the late 1990s, feedbacks between the land and the atmosphere have become stronger, making heatwaves more likely to trigger drought conditions, they explain.
One of the study authors tells Carbon Brief that societies must pay greater attention to compound events, which can “cause severe impacts on ecosystems, agriculture and society”.
Compound events
CDHEs are extreme weather events where drought and heatwave conditions occur simultaneously – or shortly after each other – in the same region.
These events are often triggered by large-scale weather patterns, such as “blocking” highs, which can produce “prolonged” hot and dry conditions, according to the study.
Prof Sang-Wook Yeh is one of the study authors and a professor at the Ewha Womans University in South Korea. He tells Carbon Brief:
“When heatwaves and droughts occur together, the two hazards reinforce each other through land-atmosphere interactions. This amplifies surface heating and soil moisture deficits, making compound events more intense and damaging than single hazards.”
CDHEs can begin with either a heatwave or a drought.
The sequence of these extremes is important, the study says, as they have different drivers and impacts.
For example, in a CDHE where the heatwave was the precursor, increased direct sunshine causes more moisture loss from soils and plants, leading to a drought.
Conversely, in an event where the drought was the precursor, the lack of soil moisture means that less of the sun’s energy goes into evaporation and more goes into warming the Earth’s surface. This produces favourable conditions for heatwaves.
The study shows that the majority of CDHEs globally start out as a drought.
In recent years, there has been increasing focus on these events due to the devastating impact they have on agriculture, ecosystems and public health.
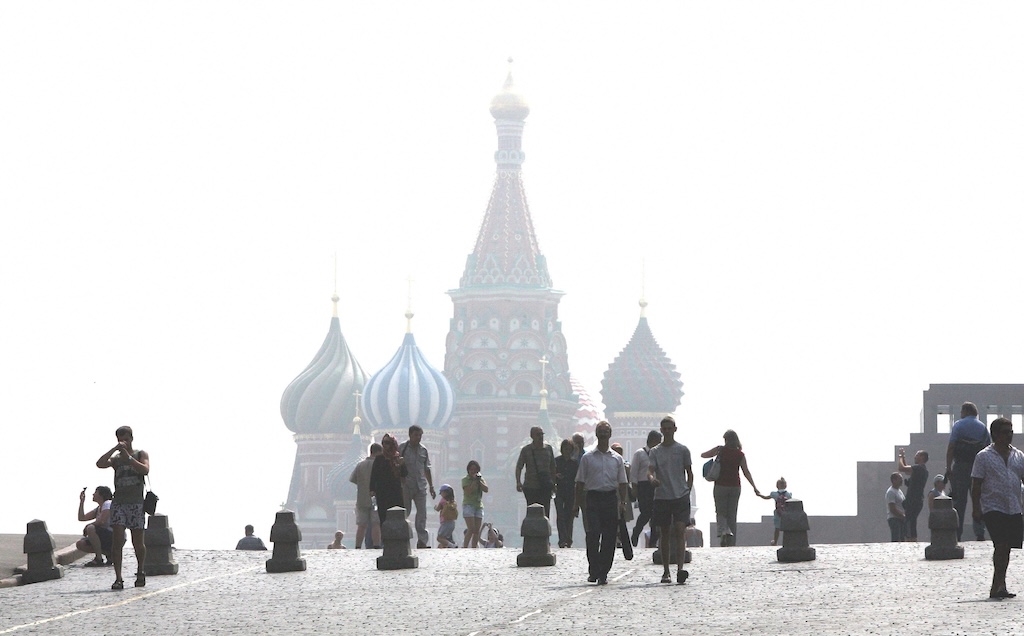
In Russia in the summer of 2010, a compound drought-heatwave event – and the associated wildfires – caused the death of nearly 55,000 people, the study notes.
The record-breaking Pacific north-west “heat dome” in 2021 triggered extreme drought conditions that caused “significant declines” in wheat yields, as well as in barley, canola and fruit production in British Columbia and Alberta, Canada, says the study.
Increasing events
To assess how CDHEs are changing, the researchers use daily reanalysis data to identify droughts and heatwaves events. (Reanalysis data combines past observations with climate models to create a historical climate record.) Then, using an algorithm, they analyse how these events overlap in both time and space.
The study covers the period from 1980 to 2023 and the world’s land surface, excluding polar regions where CDHEs are rare.
The research finds that the area of land affected by CDHEs has “increased substantially” since the early 2000s.
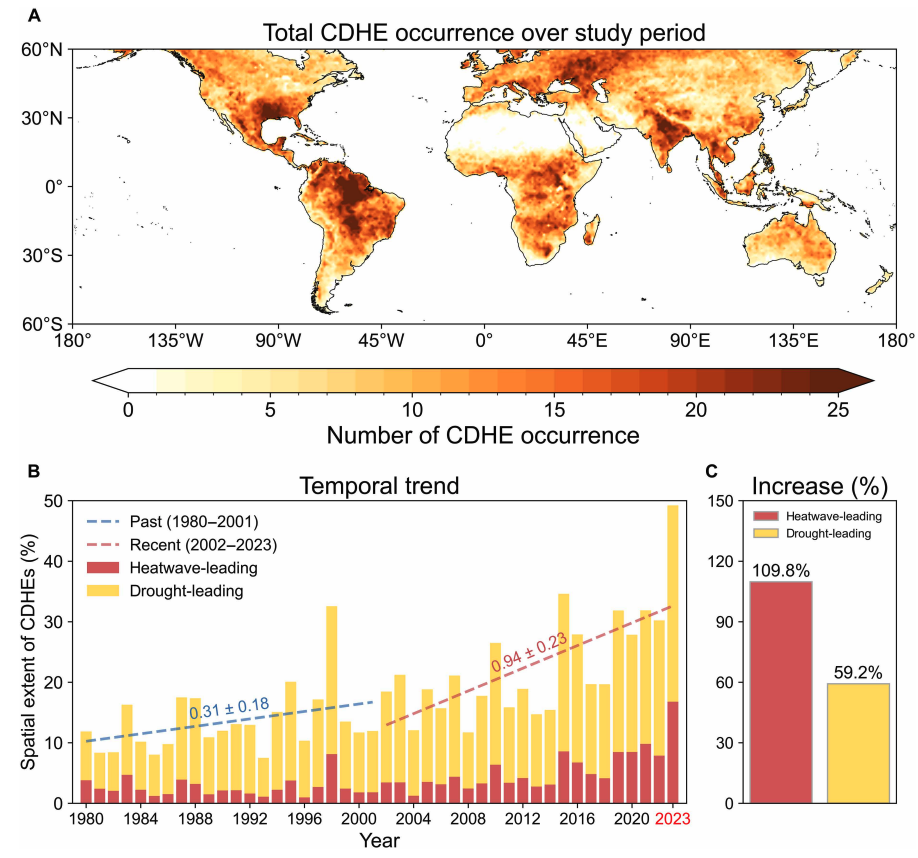
Heatwave-led events have been the main contributor to this increase, the study says, with their spatial extent rising 110% between 1980-2001 and 2002-23, compared to a 59% increase for drought-led events.
The map below shows the global distribution of CDHEs over 1980-2023. The charts show the percentage of the land surface affected by a heatwave-led CDHE (red) or a drought-led CDHE (yellow) in a given year (left) and relative increase in each CDHE type (right).
The study finds that CDHEs have occurred most frequently in northern South America, the southern US, eastern Europe, central Africa and south Asia.
Threshold passed
The authors explain that the increase in heatwave-led CDHEs is related to rising global temperatures, but that this does not tell the whole story.
In the earlier 22-year period of 1980-2001, the study finds that the spatial extent of heatwave-led CDHEs rises by 1.6% per 1C of global temperature rise. For the more-recent period of 2022-23, this increases “nearly eightfold” to 13.1%.
The change suggests that the rapid increase in the heatwave-led CDHEs occurred after the global average temperature “surpasse[d] a certain temperature threshold”, the paper says.
This threshold is an absolute global average temperature of 14.3C, the authors estimate (based on an 11-year average), which the world passed around the year 2000.
Investigating the recent surge in heatwave-leading CDHEs further, the researchers find a “regime shift” in land-atmosphere dynamics “toward a persistently intensified state after the late 1990s”.
In other words, the way that drier soils drive higher surface temperatures, and vice versa, is becoming stronger, resulting in more heatwave-led compound events.
Daily data
The research has some advantages over other previous studies, Yeh says. For instance, the new work uses daily estimations of CDHEs, compared to monthly data used in past research. This is “important for capturing the detailed occurrence” of these events, says Yeh.
He adds that another advantage of their study is that it distinguishes the sequence of droughts and heatwaves, which allows them to “better understand the differences” in the characteristics of CDHEs.
Dr Meryem Tanarhte is a climate scientist at the University Hassan II in Morocco, and Dr Ruth Cerezo Mota is a climatologist and a researcher at the National Autonomous University of Mexico. Both scientists, who were not involved in the study, agree that the daily estimations give a clearer picture of how CDHEs are changing.
Cerezo-Mota adds that another major contribution of the study is its global focus. She tells Carbon Brief that in some regions, such as Mexico and Africa, there is a lack of studies on CDHEs:
“Not because the events do not occur, but perhaps because [these regions] do not have all the data or the expertise to do so.”
However, she notes that the reanalysis data used by the study does have limitations with how it represents rainfall in some parts of the world.
Compound impacts
The study notes that if CDHEs continue to intensify – particularly events where heatwaves are the precursors – they could drive declining crop productivity, increased wildfire frequency and severe public health crises.
These impacts could be “much more rapid and severe as global warming continues”, Yeh tells Carbon Brief.
Tanarhte notes that these events can be forecasted up to 10 days ahead in many regions. Furthermore, she says, the strongest impacts can be prevented “through preparedness and adaptation”, including through “water management for agriculture, heatwave mitigation measures and wildfire mitigation”.
The study recommends reassessing current risk management strategies for these compound events. It also suggests incorporating the sequences of drought and heatwaves into compound event analysis frameworks “to enhance climate risk management”.
Cerezo-Mota says that it is clear that the world needs to be prepared for the increased occurrence of these events. She tells Carbon Brief:
“These [risk assessments and strategies] need to be carried out at the local level to understand the complexities of each region.”




The post Heatwaves driving recent ‘surge’ in compound drought and heat extremes appeared first on Carbon Brief.
Heatwaves driving recent ‘surge’ in compound drought and heat extremes
Greenhouse Gases
DeBriefed 6 March 2026: Iran energy crisis | China climate plan | Bristol’s ‘pioneering’ wind turbine
Welcome to Carbon Brief’s DeBriefed.
An essential guide to the week’s key developments relating to climate change.
This week
Energy crisis
ENERGY SPIKE: US-Israeli attacks on Iran and subsequent counterattacks across the Middle East have sent energy prices “soaring”, according to Reuters. The newswire reported that the region “accounts for just under a third of global oil production and almost a fifth of gas”. The Guardian noted that shipping traffic through the strait of Hormuz, which normally ferries 20% of the world’s oil, “all but ground to a halt”. The Financial Times reported that attacks by Iran on Middle East energy facilities – notably in Qatar – triggered the “biggest rise in gas prices since Russia’s full-scale invasion of Ukraine”.
‘RISK’ AND ‘BENEFITS’: Bloomberg reported on increases in diesel prices in Europe and the US, speculating that rising fuel costs could be “a risk for president Donald Trump”. US gas producers are “poised to benefit from the big disruption in global supply”, according to CNBC. Indian government sources told the Economic Times that Russia is prepared to “fulfil India’s energy demands”. China Daily quoted experts who said “China’s energy security remains fundamentally unshaken”, thanks to “emergency stockpiles and a wide array of import channels”.
‘ESSENTIAL’ RENEWABLES: Energy analysts said governments should cut their fossil-fuel reliance by investing in renewables, “rather than just seeking non-Gulf oil and gas suppliers”, reported Climate Home News. This message was echoed by UK business secretary Peter Kyle, who said “doubling down on renewables” was “essential” amid “regional instability”, according to the Daily Telegraph.
China’s climate plan
PEAK COAL?: China has set out its next “five-year plan” at the annual “two sessions” meeting of the National People’s Congress, including its climate strategy out to 2030, according to the Hong Kong-based South China Morning Post. The plan called for China to cut its carbon emissions per unit of gross domestic product (GDP) by 17% from 2026 to 2030, which “may allow for continued increase in emissions given the rate of GDP growth”, reported Reuters. The newswire added that the plan also had targets to reach peak coal in the next five years and replace 30m tonnes per year of coal with renewables.
ACTIVE YET PRUDENT: Bloomberg described the new plan as “cautious”, stating that it “frustrat[es] hopes for tighter policy that would drive the nation to peak carbon emissions well before president Xi Jinping’s 2030 deadline”. Carbon Brief has just published an in-depth analysis of the plan. China Daily reported that the strategy “highlights measures to promote the climate targets of peaking carbon dioxide emissions before 2030”, which China said it would work towards “actively yet prudently”.
Around the world
- EU RULES: The European Commission has proposed new “made in Europe” rules to support domestic low-carbon industries, “against fierce competition from China”, reported Agence France-Presse. Carbon Brief examined what it means for climate efforts.
- RECORD HEAT: The US National Oceanic and Atmospheric Administration has said there is a 50-60% chance that the El Niño weather pattern could return this year, amplifying the effect of global warming and potentially driving temperatures to “record highs”, according to Euronews.
- FLAGSHIP FUND: The African Development Bank’s “flagship clean energy fund” plans to more than double its financing to $2.5bn for African renewables over the next two years, reported the Associated Press.
- NO WITHDRAWAL: Vanuatu has defied US efforts to force the Pacific-island nation to drop a UN draft resolution calling on the world to implement a landmark International Court of Justice (ICJ) ruling on climate, according to the Guardian.
98
The number of nations that submitted their national reports on tackling nature loss to the UN on time – just half of the 196 countries that are part of the UN biodiversity treaty – according to analysis by Carbon Brief.
Latest climate research
- Sea levels are already “much higher than assumed” in most assessments of the threat posed by sea-level rise, due to “inadequate” modelling assumptions | Nature
- Accelerating human-caused global warming could see the Paris Agreement’s 1.5C limit crossed before 2030 | Geophysical Research Letters covered by Carbon Brief
- Future “super El Niño events” could “significantly lower” solar power generation due to a reduction in solar irradiance in