

As 2026 passes its halfway point, the world is watching one of the most rapidly intensifying El Niño events in the modern record take shape in the tropical Pacific.
The developing El Niño is boosting expectations for global temperatures, both this year and next.
El Niño is the warm phase of a recurring climate pattern in the tropical Pacific that releases heat from the ocean into the atmosphere, temporarily raising global temperatures and reshaping rainfall and extreme weather around the world.
Carbon Brief’s “state of the climate” report in April gave 2026 a 19% chance of setting a new global temperature record.
That chance now stands at 35% – a near-doubling in four months – with virtually all of the change driven by ever-stronger El Niño forecasts.
The key findings from the first half of 2026 include:
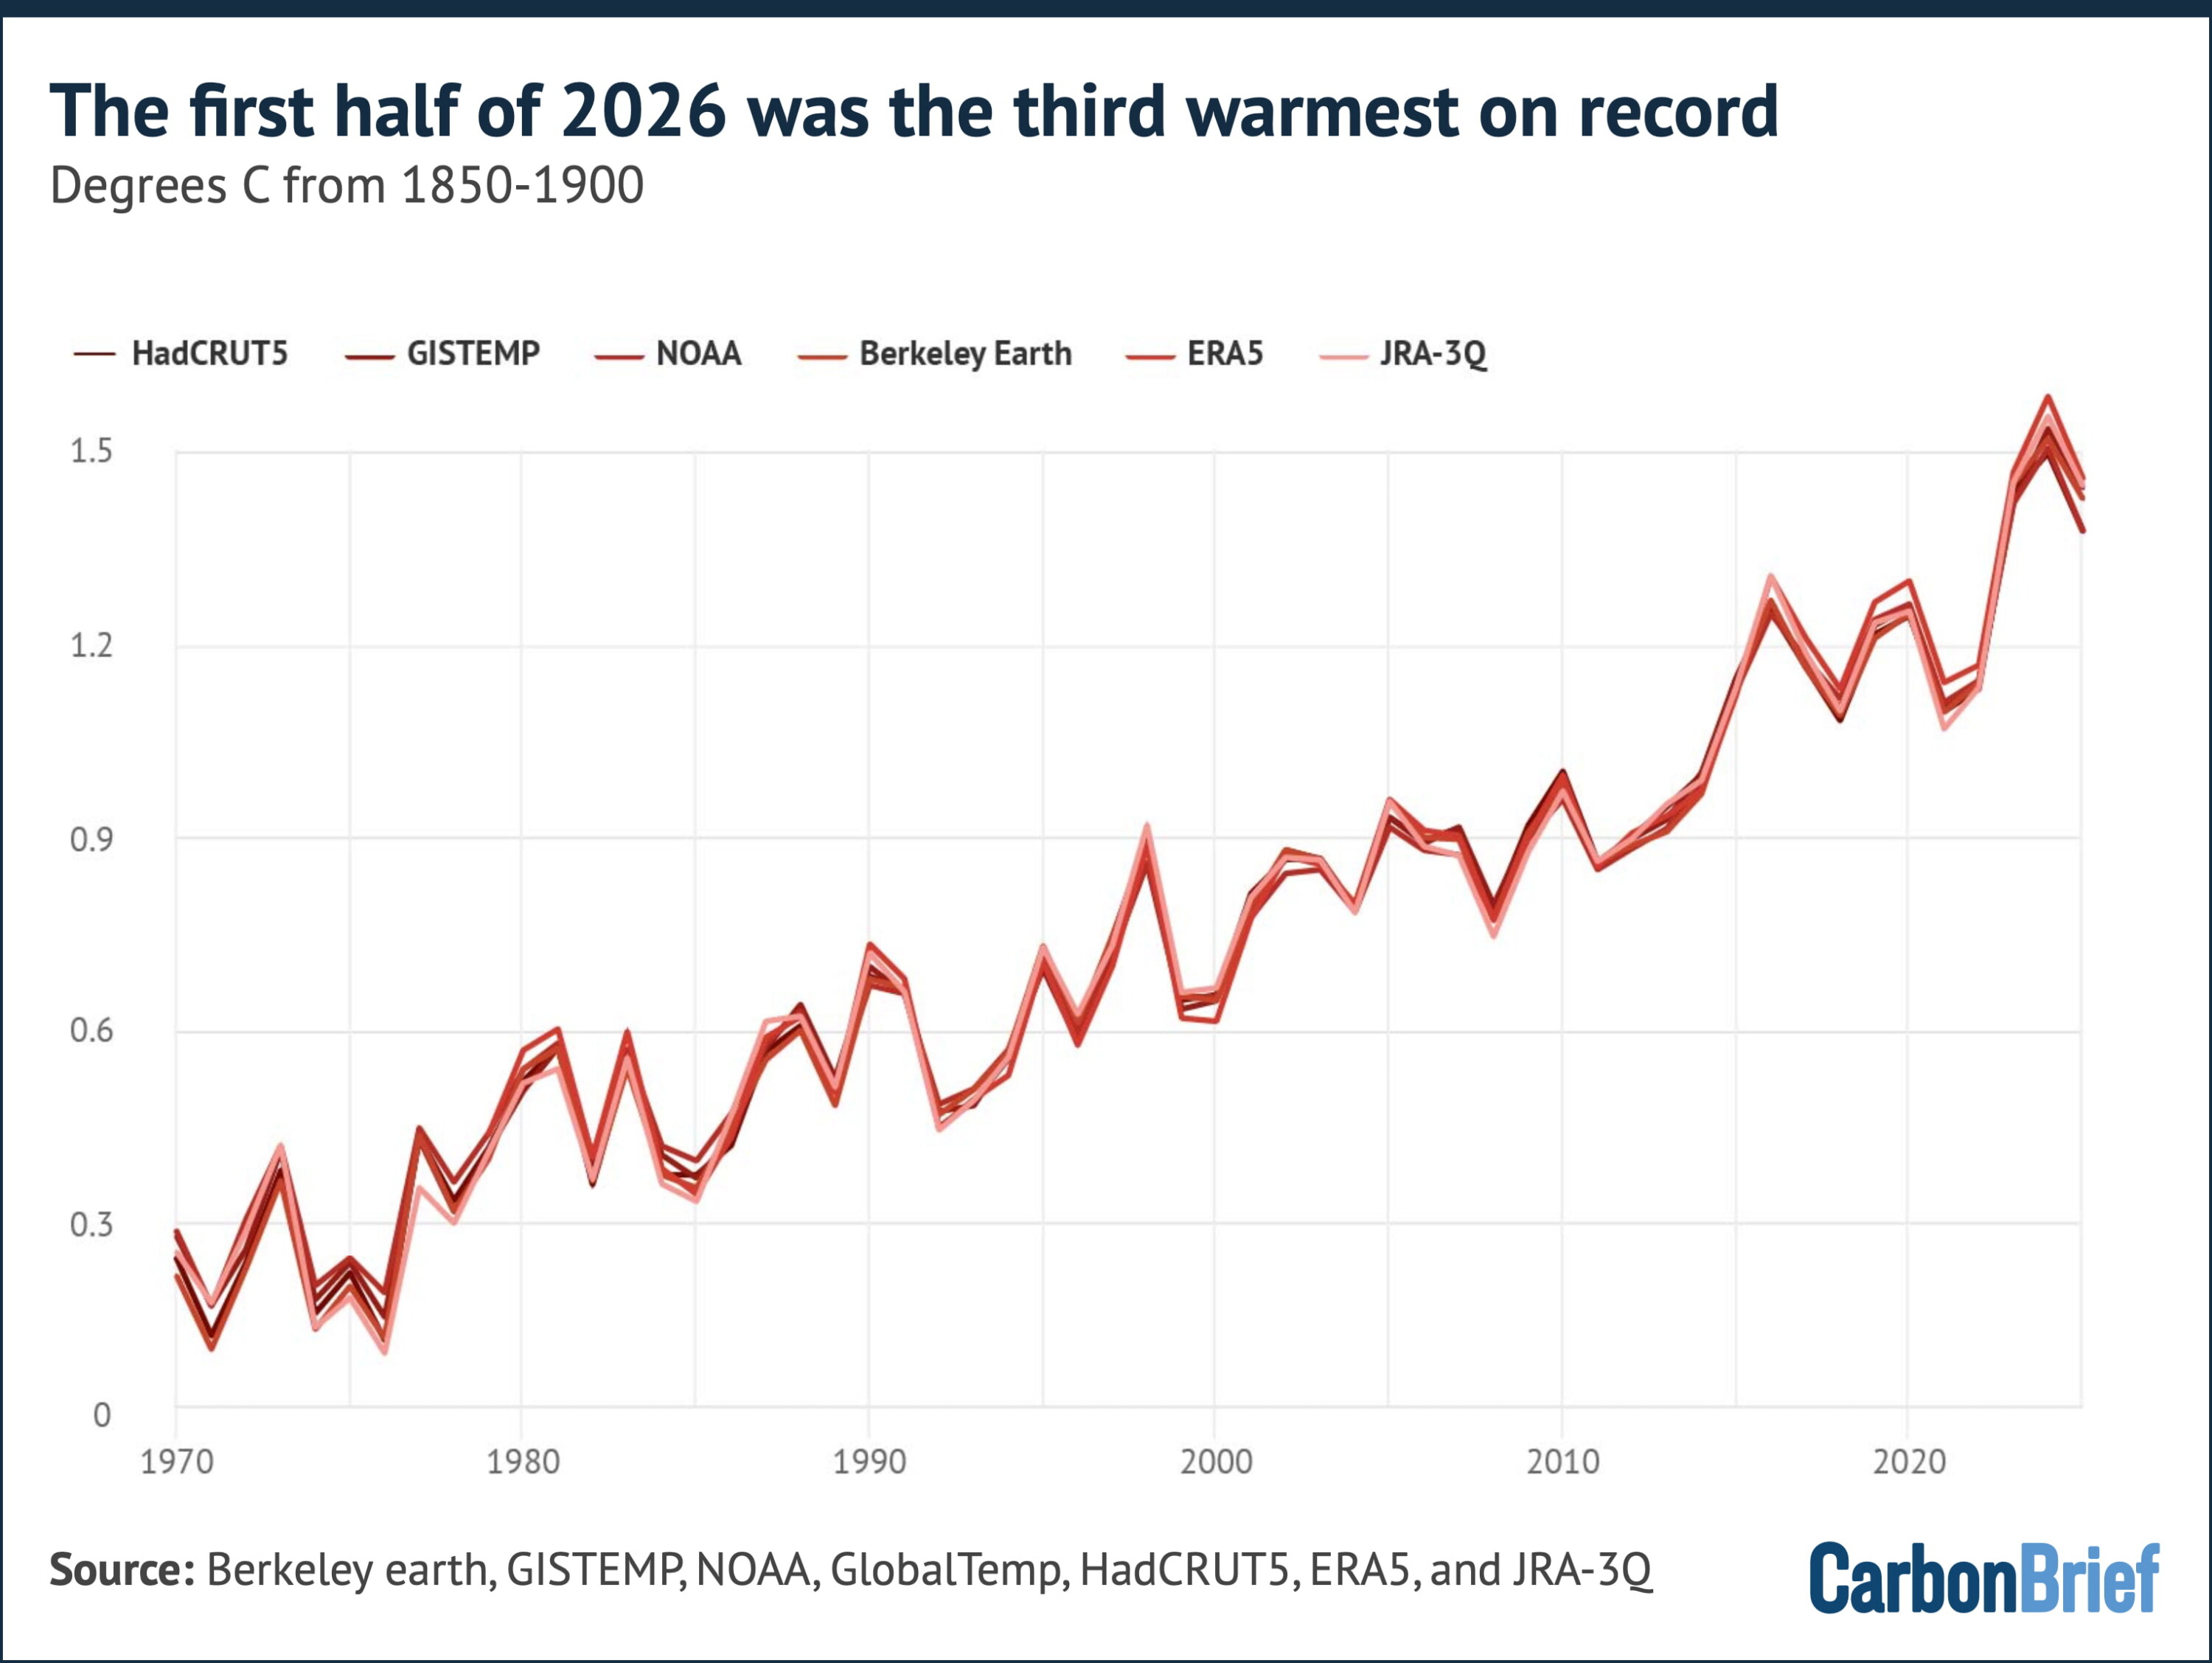
- The first six months of 2026 were the third-warmest start to a year on record – around 1.4C above pre-industrial levels – behind only 2024 and 2025.
- While the first few months of the year came in as the fourth or fifth warmest, both May and June were the second-warmest ever recorded as El Niño conditions took hold.
- El Niño conditions arrived in April and reached the threshold for a “strong” event by June, when the Niño3.4 index reached 1.6C. Of the 667 model runs Carbon Brief examined, 91% project a peak later this year that is above the strongest El Niño in history.
- The chance that 2026 beats 2024 as the warmest year on record has risen to 35%. Carbon Brief’s central estimate remains that 2026 will be the second-warmest year, at around 1.51C above pre-industrial levels.
- Whether 2026 sets a record will depend on the dataset: the odds range from around two-in-three in NASA and Berkeley Earth data to around two-in-10 in ERA5 and one-in-10 in the JRA-3Q reanalyses.
- June 2026 was western Europe’s hottest June on record, amid a heatwave that set hundreds of individual records. Nearly 9% of the world’s surface saw record June warmth.
- The developing El Niño will have its largest impact on 2027, which Carbon Brief projects to be around 1.7C above pre-industrial levels – this would comfortably set a new record for the warmest year.
- Arctic sea ice has spent 39 days of 2026 so far at, or below, record daily lows following its joint-lowest winter maximum in the satellite era.
Third-warmest start to a year
Carbon Brief analyses records from six different groups that report global surface temperatures: NASA GISTEMP, NOAA GlobalTemp, Hadley/UEA HadCRUT5, Berkeley Earth, Copernicus/ECMWF ERA5 and the JMA JRA-3Q reanalysis.
The first half of 2026 was the third warmest on record in every one of the six datasets, behind only 2024 and 2025. The figure below shows annual temperatures since 1970, along with the 2026 year-to-date average (January-June) for each group.
January 2026 was only the fourth- or fifth-warmest January on record, as lingering weak La Niña conditions suppressed temperatures. Since then, each month has climbed the rankings.
La Niña is the cool phase of the El Niño-Southern Oscillation (ENSO). It typically brings wetter conditions to Australia, Indonesia and equatorial South America and drier conditions to the southern US.
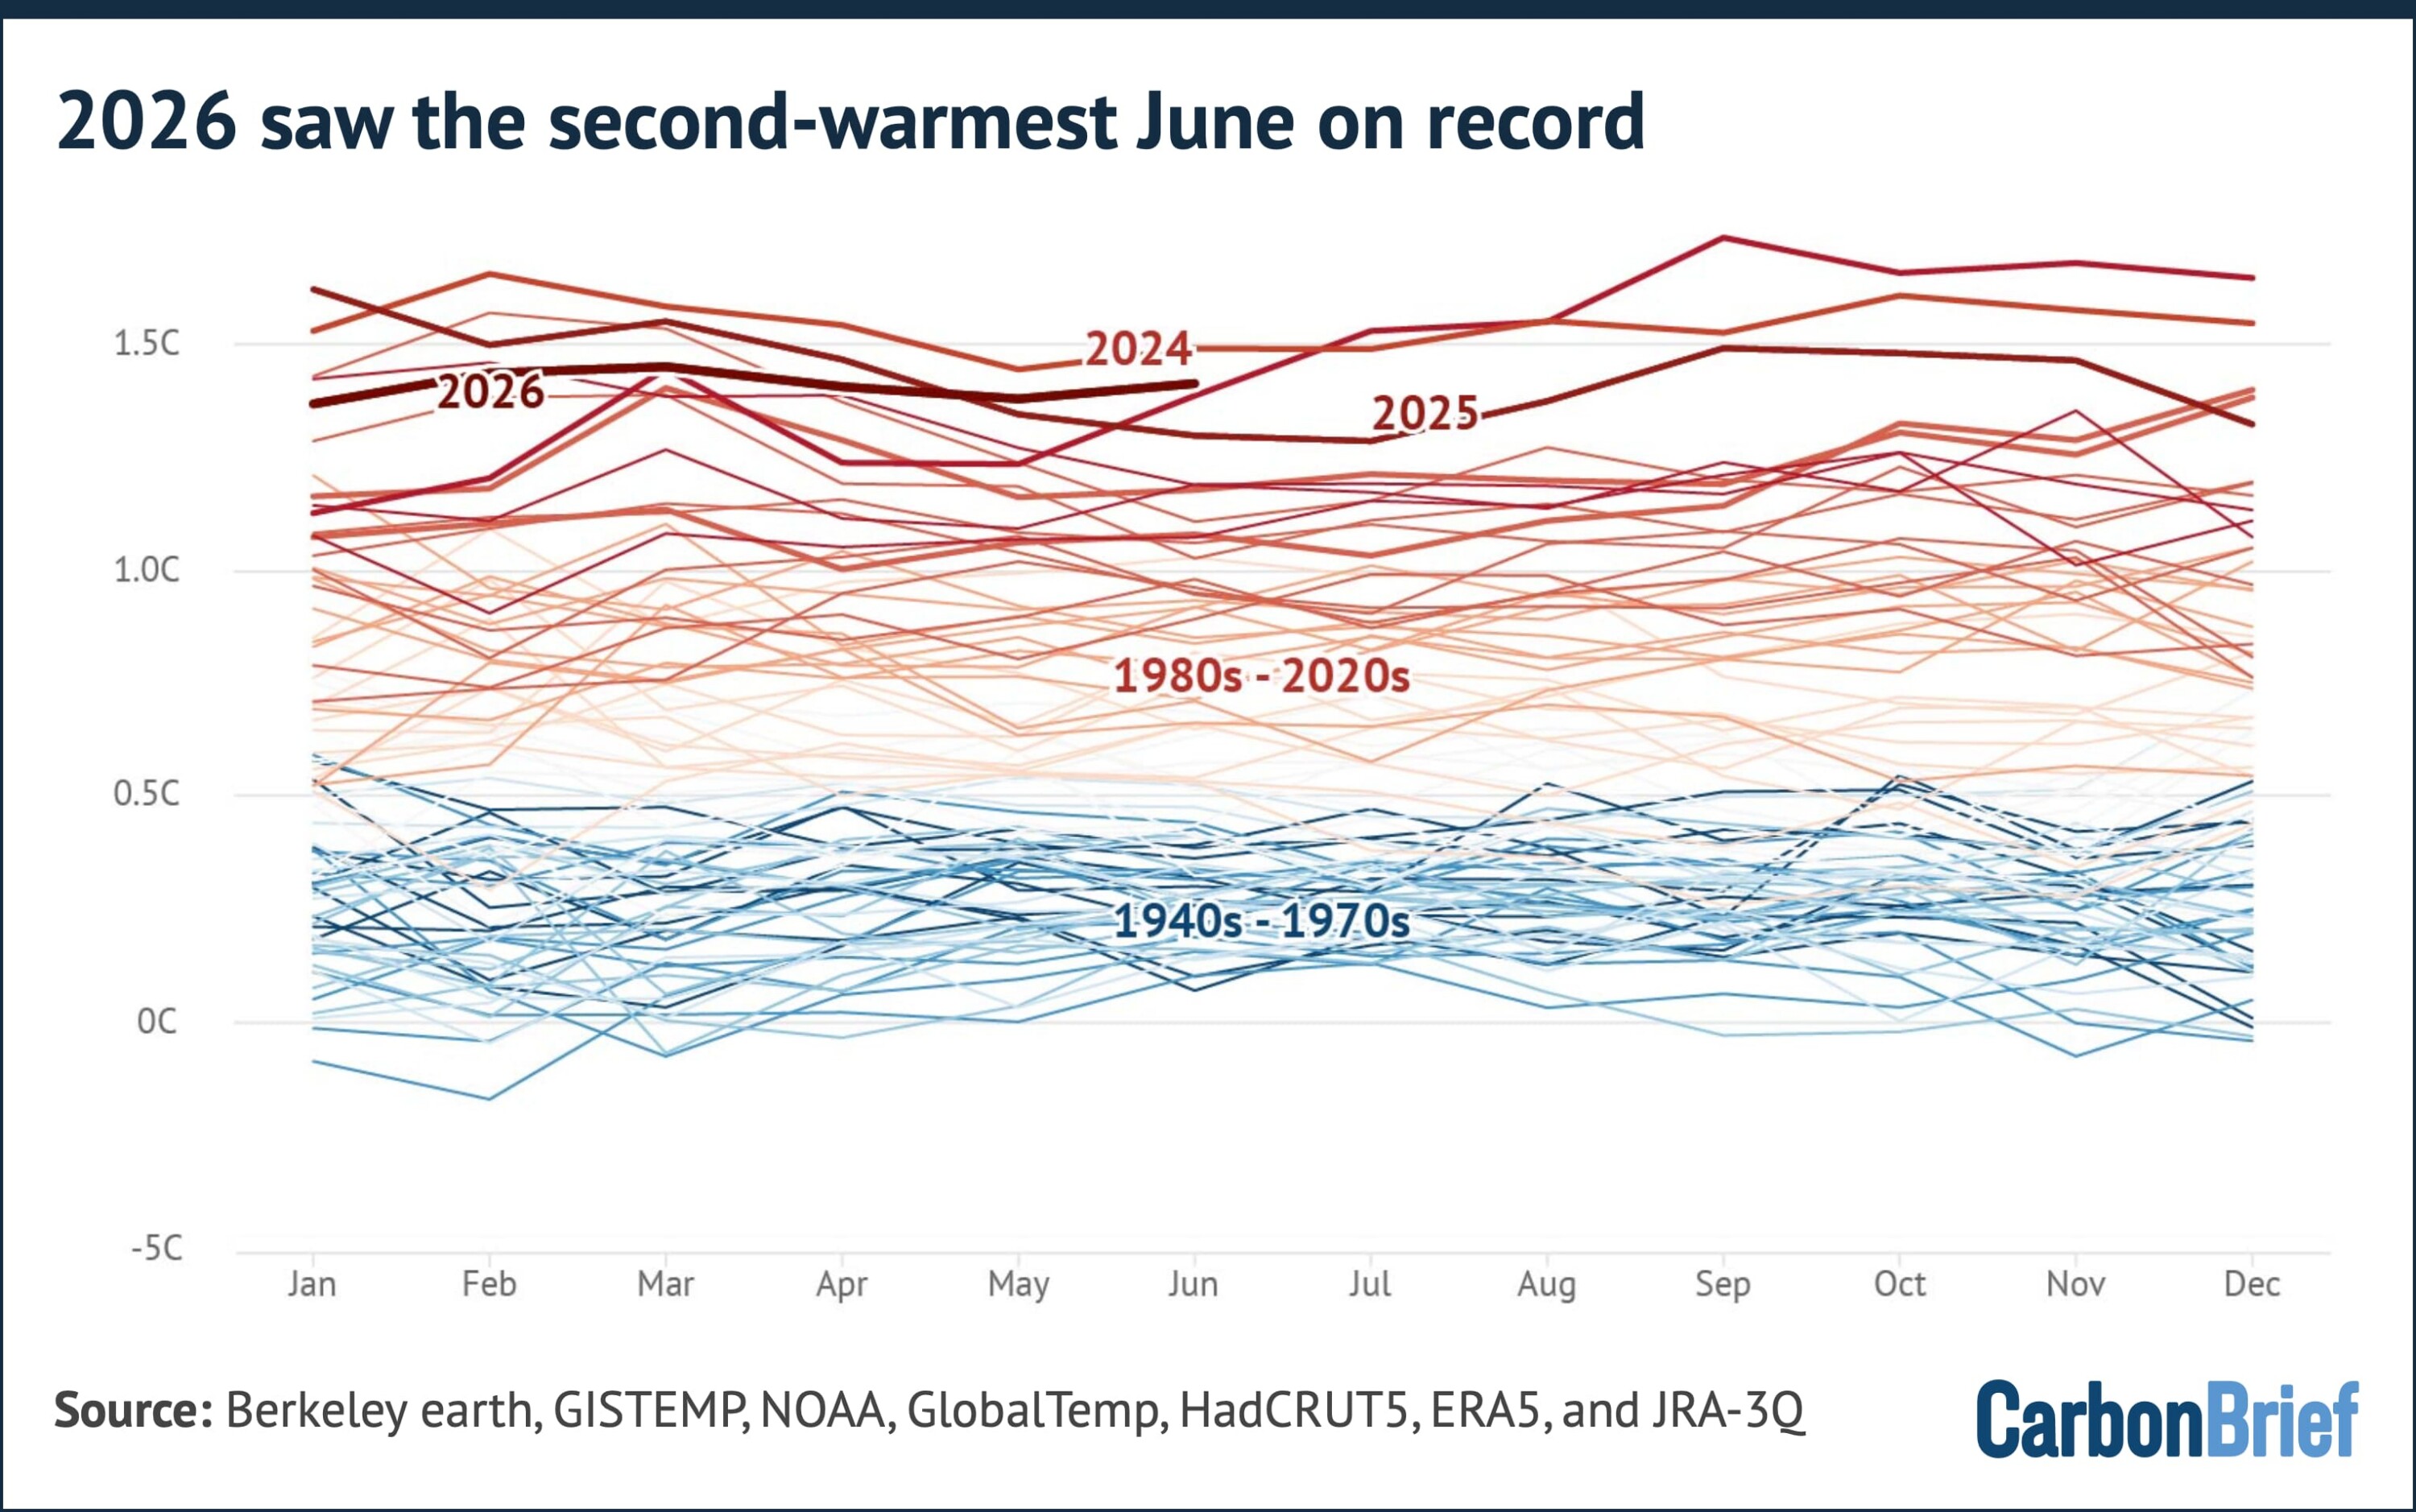
March was second-to-fourth warmest across datasets, April the third and both May and June were the second warmest ever recorded, behind only the corresponding months of 2024.
The chart below shows how June 2026 (thick red line) came in around 0.08C below the June record set in 2024 in the average of the six datasets.
Meanwhile, Copernicus reported that global sea surface temperatures over the ice-free oceans set a new June record.
A record-breaking El Niño
ENSO is the largest source of year-to-year variability in global temperatures.
The most common way to assess the strength of an El Niño or La Niña event is by looking at the sea surface temperature anomaly in the “Niño3.4” region of the tropical Pacific.
El Niño and its sister La Niña occur when temperatures in the tropical Pacific are more than 0.5C (El Niño) or less than 0.5C (La Niña) below normal, where normal is defined by removing the effects of long-term climate change.
The thresholds for defining the strength of an El Niño or La Niña are above/below 1C for “moderate” events, 1.5C for “strong” events and 2C for “very strong” (or “super”) events.
After two years dominated by La Niña conditions, the tropical Pacific flipped decisively in April when the Niño3.4 index crossed the 0.5C El Niño threshold. It subsequently reached 1C in May and hit 1.6C in June, marking one of the fastest onsets in the observational record.
In the first few weeks of July, the index shot above 2C, significantly outpacing the speed at which any prior El Niño events developed.
Forecast models expect even more to come.
An analysis by Carbon Brief of the median of 667 model runs from 14 different modelling groups suggests that sea surface temperatures in theNiño3.4 region could peak at 3.59C between July and December.
More than 91% of runs predict the strongest El Niño event in the modern record. The previous record was set during the event of 2015-16, when temperatures peaked around 2.75C.
This is shown in the chart below, which features a histogram of the likelihood of different possible 2026 El Niño peaks across all the models on the top. The forest plot beneath shows the best estimate and range of outcomes predicted by each individual model.
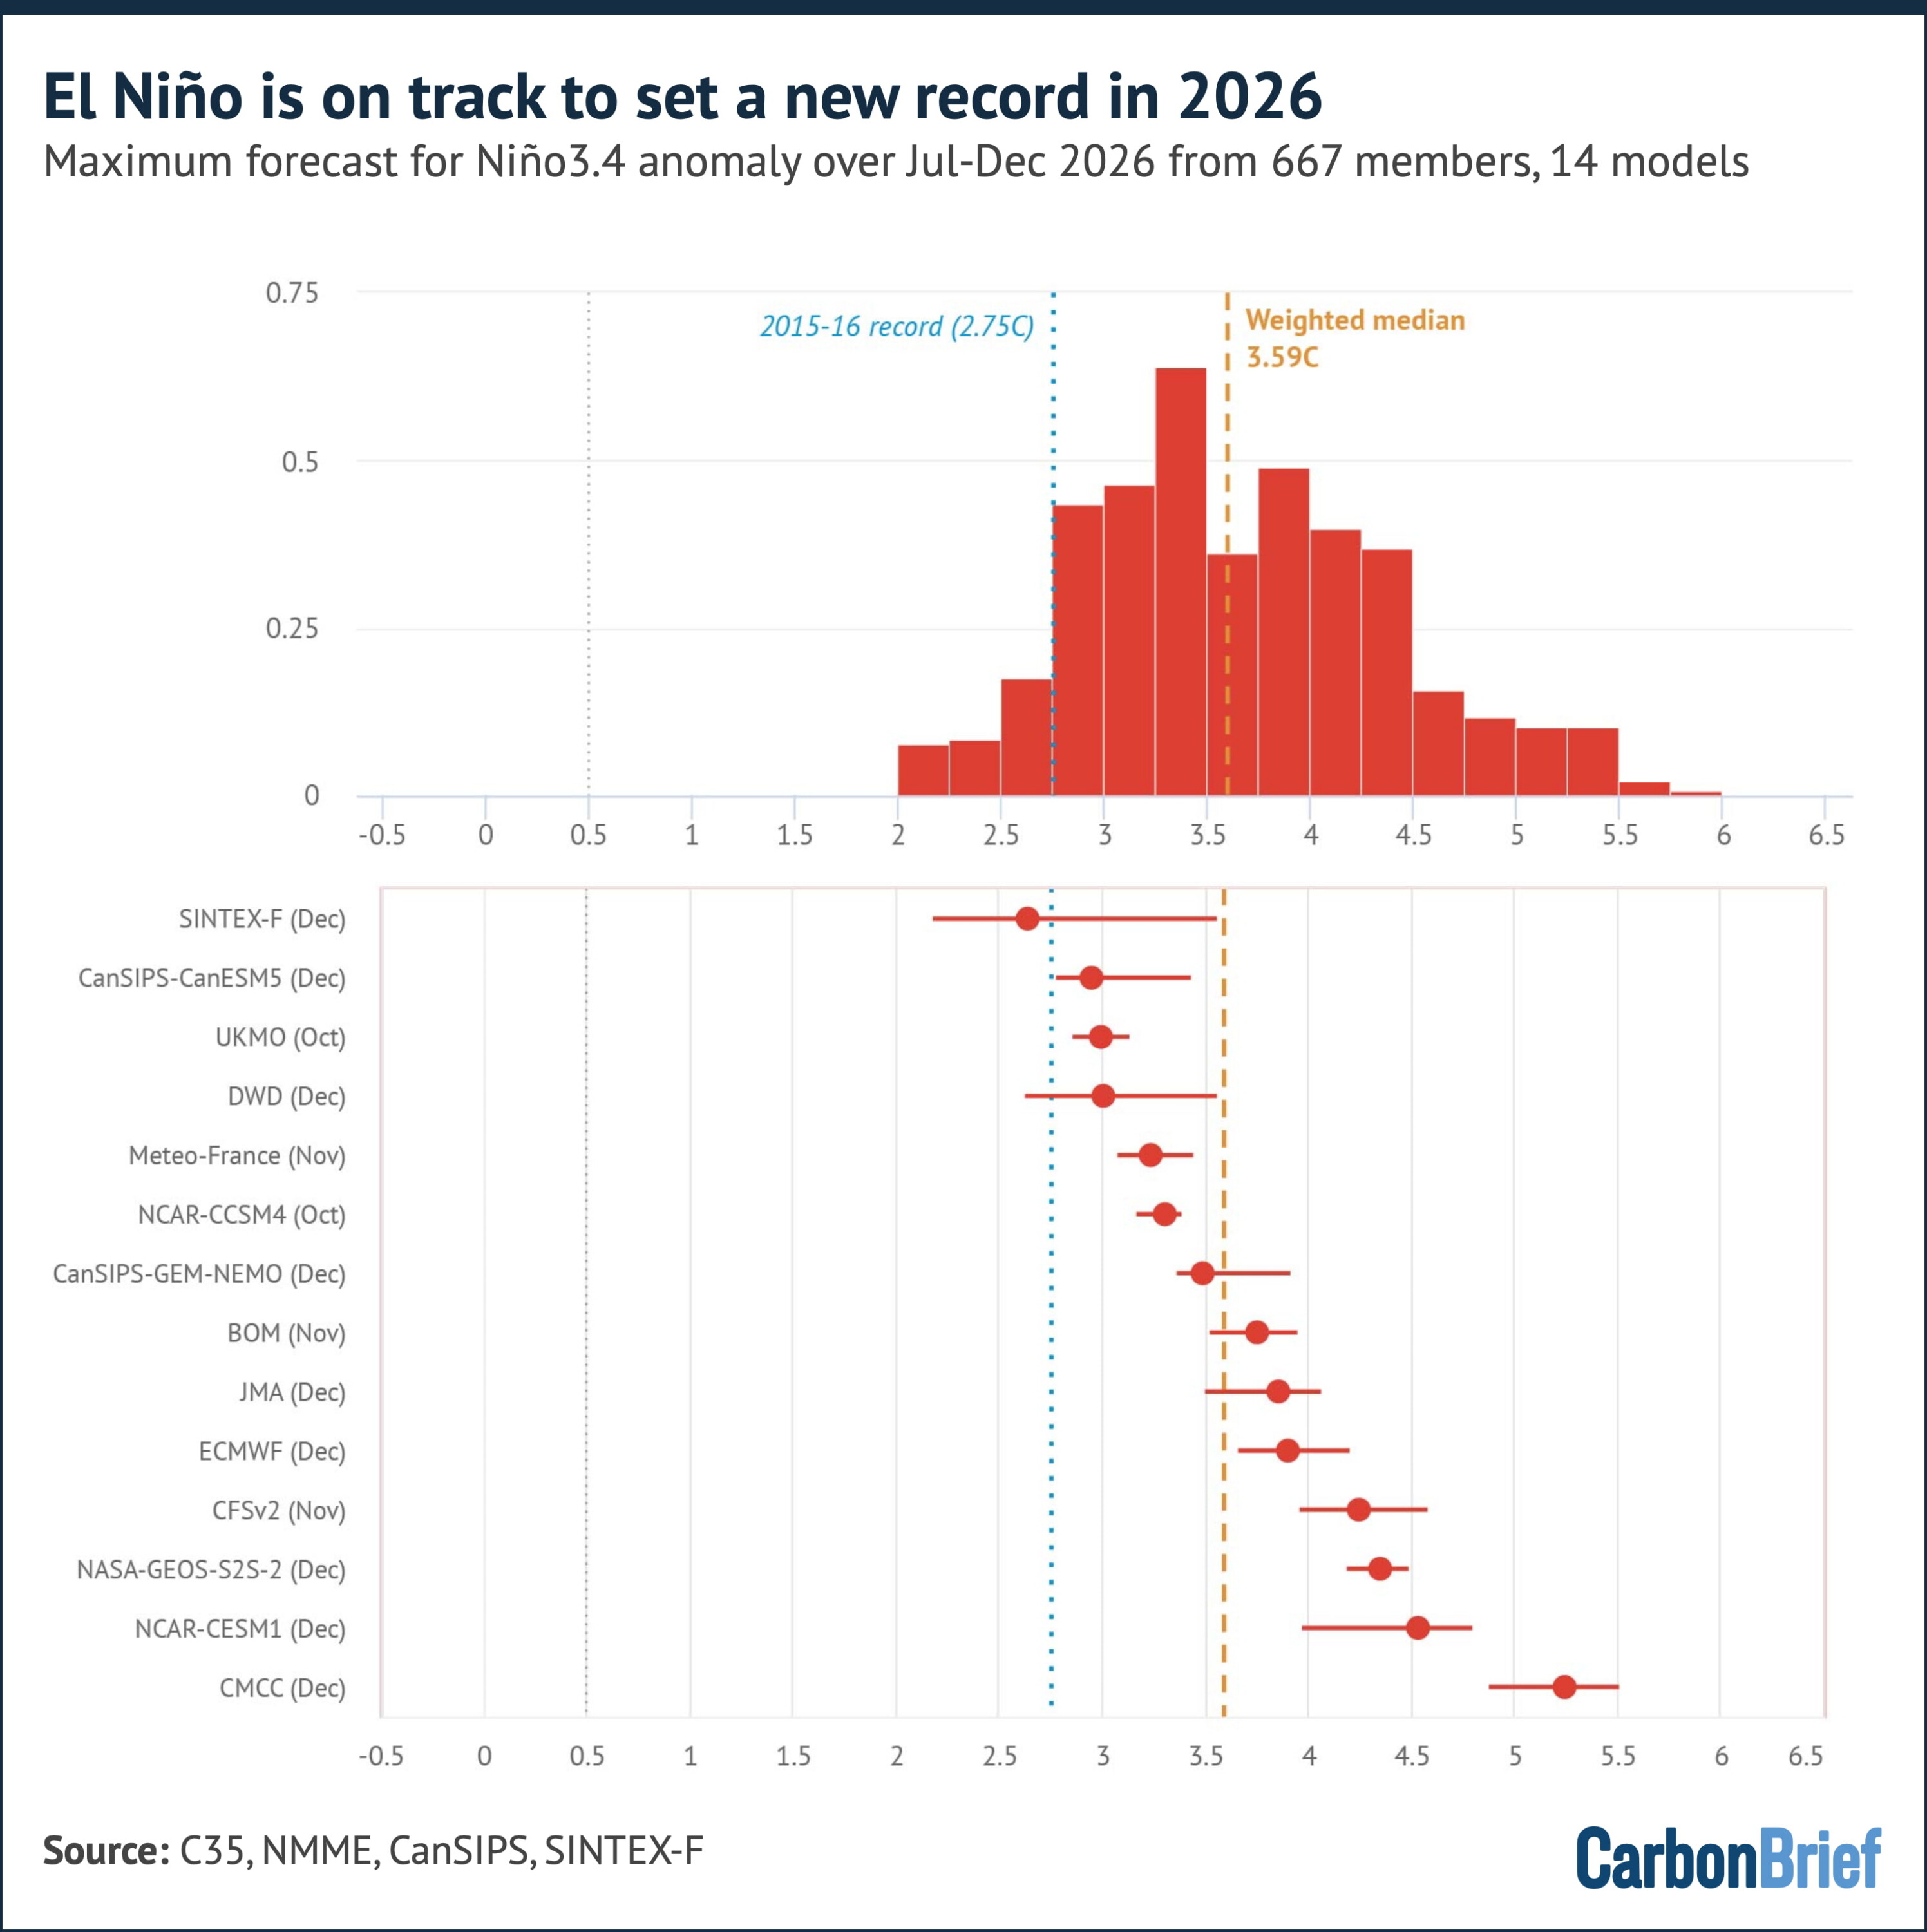
The median forecast in every one of the 14 models suggests a peak that exceeds the 2C “super” El Niño threshold, with most models peaking in November or December.
Some caution here is warranted, however. Raw model Niño3.4 anomalies are measured against a fixed climatology. Because the entire tropical ocean has warmed due to human-caused greenhouse gas emissions, the models tend to overstate event strength relative to the historical record.
A cleaner comparison uses the relative Niño3.4 index (RONI), which subtracts the average tropical ocean warming.
This relative measure suggests the median forecast peak for El Niño in the latter half of 2026 is 3.1C. The prior record stands at a lower 2.69C, set in 1982-83.
Nevertheless, 77% of model runs still show a new record event occurring. This is shown in the chart below.
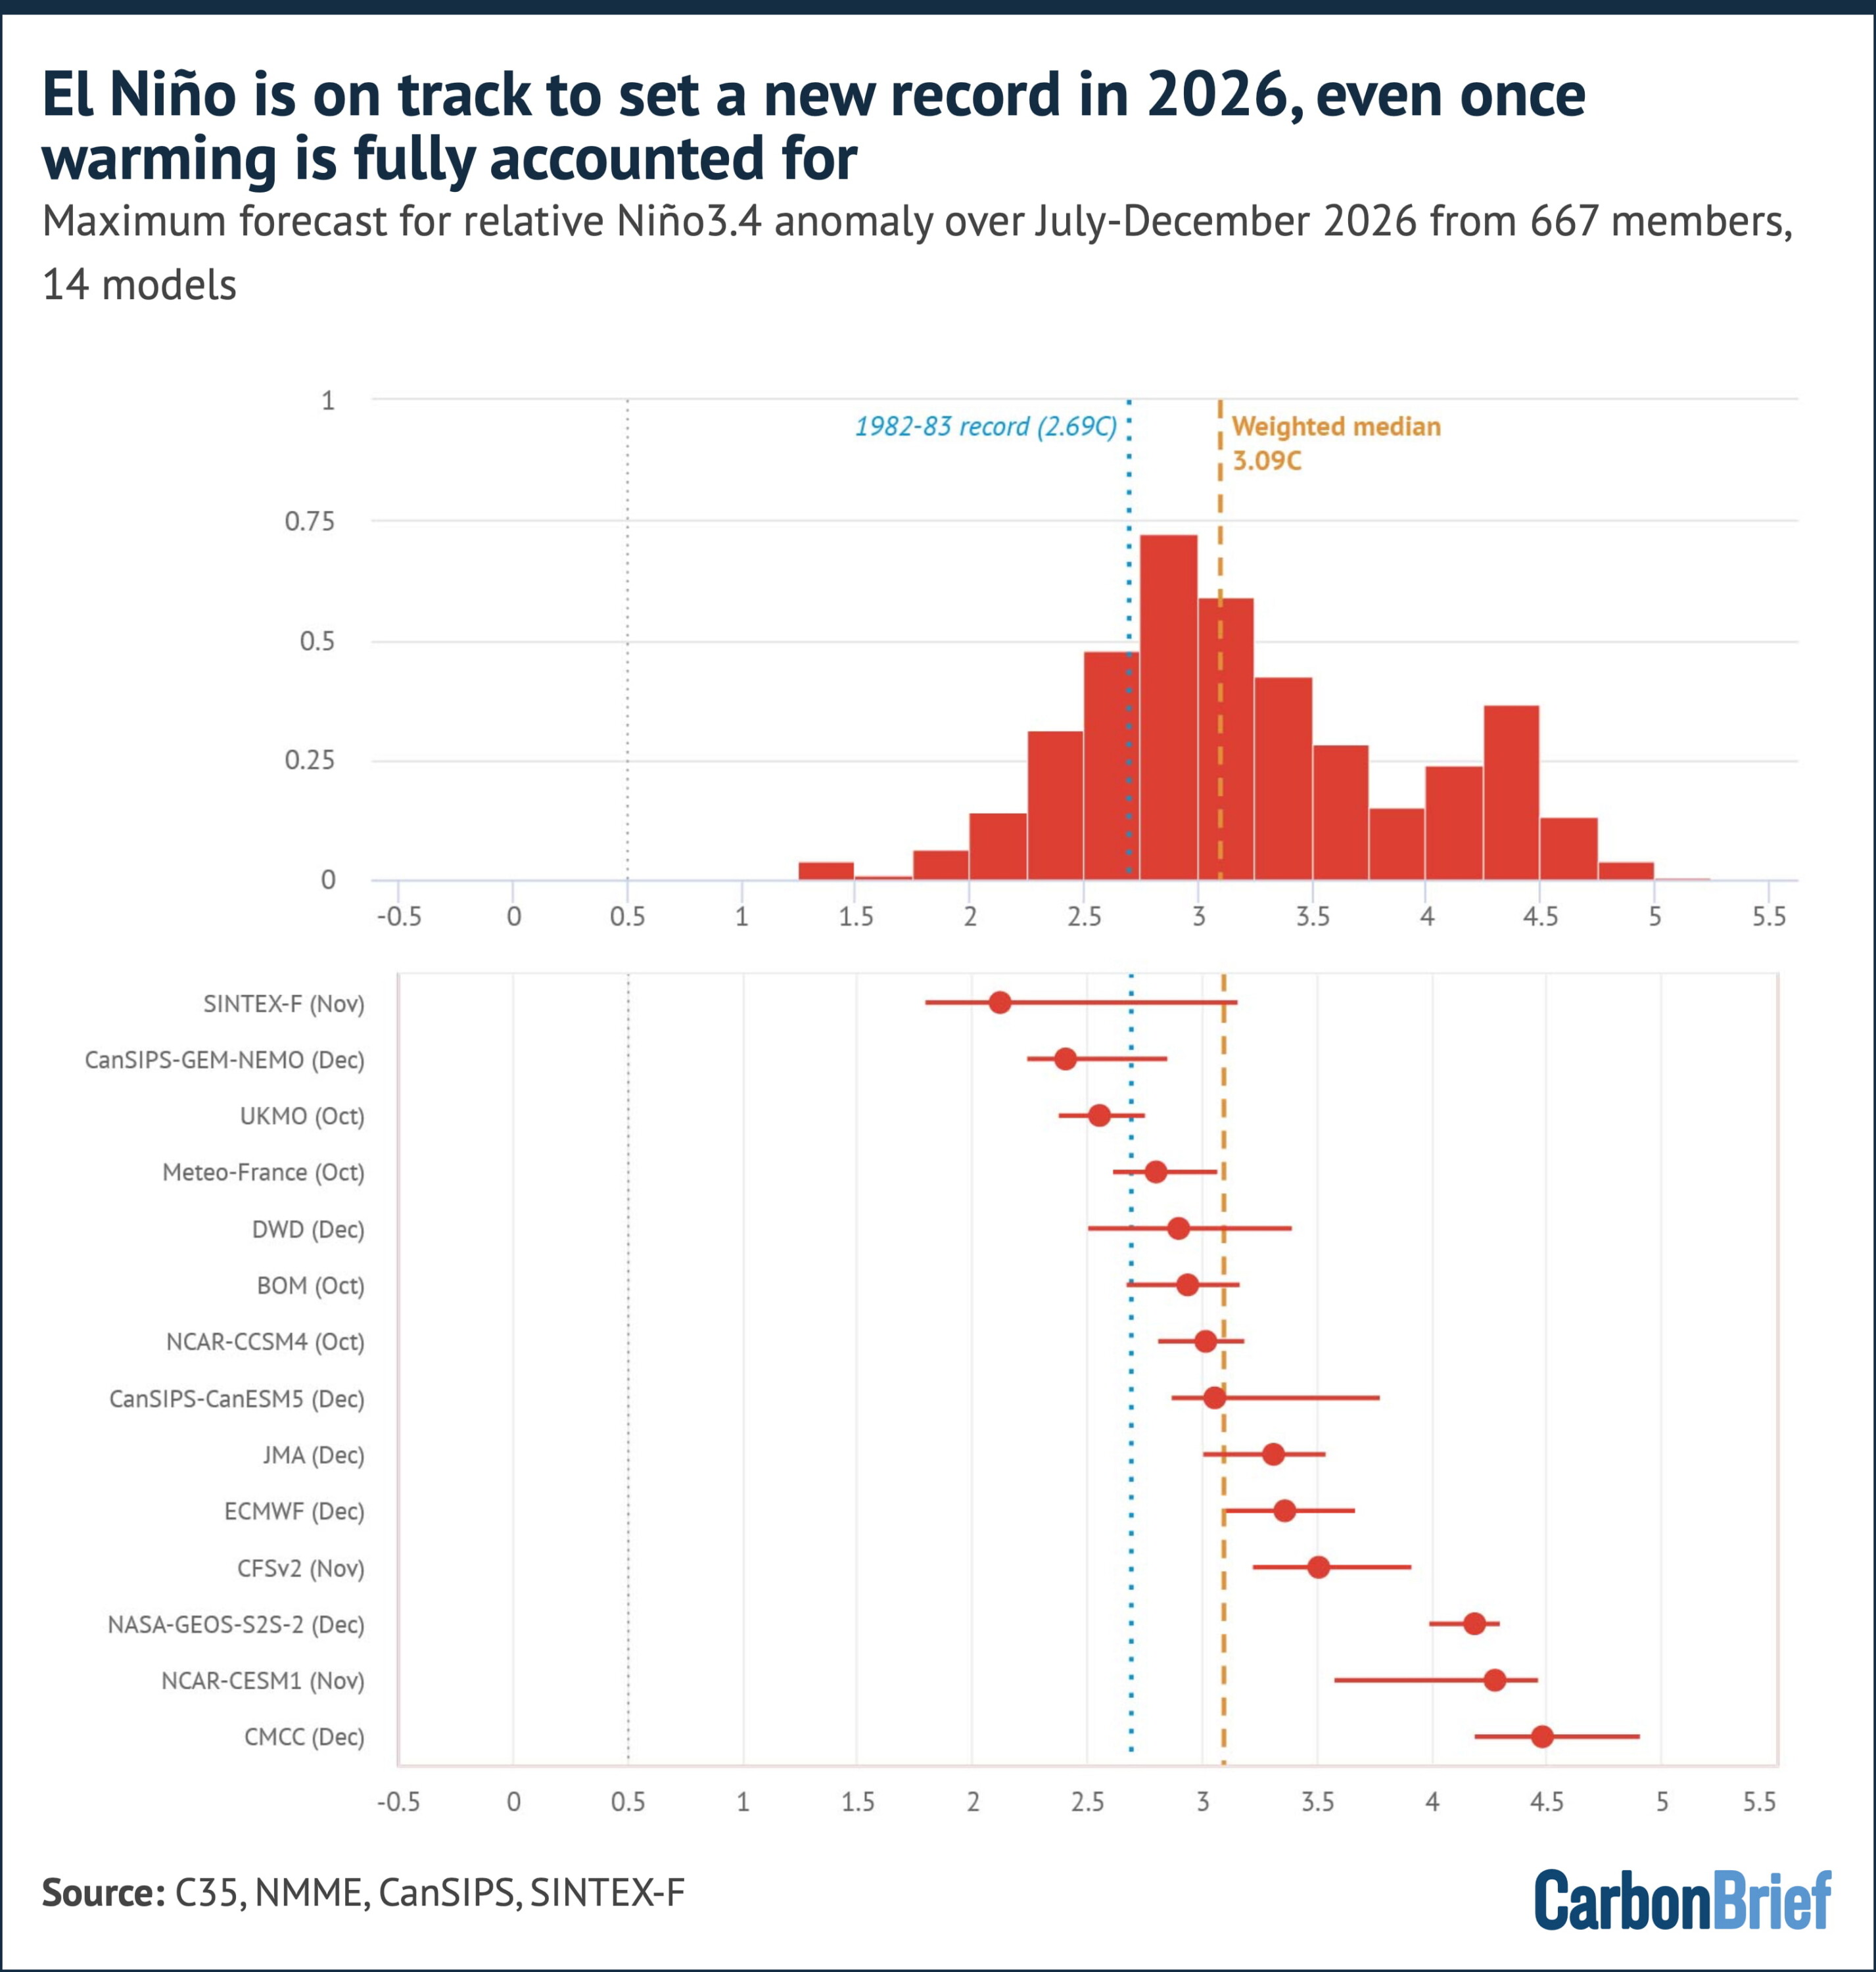
In summary, on both indexes, the central expectation is now for the strongest El Niño in the observational record.
Model forecasts made in the spring and early summer have historically shown some bias toward overpredicting event strength. However, forecasts made after the spring are considerably more reliable.
Widespread record warmth and a massive European heatwave
The map below shows the temperature anomaly for the first half of 2026 in the ERA5 dataset, relative to a 1981-2010 baseline period.
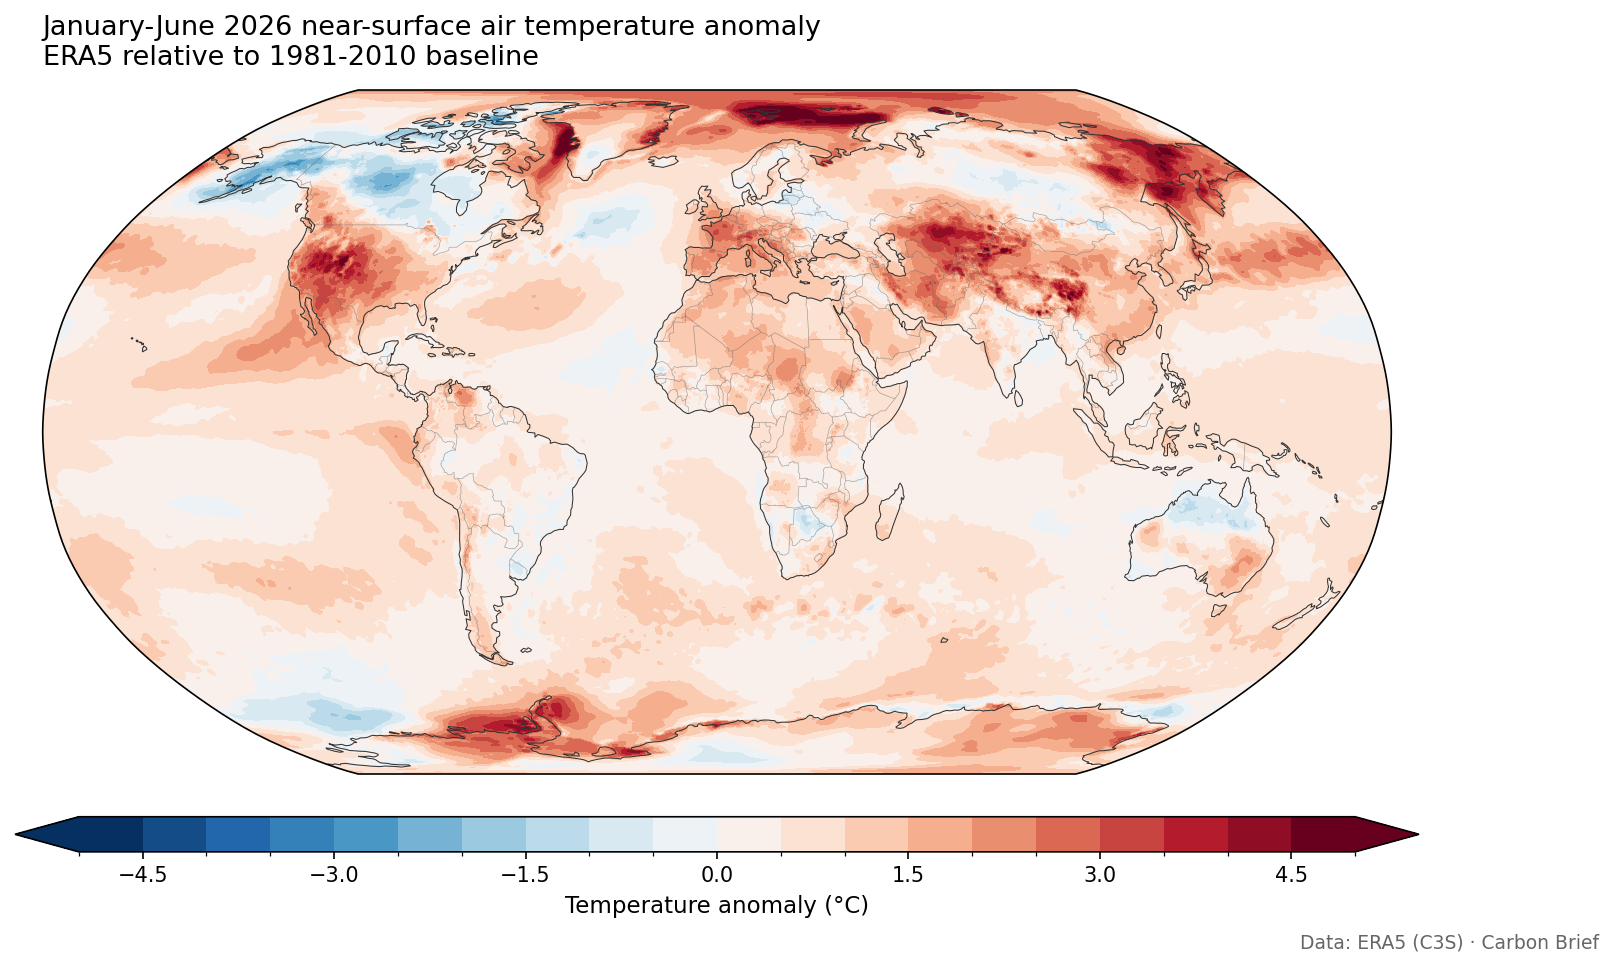
It shows how the largest warm anomalies were found across the Arctic – particularly north of Scandinavia and Svalbard – as well as western Europe, the western US, northern Mexico, central Asia, western China, eastern Russia and the Antarctic Peninsula region.
The developing El Niño is clearly visible as a tongue of warm anomalies stretching along the equatorial eastern Pacific. Only a few regions – central Canada, Alaska and parts of the Southern Ocean – saw temperatures below the 1981-2010 average.
Where 2026 ranks against history is even more striking. The map below shows where the period of January-June 2026 ranked among all 87 years in the ERA5 record, which stretches from 1940 to 2026. Grid cells marked in red saw temperatures in the first half of the year that were in the top-five warmest years.
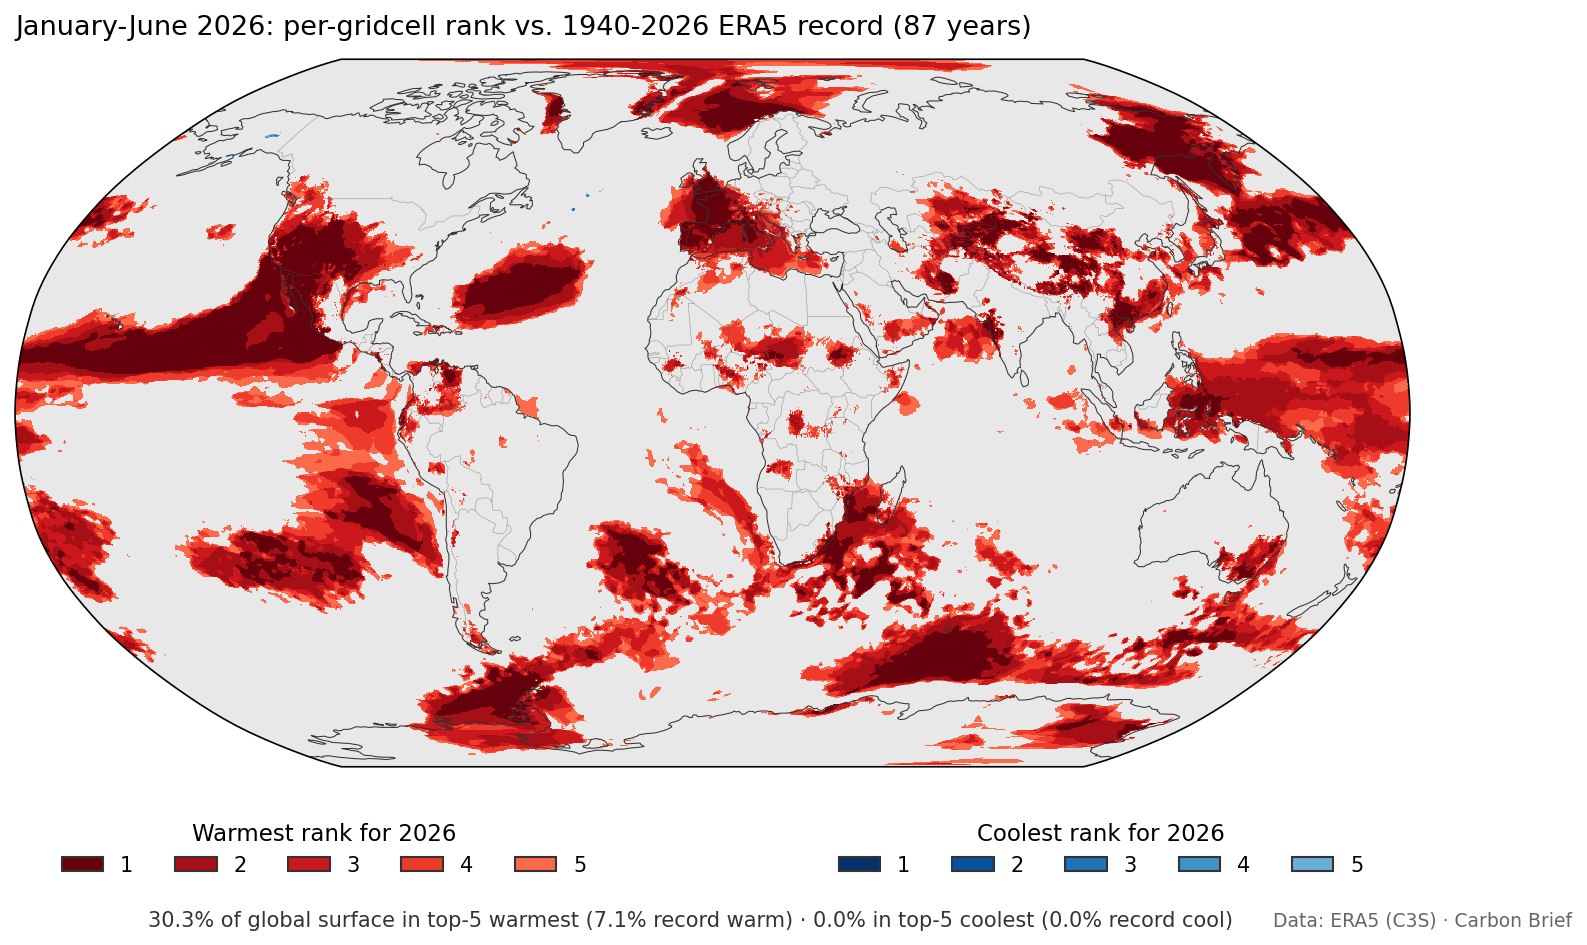
More than 30% of the global surface had a top-five warmest start to the year and 7.1% saw its warmest on record, including much of western Europe, the eastern equatorial Pacific and the seas around Japan.
Not a single grid cell had a top-five coolest start to the year. In June alone, 8.9% of the world’s surface saw record warmth for the month. This is illustrated in the map below, where grid cells marked in red saw temperatures that were in the top-five warmest years and grid cells in blue in the top-five coolest.
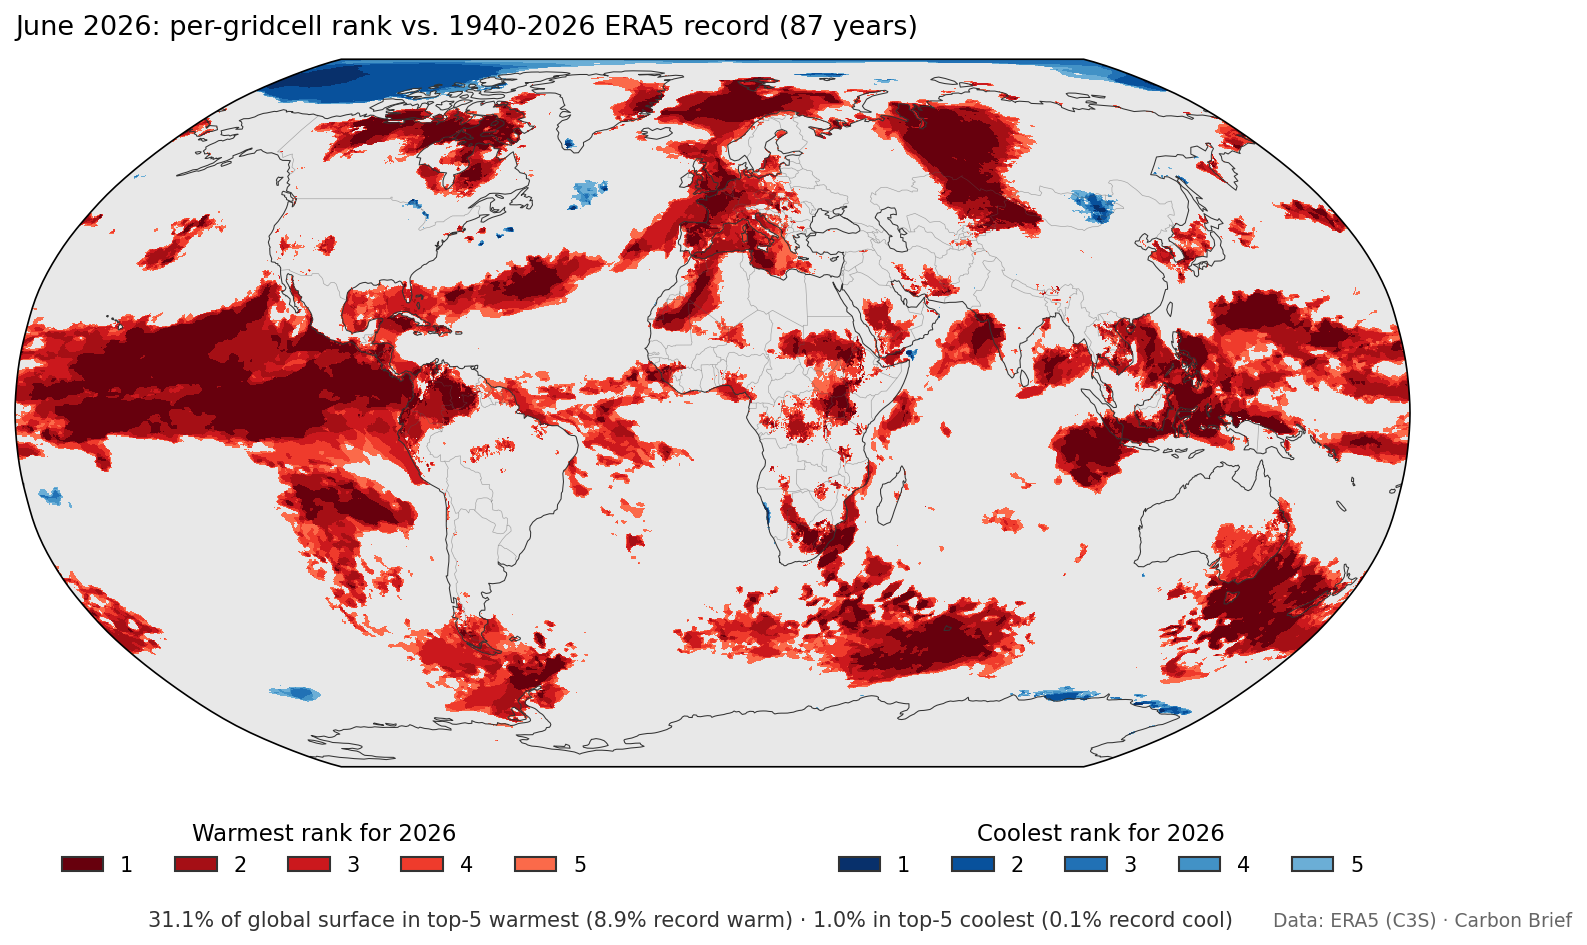
The standout regional temperature event was a heatwave that struck Europe in late June.
Western Europe had its hottest June on record, recording an average temperature of 3.05C above the 1991-2020 average and beating the record set only a year earlier, according to Copernicus. A heat dome over 22-30 June broke 10 all-time national heat records and around 400 long-record station records.
France set a new June national record of 44.3C, while the UK broke its June record on three consecutive days, reaching 37.3C. The humid heat drove a death toll estimated in the thousands.
A separate heat dome also brought record June temperatures to parts of North America in late June.
On track to be second warmest, but a real chance at first
Carbon Brief’s updated projection for 2026 as a whole combines the observed January-June temperatures with the latest El Niño forecast. It uses a statistical model trained on the historical relationship between the first half of the year, ENSO conditions and annual temperatures observed over 1950-2025, excluding major volcanic eruption years.
Carbon Brief estimates that 2026 will be around 1.51C above pre-industrial levels, with a 90% range of 1.45C to 1.57C, shown by the yellow dot in the chart below.
This is up from 1.47C in the projection set out in April – and is notably more certain now that half the year has passed.
This central estimate would make 2026 the second-warmest year on record, just below 2024 (1.52C) and ahead of 2023 (1.43C) and 2025 (1.41C).
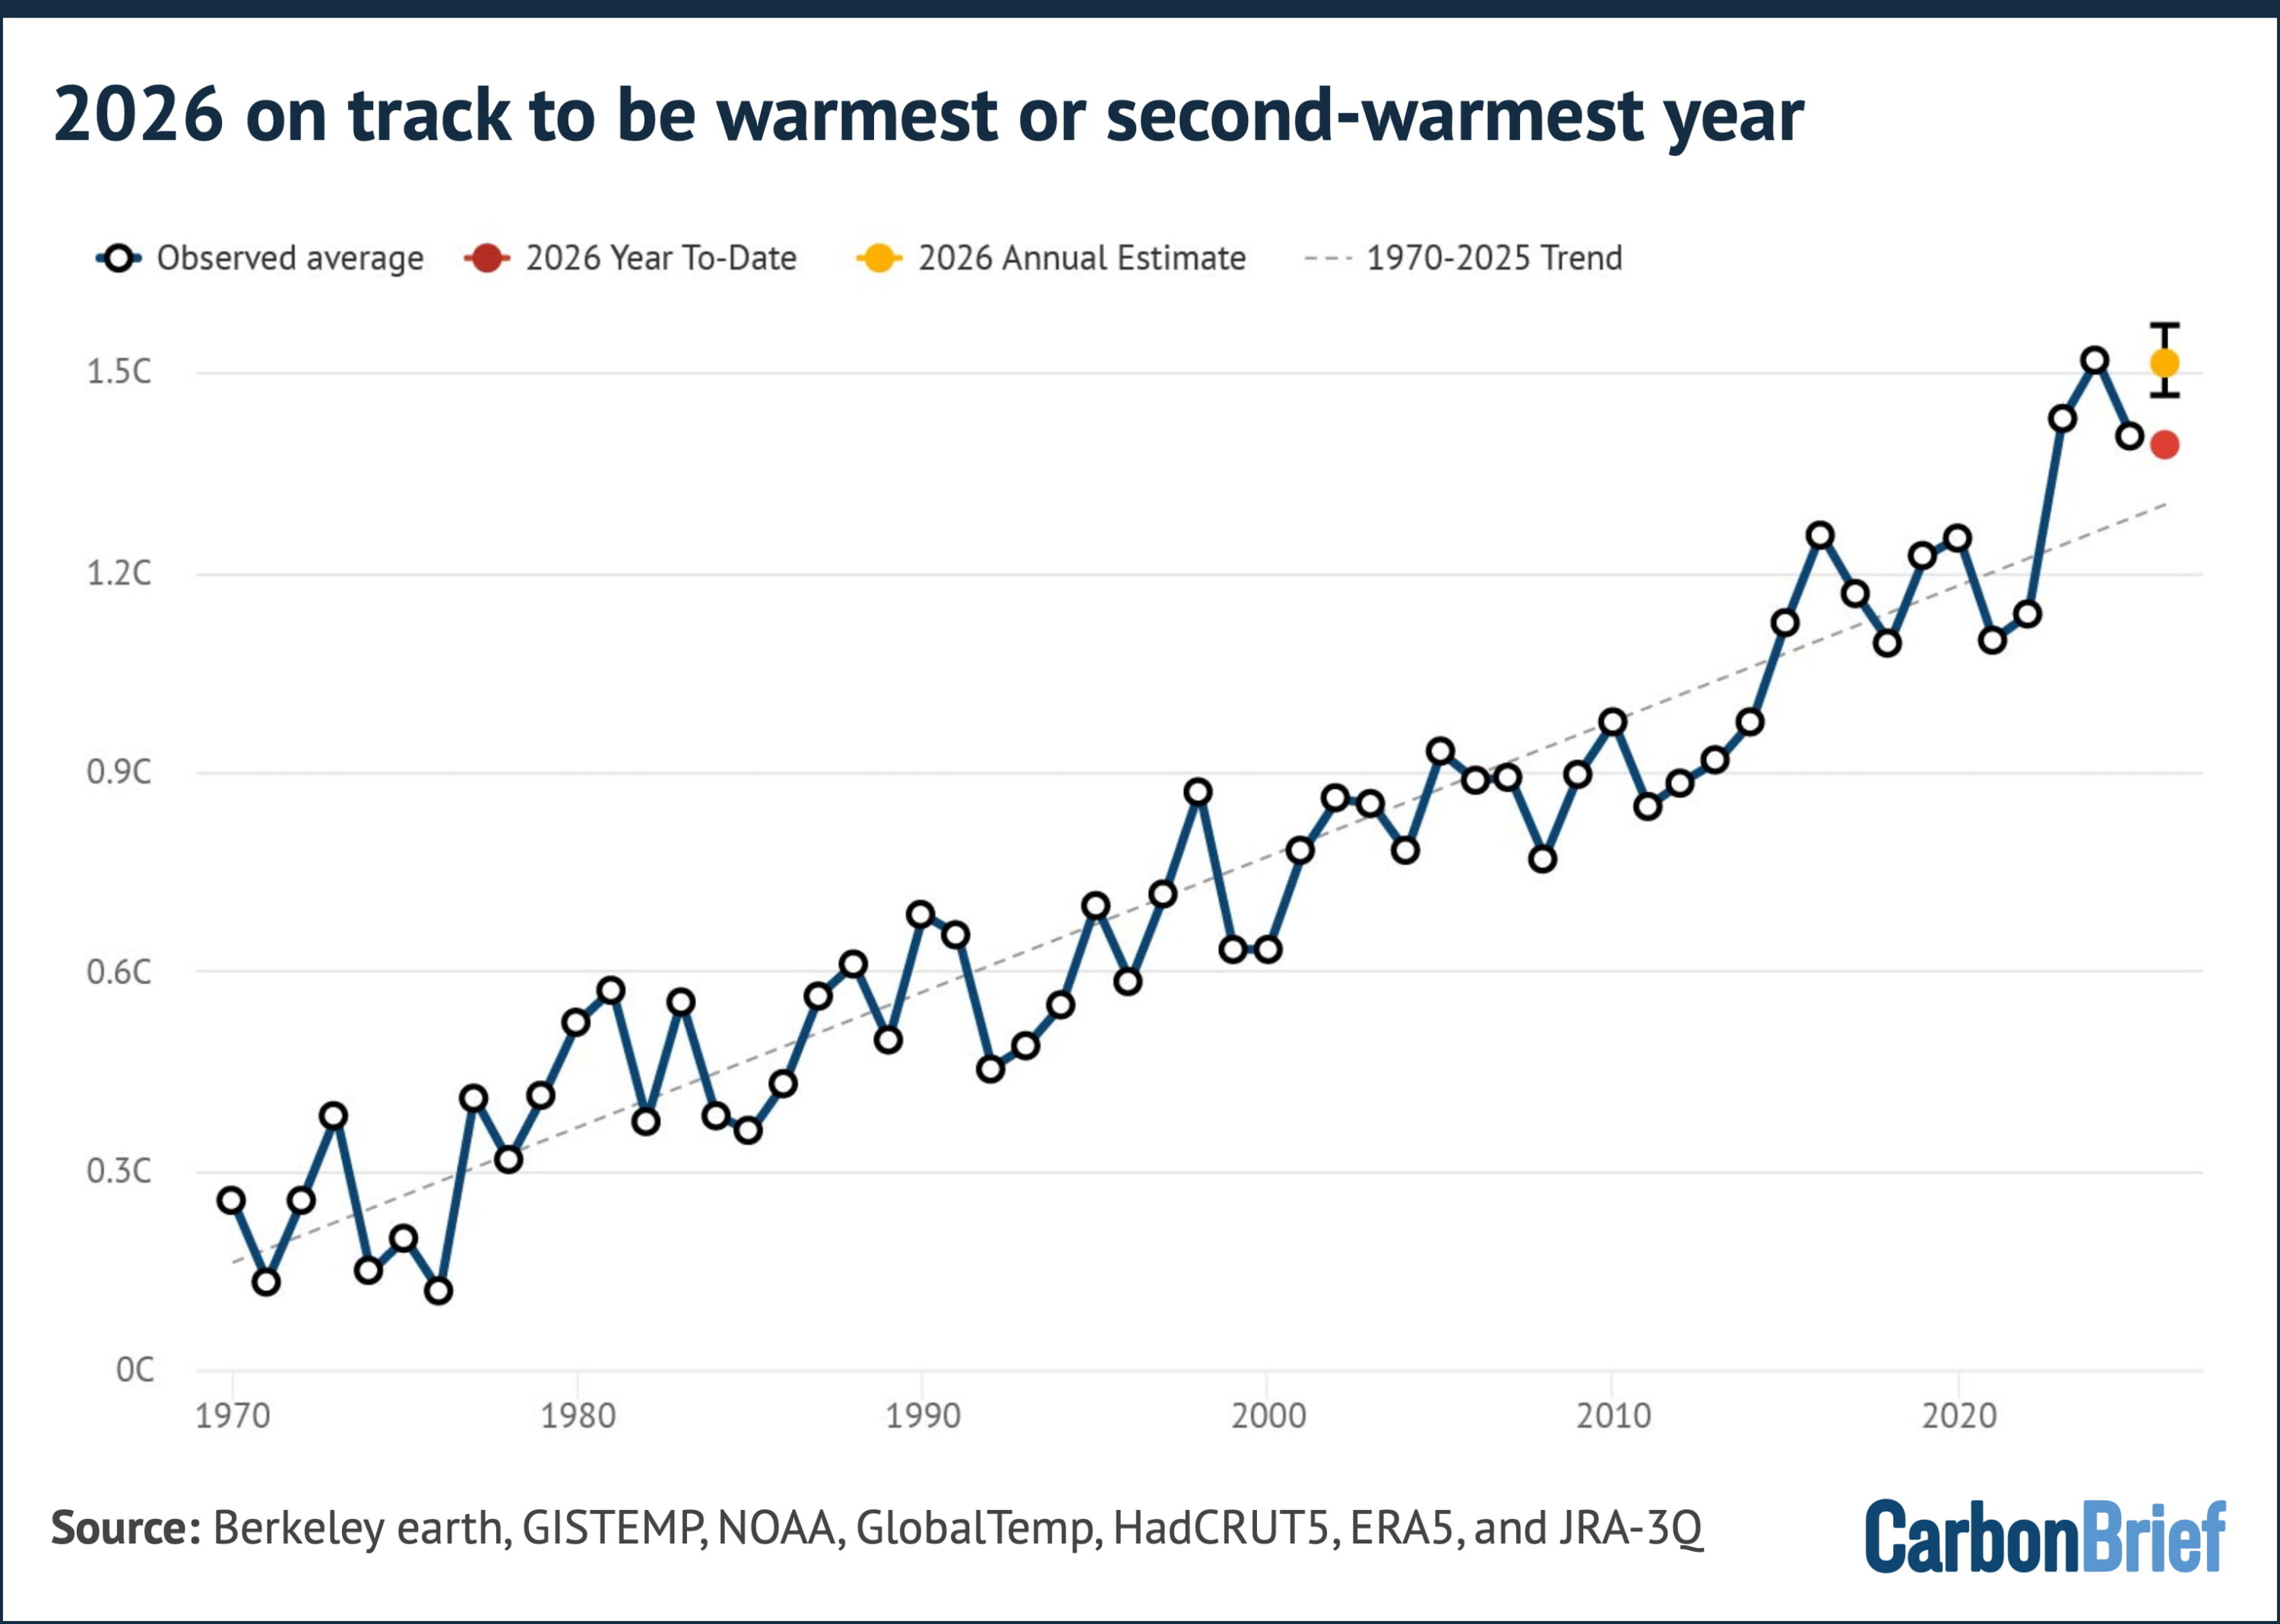
Carbon Brief’s modelling puts the chance that 2026 beats 2024 as the warmest year on record at 35%, using the average of the six different surface temperature records assessed. It puts the chance that 2026 comes in above 1.5C at around 63%.
If it does, 2026 would be the second calendar year – after 2024 – where warming averaged above 1.5C, in a further sign that the world is rapidly approaching the Paris Agreement’s 1.5C limit.
A single year above 1.5C does not by itself constitute a breach of the goal, which refers to the longer term average temperature of the planet. This is defined as the midpoint of a 20-year period by the Intergovernmental Panel on Climate Change (IPCC).
These likelihood of a record have been climbing rapidly throughout 2026.
Global temperatures so far throughout the year have run well below the record-setting levels of 2024 – around 0.13C cooler over the first six months.
On their own, temperatures observed so far in 2026 would make a new annual record unlikely.
However, rerunning the projection using only the data available at the end of each month since March – including both the year-to-date observations and the El Niño forecast issued that month – shows a shifting picture.
Using March data, 2026 had just a 7% chance of setting a new record. That rose to 16% in April, 24% in May, 27% in June and 35% using the latest data in mid-July.
This is shown in the chart below.
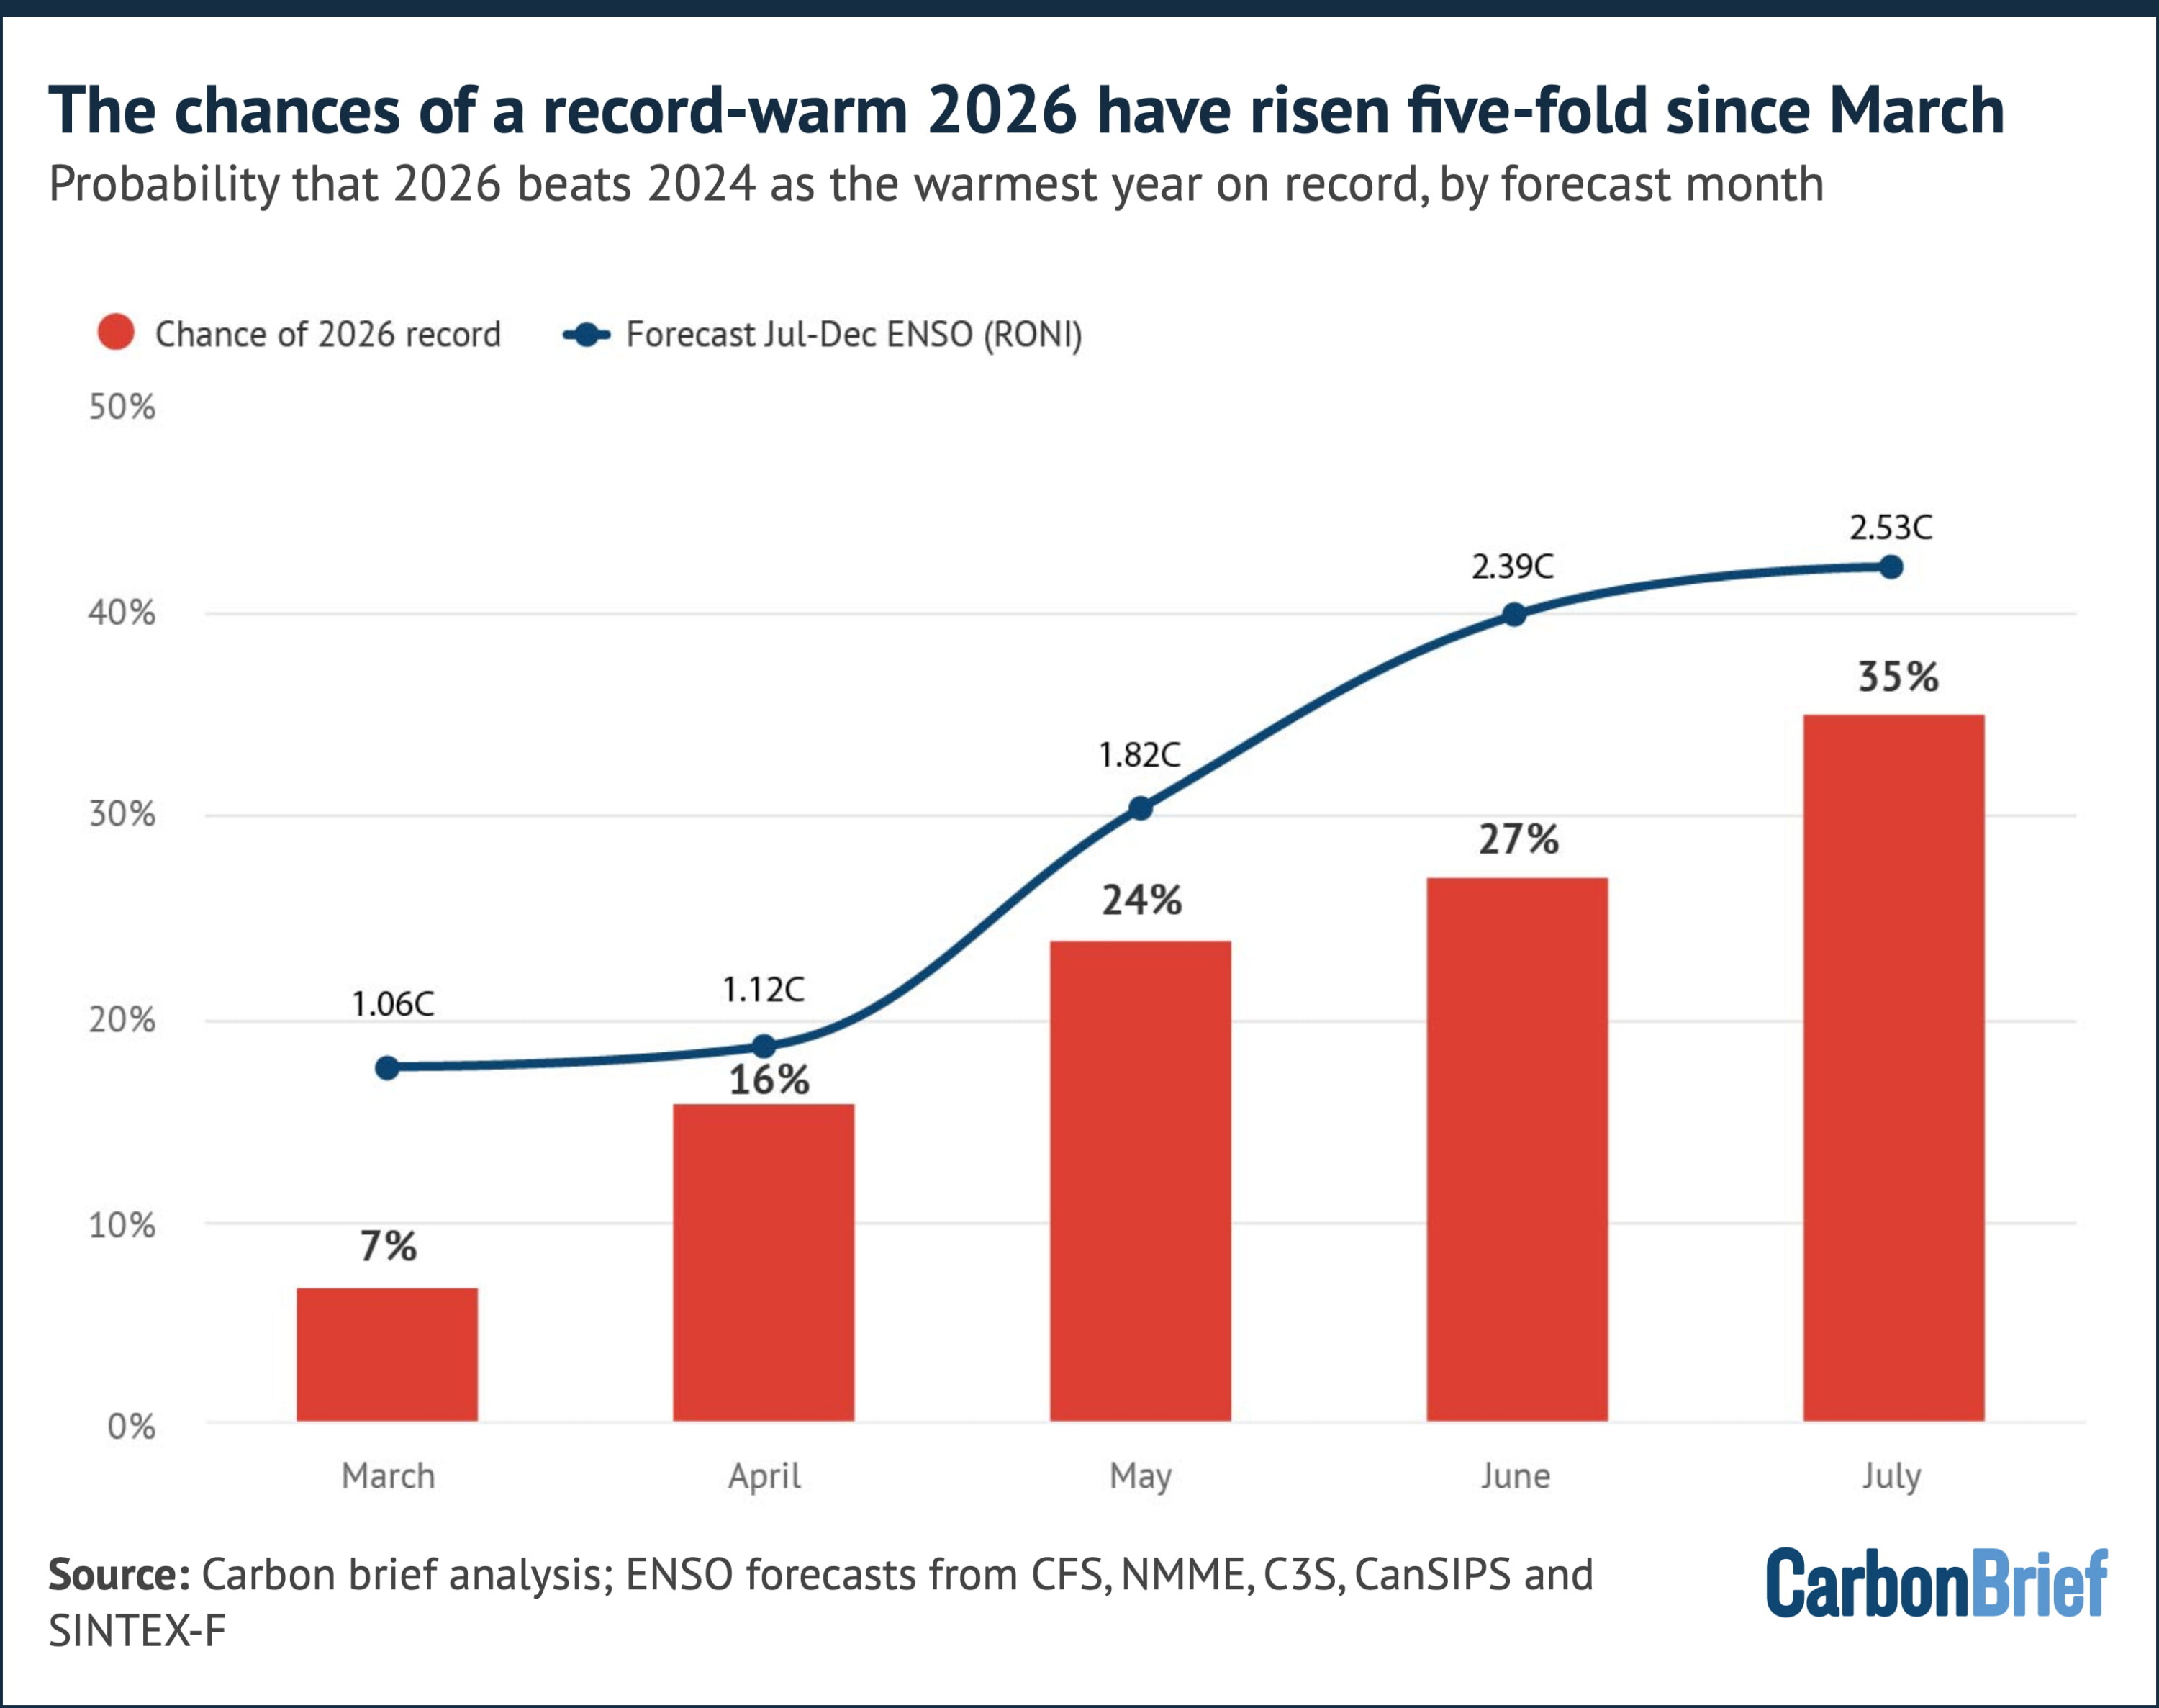
Notably, this rise has little to do with observed temperatures. The year-to-date anomaly has actually drifted slightly down, from 1.41C after March to 1.39C after June.
Observed temperatures and fewer remaining months of the year contributed only around four percentage points of the 28-point rise in the likelihood; the remaining ~84% of the change comes from successive upward revisions to the El Niño forecast for late 2026.
However, whether 2026 ends up becoming the warmest year on record may end up depending on which dataset is used.
Running the same projection gives odds of a 2026 record of around two-in-three for Berkeley Earth (66%) and NASA GISTEMP (65%), but only 35% for HadCRUT5, 24% for NOAA and just 13% and 9% for the ERA5 and JRA-3Q reanalyses, respectively.
This is shown below.
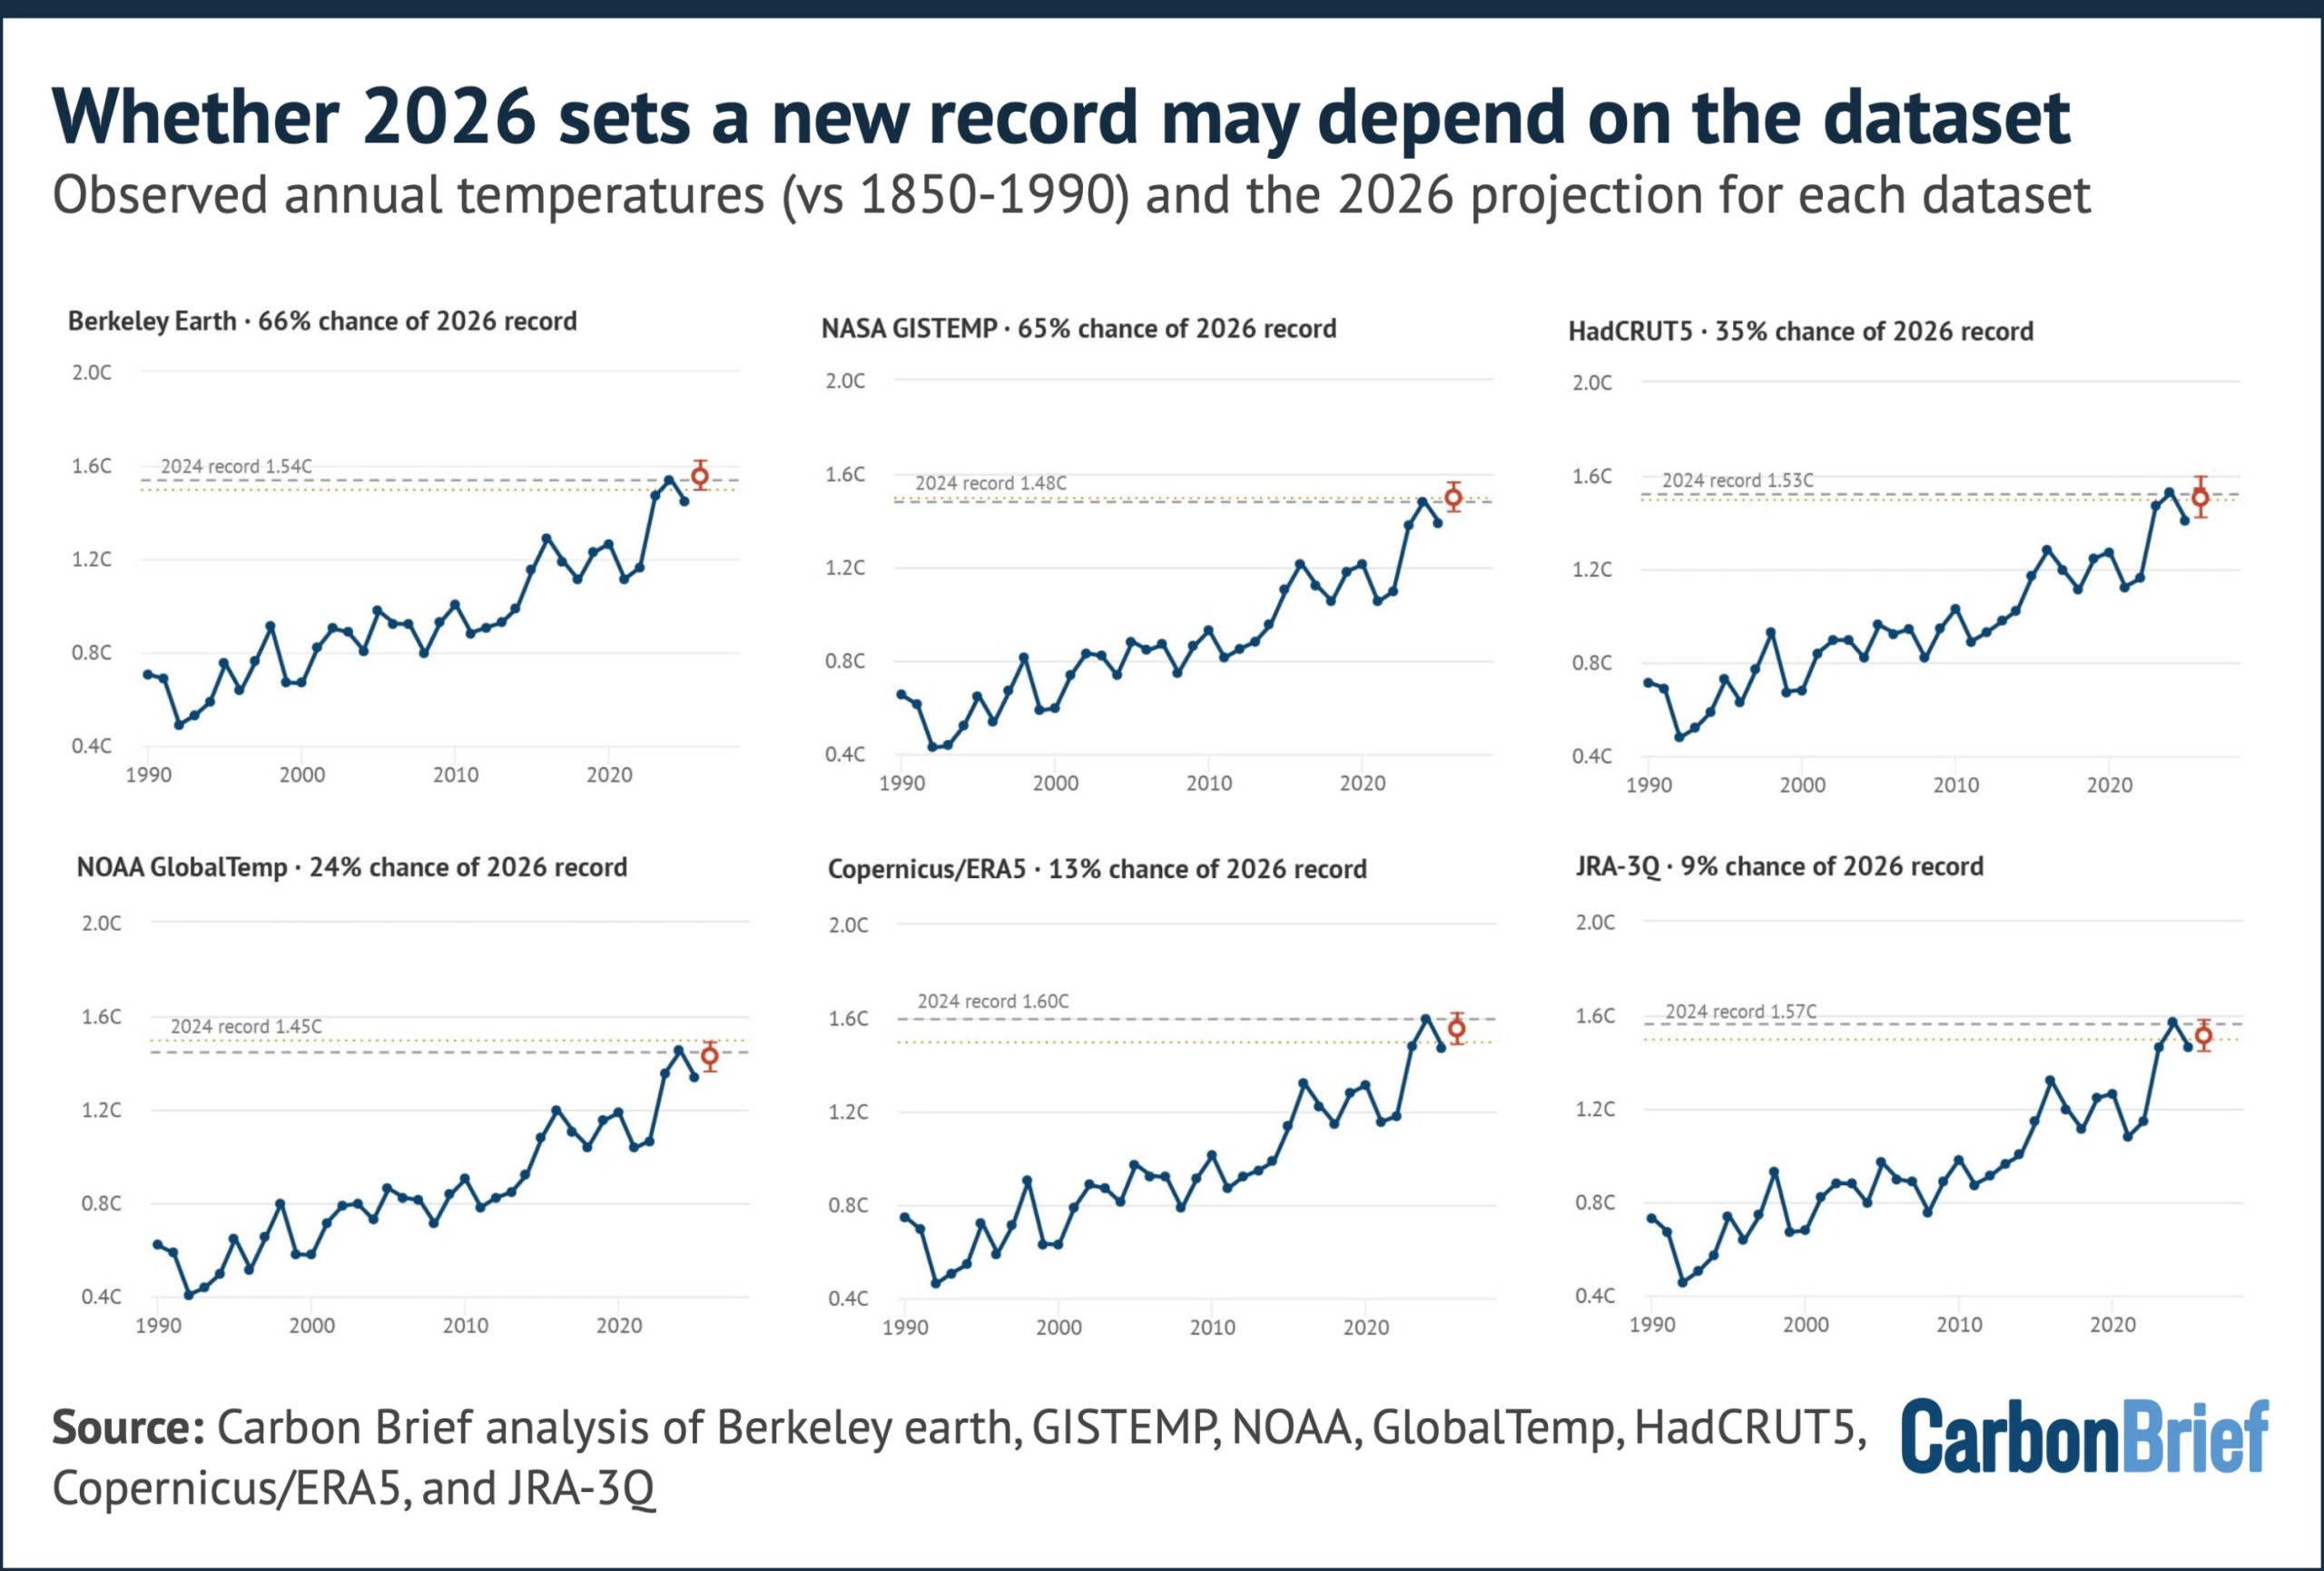
The divergence between projections mostly reflects how exceptional each dataset’s 2024 was.
The reanalysis approaches recorded a particularly warm 2024, leaving 2026 more ground to make up. GISTEMP and Berkeley, on the other hand, project 2026 modestly above their 2024 values.
A repeat of the situation in 2015 where different groups disagreed on record rankings is a real possibility. Headlines in January 2027 may hinge on choices of dataset.
2027 likely to be the warmest year in human history
The biggest climate story of the developing super El Niño may not be 2026 at all.
Global temperatures typically lag in the tropical Pacific by around three months. So, an El Niño event peaking in November and December 2026 will have its largest warming influence on 2027.
We saw this same pattern occur in 1997-98, 2015-16 and 2023-24 – where the year in which the El Niño developed was warm, but the following year was record-smashing.
Carbon Brief has extended its projection into 2027 by using the historical relationship between year-over-year temperature changes and ENSO conditions in the preceding autumn.
This yields a best estimate for 2027 of around 1.71C above pre-industrial levels, with a 90% range of 1.49C to 1.93C. This is shown by a yellow square on the chart below.
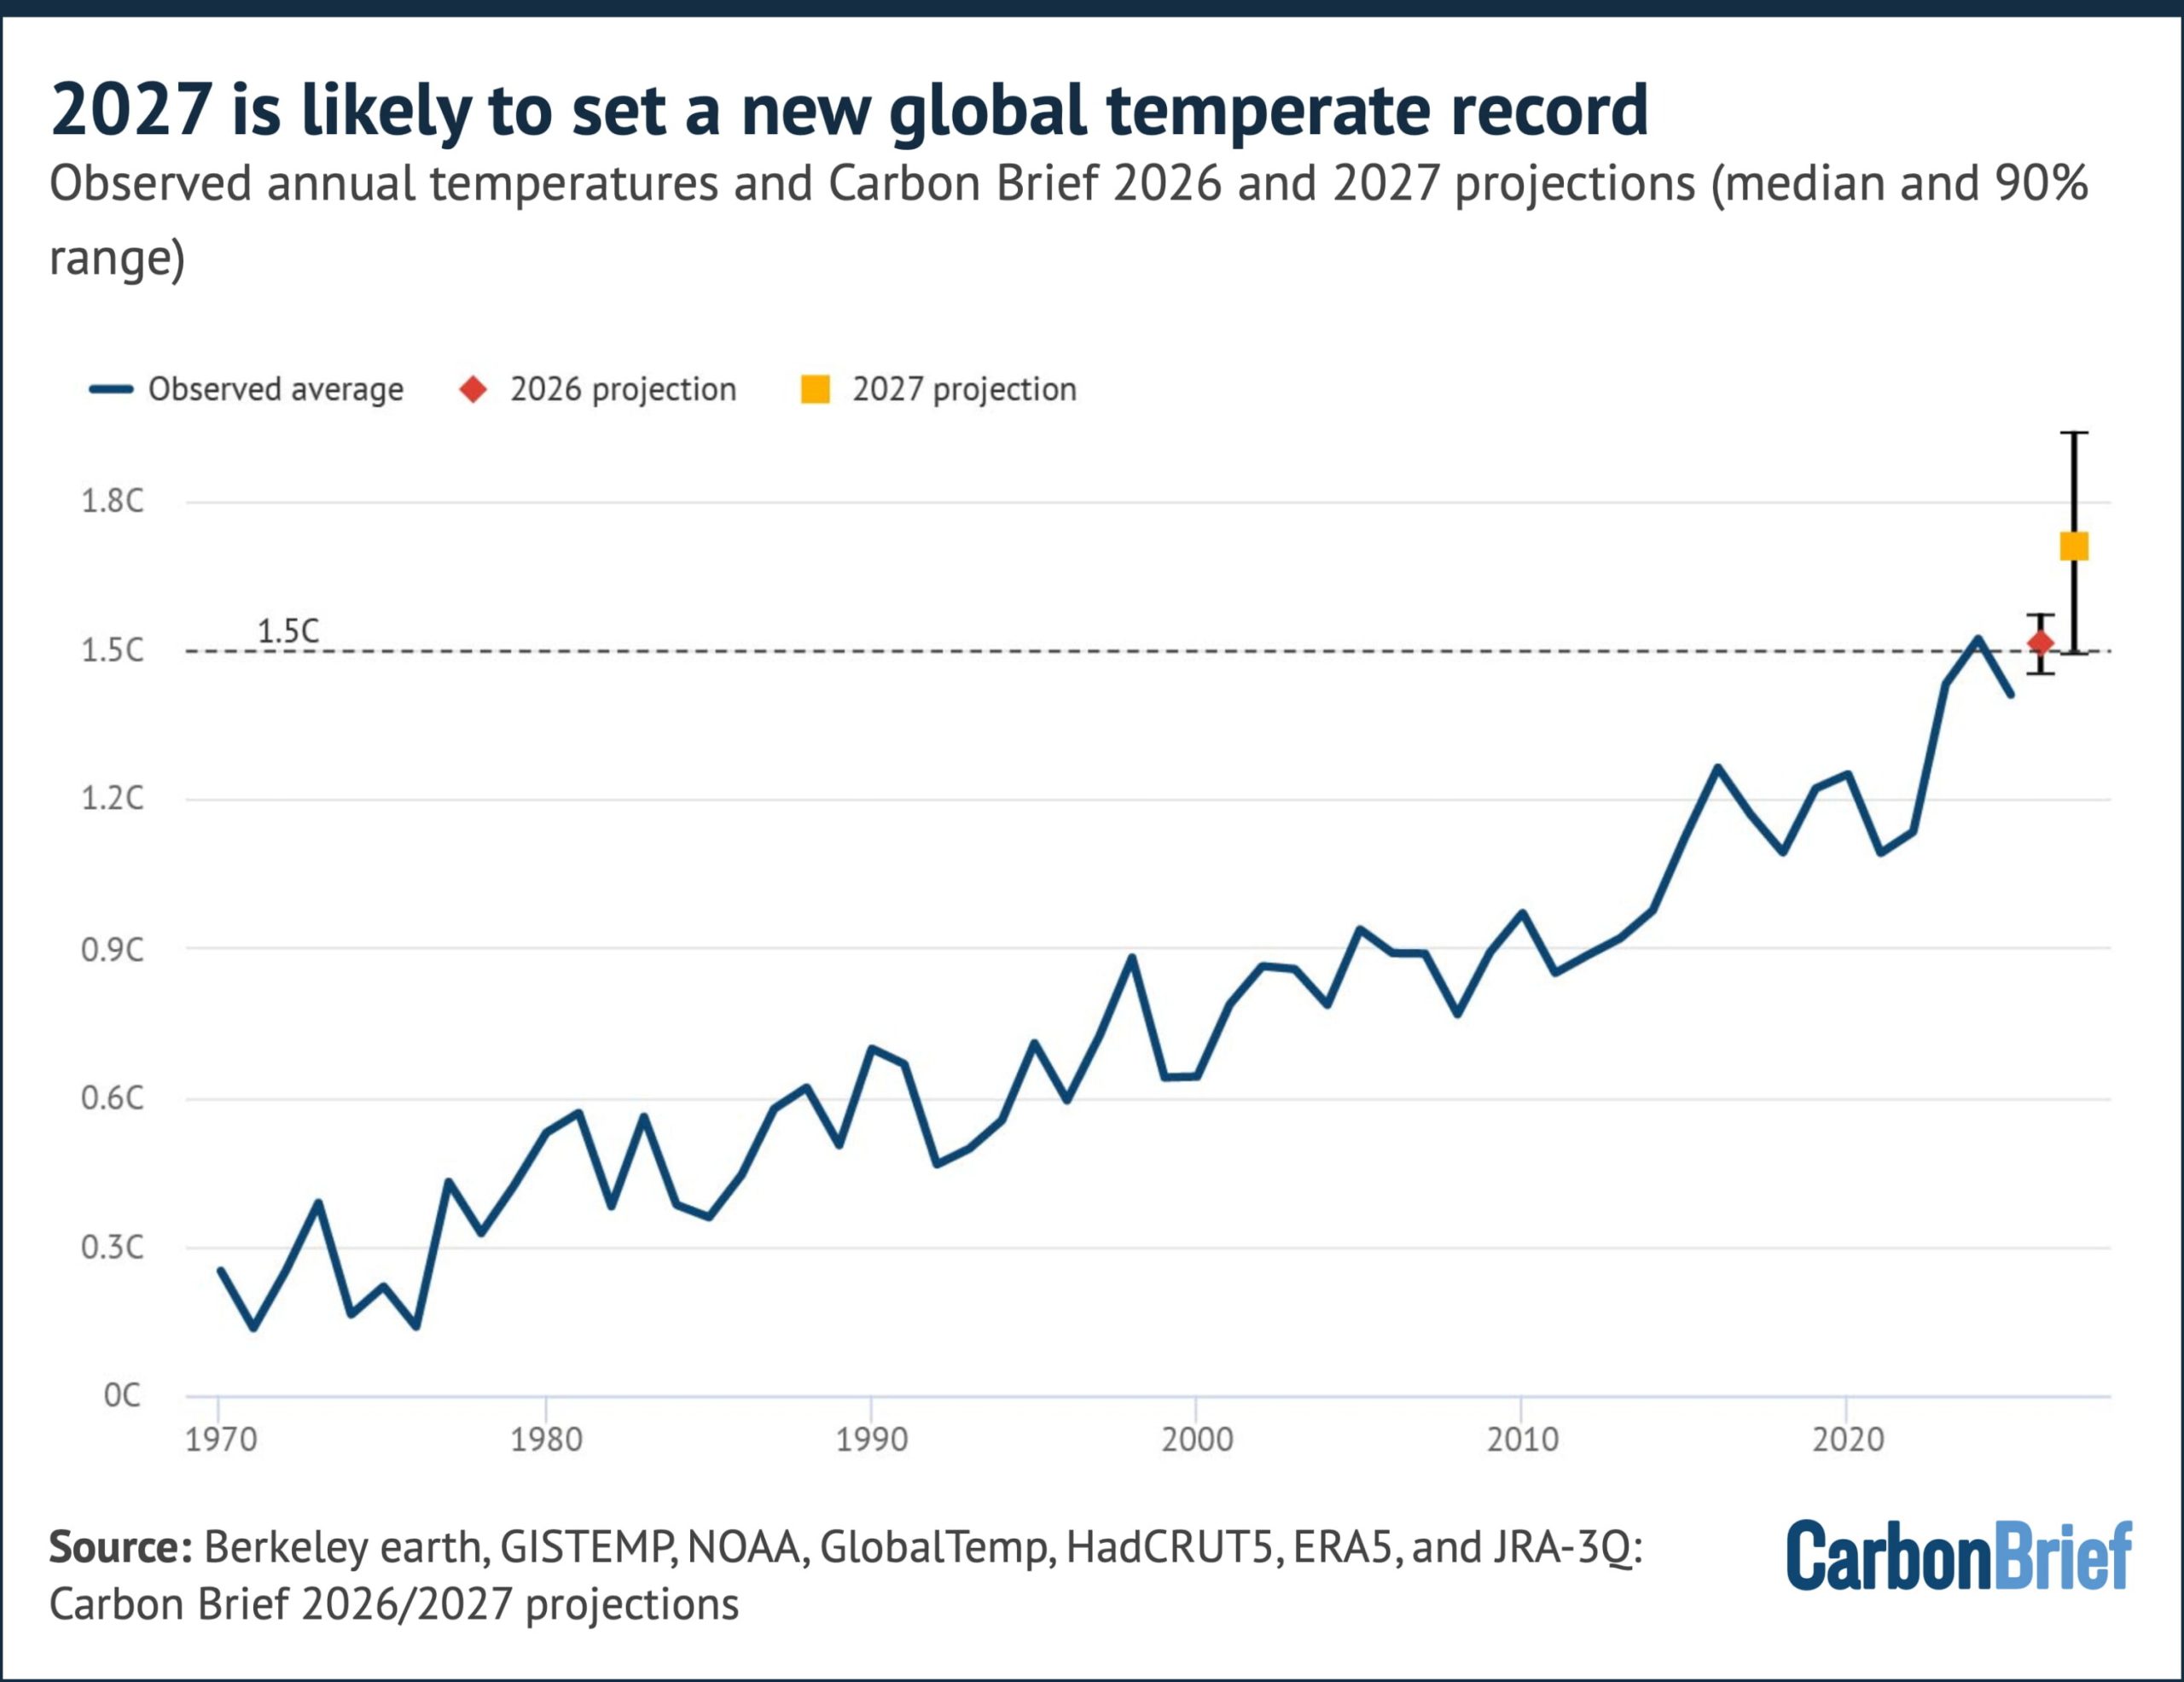
That would give 2027 a 92% chance of setting a new global temperature record and a 94% chance of exceeding 1.5C.
Taking 2026 and 2027 together, there is a 93% chance that at least one of the two years sets a new record.
The 2027 estimate is more uncertain than the 2026 one. As with 2026, there are uncertainties in the projection due to unknowns around exactly how strong the El Niño peak proves to be and how quickly it decays.
However, even the low end of the 2027 range would put it among the warmest years on record and the central estimate of 1.71C would exceed 2024 by nearly 0.2C.
If these projections bear out, the 2020s will have delivered new global temperature records in 2023, 2024 and 2027 – and potentially 2026 too – with a number of individual years well above the 1.5C threshold.
The long-term warming trend, driven by human emissions of carbon dioxide and other greenhouse gases, has increased from around 0.18C per decade in the early 2000s to around 0.27C per decade today. El Niño and La Niña play a big role in determining which years along that rising path stand out as records.
Arctic sea ice at record lows
Arctic sea ice has spent much of 2026 in record-low territory.
Following the joint-lowest winter maximum in the satellite record in mid-March, daily extent has set or tied record lows for the date on 39 days so far this year, including extended spells in mid-to-late March and in early-to-mid June.
The most recent record-low days were in early July.
The chart below shows how Arctic sea ice in 2026 (dark red line) has been below the historical range (shaded red).
It also shows how Antarctic sea ice (dark blue), meanwhile, has remained below the 1979-2010 range for almost all of 2026 to date.
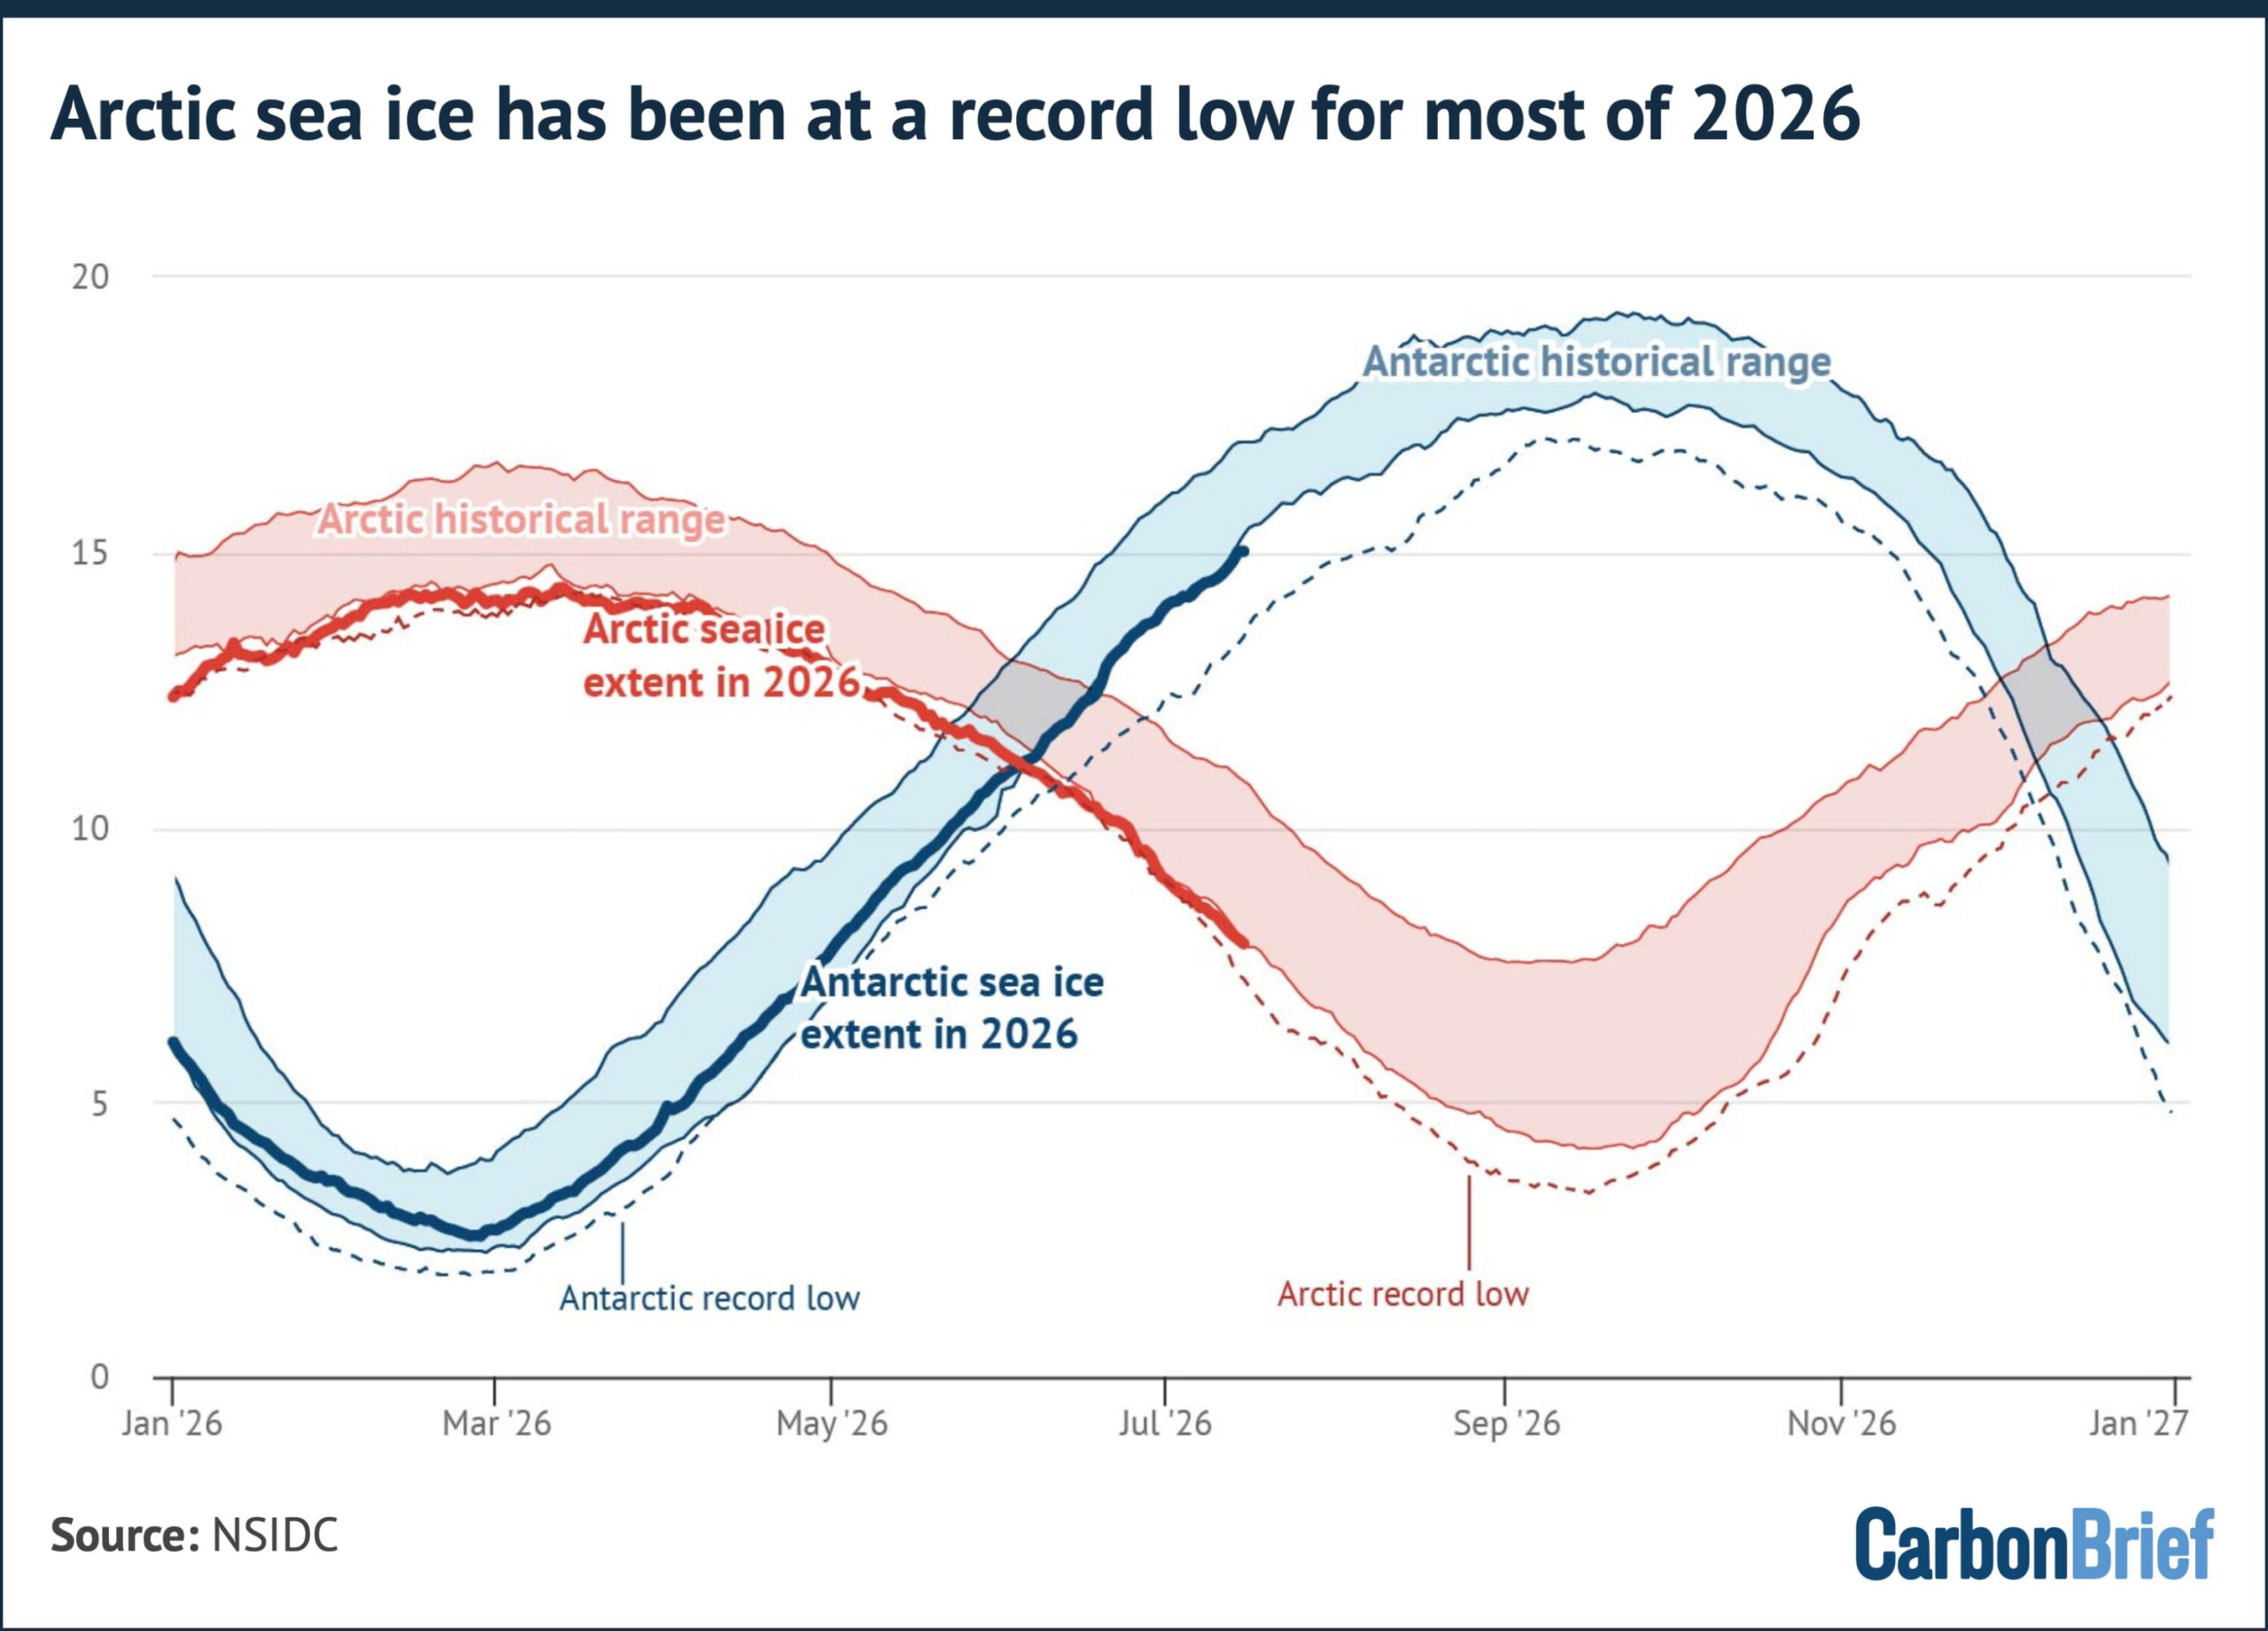
As of mid-July, Arctic extent is a bit below the 1979-2010 historical range for the date, though it remains around 0.6m square kilometres (km2) larger than the record low for the date set during 2020’s exceptional summer melt season.
The trajectory over the coming two months will determine whether 2026 challenges 2012’s record September minimum. Early-summer conditions are a poor predictor of the September minimum, which depends heavily on summer weather.
Antarctic sea ice, meanwhile, is currently around 300,000km2 below the historical envelope, but has stayed well clear of the record lows set in 2023 and has not set any new daily records yet this year.

Q&A: Europe’s May and June heatwave deaths – and how they were counted

Guest post: France’s June heatwave caused more than 2,700 heat-related deaths
Guest post: Climate change has caused one-fifth of Pine Island glacier retreat

Media reaction: How climate change intensified Europe’s record-breaking June heat
The post State of the climate: Rapidly developing El Niño raises chance of record-warm 2026 appeared first on Carbon Brief.
State of the climate: Rapidly developing El Niño raises chance of record-warm 2026

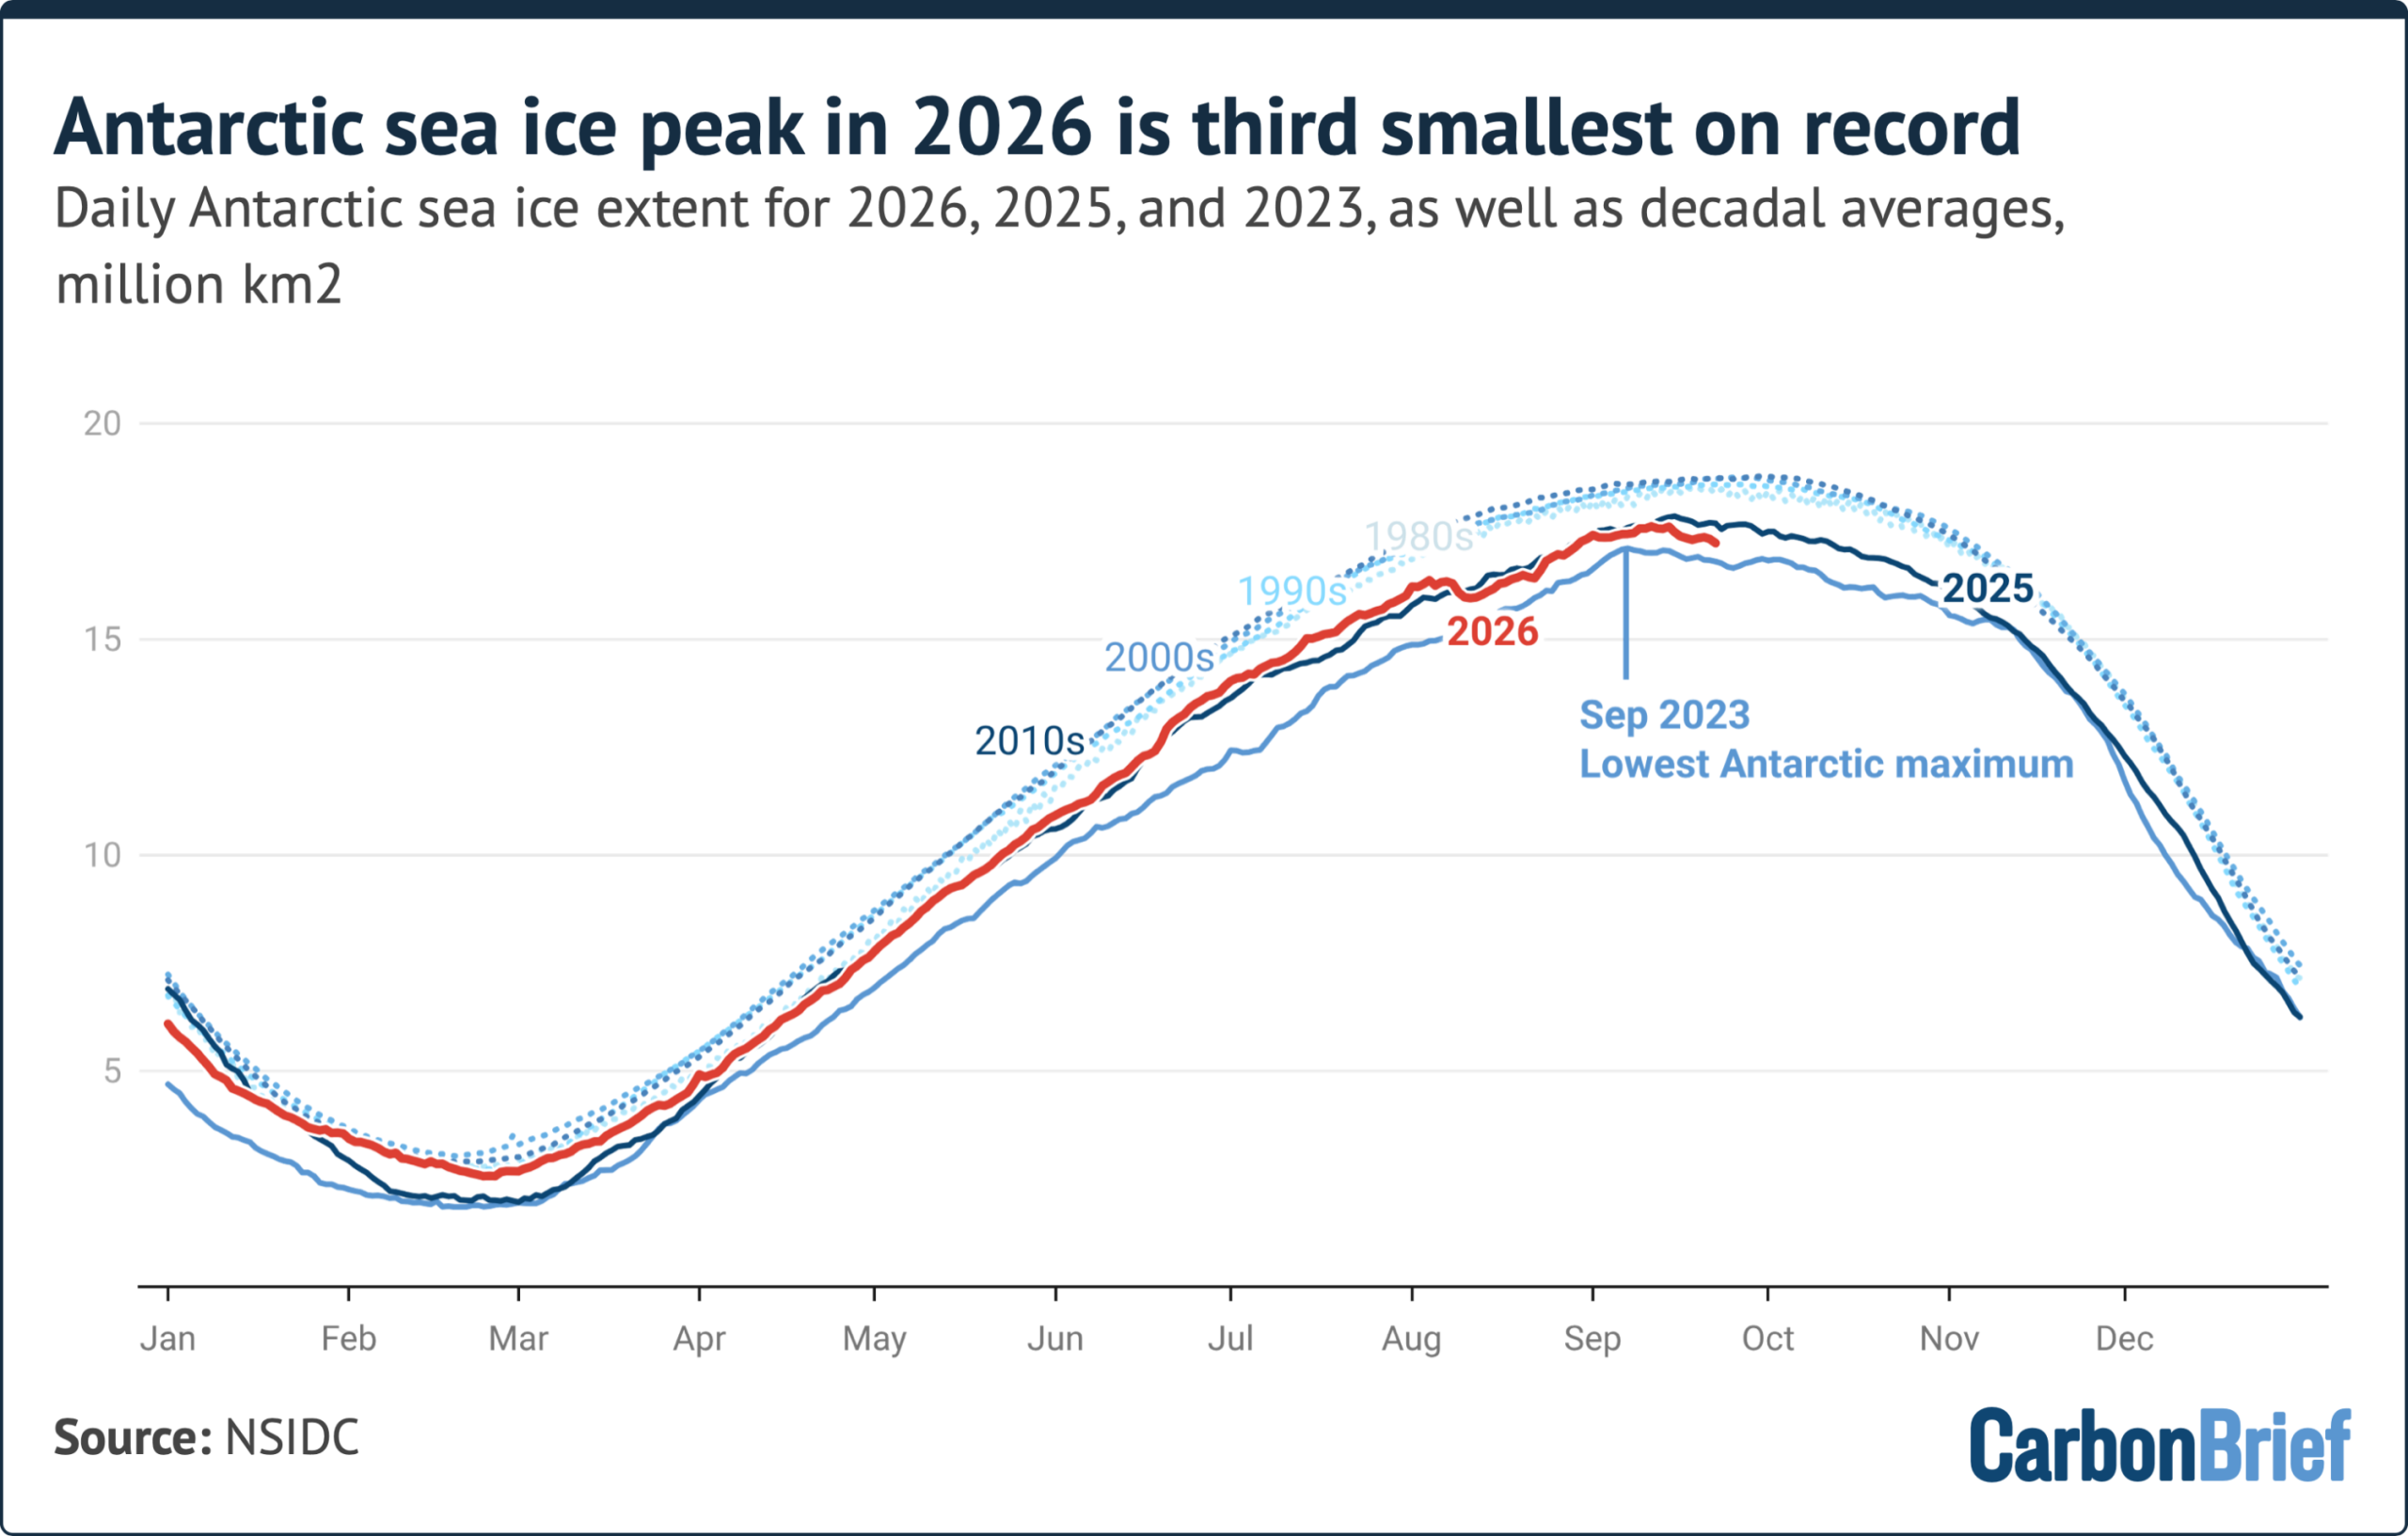
Antarctic sea ice has recorded its third-smallest winter peak extent since satellite records began 48 years ago, new data reveals.
Provisional data from the US National Snow and Ice Data Center (NSIDC) shows that Antarctic sea ice hit its annual winter peak on 14 September, with an extent of 17.59m square kilometres (km2).
The organisation notes that the data is still preliminary, adding that “large fluctuations in extent are typical of Antarctic sea ice near the seasonal maximum”.
One expert tells Carbon Brief that it is “concerning to see these low values persisting”, but says that scientists need more time to determine whether this represents a “structural shift” in Antarctic sea ice extent.
Meanwhile, at the Earth’s other pole, Arctic sea ice reached its annual minimum on 12 September, ranking as the joint-10th lowest in the satellite record.
The NSIDC notes that the last 20 years have seen the lowest 20 Arctic sea ice extents in the satellite record.
Antarctic peak
Dr Lettie Roach, a polar climate scientist at the Alfred Wegener Institute in Germany, tells Carbon Brief that this year’s Antarctic sea ice maximum was “well below average for the season”. She warns that, “after several decades of stable or increasing winter Antarctic sea ice conditions, it is concerning to see these low values persisting”.
She adds:
“Compared with the Arctic, it’s less clear how recent changes in Antarctic sea ice are attributable to human-caused warming vs natural variability. We need more years of observations to better understand whether this is truly a structural shift.”
Dr Clare Eayrs, a postdoctoral researcher at the Korea Polar Research Institute (KOPRI), tells Carbon Brief that, since recording a “near-average February minimum” extent, Antarctic sea ice has “returned to unusually low winter coverage”.
She notes that Antarctic sea ice extent in July and August this year were the fifth and fourth lowest on record, respectively, adding that “all five of the lowest July extents have occurred since 2022 and all four of the lowest August extents since 2023”.
The chart below shows Antarctic sea ice extent in 2025 (dark blue) and 2026 (red) so far. For comparison, the chart shows decadal averages (dotted lines) as well as 2023 (mid blue), the year of the smallest winter sea-ice maximum on record.
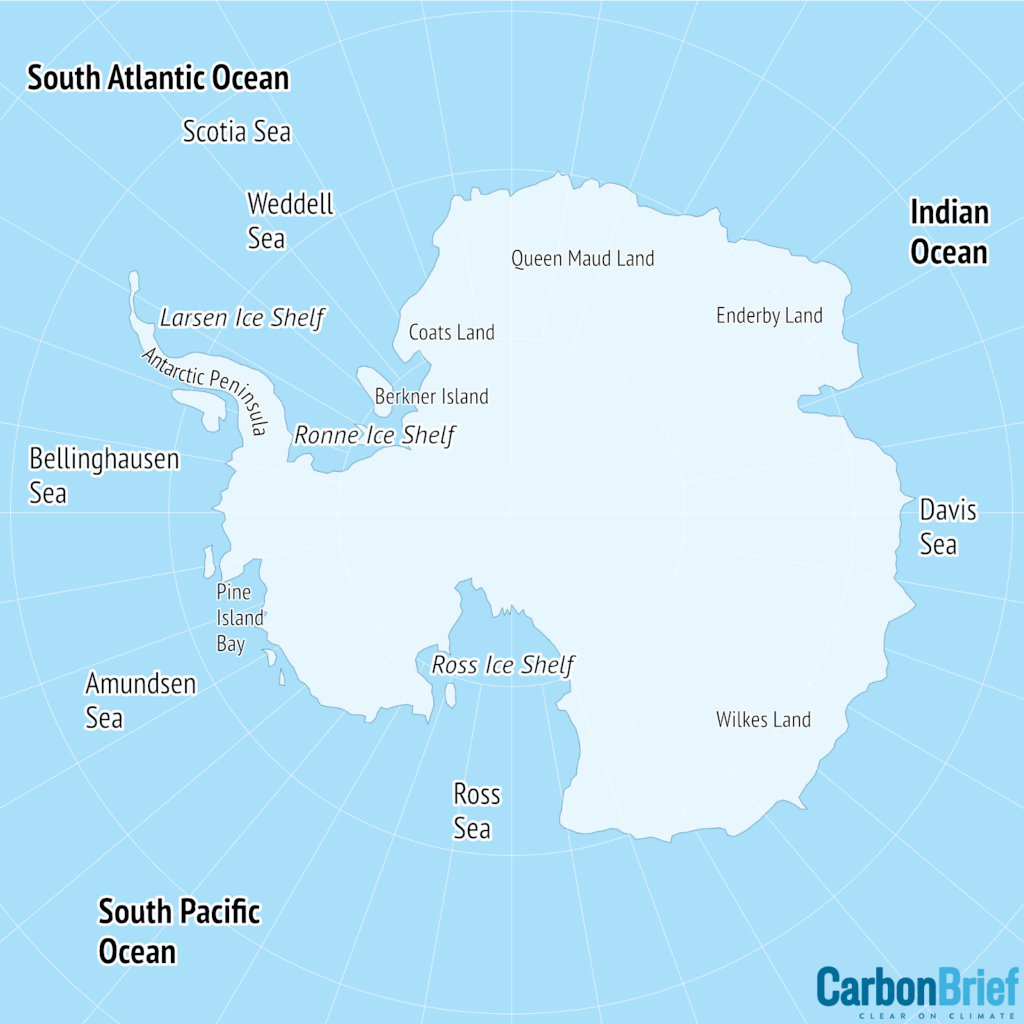
Eayrs tells Carbon Brief that the regional pattern of Antarctic sea ice cover “changed substantially during the growth season”.
For example, she says that “in April, the Bellingshausen Sea remained almost entirely ice-free, while the neighbouring Amundsen Sea had more ice than usual”.
However, by late August, changes in atmospheric pressure and wind meant that “the Bellingshausen deficit had largely recovered, while ice was unusually scarce in the Amundsen Sea and across much of East Antarctica”.
Arctic minimum
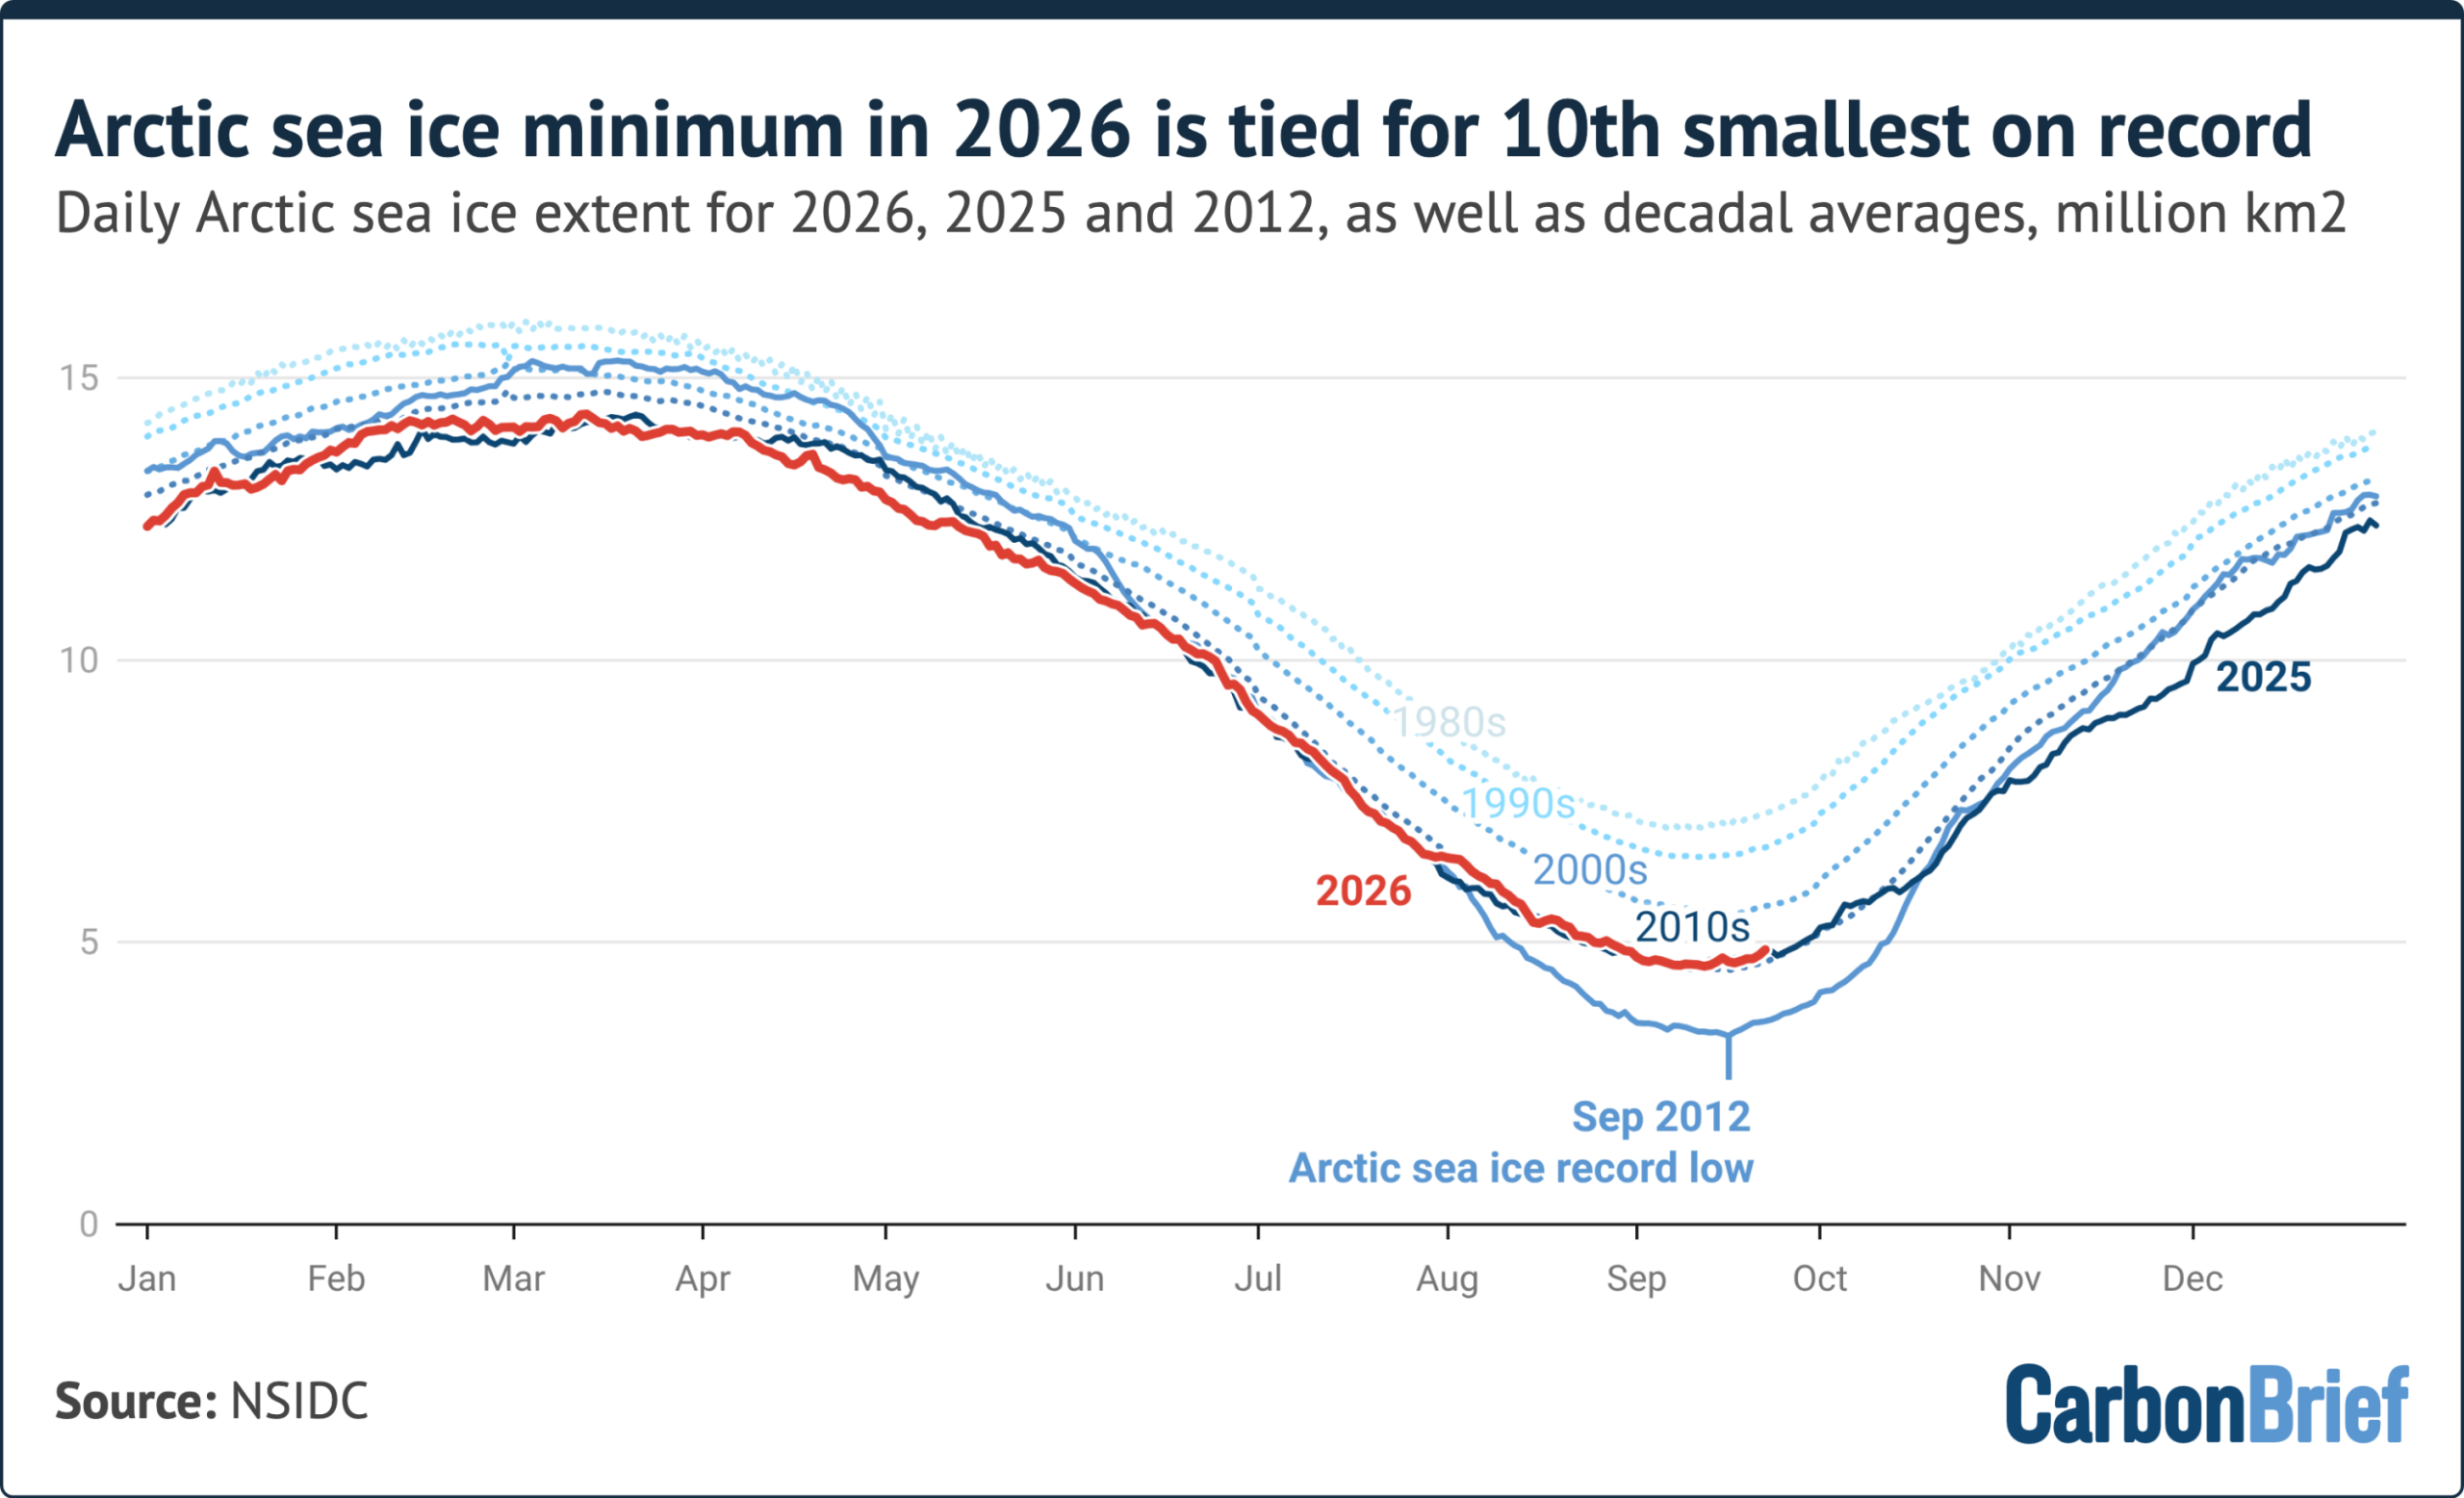
Meanwhile, the Arctic recorded its minimum summer sea ice extent on 12 September. At 4.60m km2, this year ties with 2025, 2010 and 2008 as the 10th-lowest sea ice extent on record.
The chart below shows Arctic sea ice extent in 2025 (dark blue) and 2026 (red) so far. For comparison, the chart shows decadal averages (dotted lines) as well as 2012 (mid blue), the year of the smallest summer sea-ice minimum on record.
Roach tells Carbon Brief that although this minimum is not “record setting”, it is still “lower than any sea ice minimum before 2007”. She adds:
“Human-caused climate change has reduced Arctic sea ice cover and thickness, so the region is fundamentally different compared to a few decades ago.”
Scientists have been tracking Arctic sea ice thickness using a reanalysis produced called the Pan-Arctic Ice Ocean Modeling and Assimilation System (PIOMAS) since 1979.
In March 2026, the National Oceanographic and Atmospheric Administration (NOAA) terminated a global dataset of air pressure that scientists relied upon to produce PIOMAS, forcing both datasets to stop publishing updates.
The PIOMAS website says it will take “considerable effort and time” to find alternative data to use in their reanalysis. It adds that “we don’t yet have a good sense if that’s possible with available funds and if so, when we will be able to resume production of a new PIOMAS timeseries”.
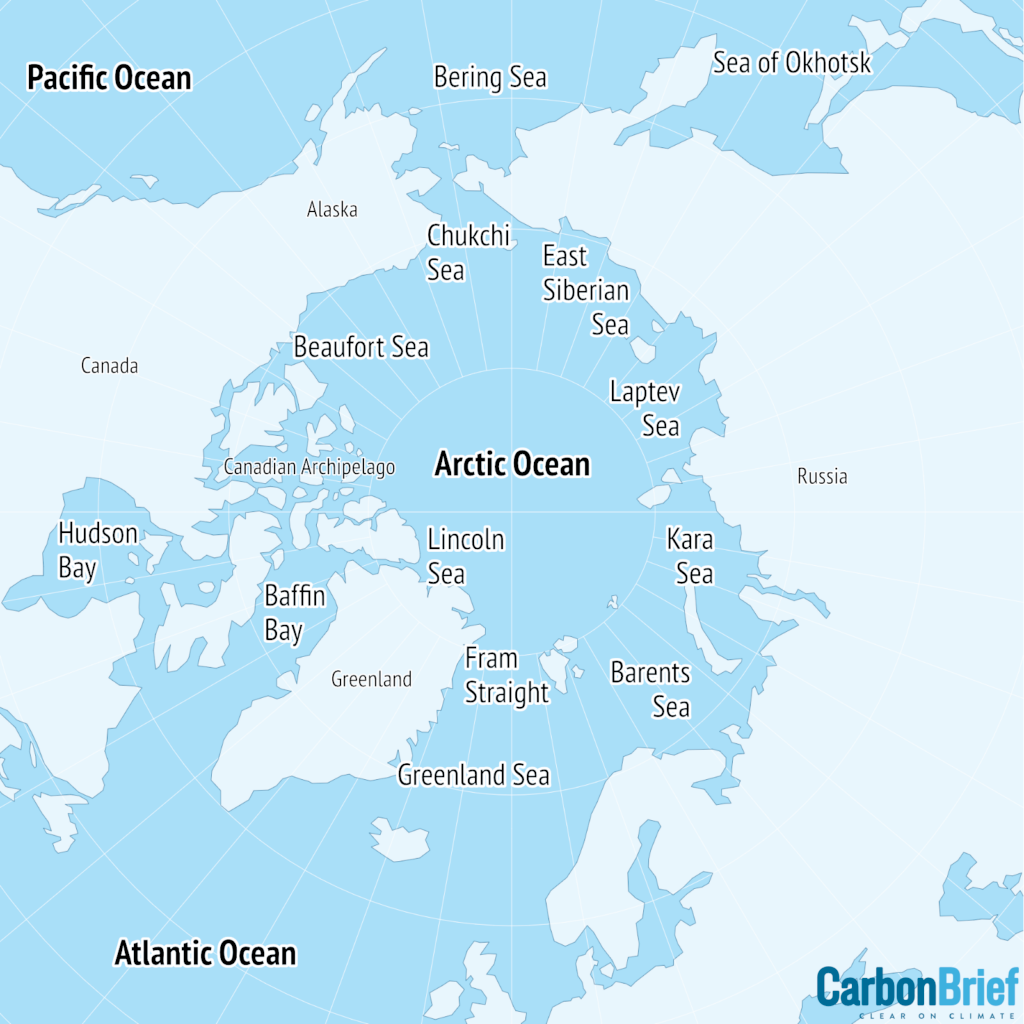
Roach also notes that August saw record-breaking heat sweep across much of the world, explaining that high temperatures “extended into Arctic coastal regions, close to regions with substantial sea ice loss – particularly the Barents-Kara and East Siberian seas”.
Dr Zack Labe, a scientist at Climate Central, tells Carbon Brief that the absence of a new record does not mean that ice cover is becoming more “resilient”. He says:
“Local weather patterns across the Arctic play a really important role in year-to-year sea-ice extent, even as the long-term trend is clearly downward.”
Labe tells Carbon Brief that weather in the Arctic this summer was “influenced mainly by lower pressure toward the central Arctic, which brought cloudier and cooler conditions that limited surface melt and delayed the start of the melt season”.
He explains that this “was most obvious across parts of the Beaufort and Chukchi seas, where the melt season didn’t really kick off until after early July, which was more than two weeks later than normal”.
In contrast, he says, the Atlantic side of the Arctic “had a much more extreme summer”, with sea ice in the Barents Sea recording its “earliest melt-out on record”.
This was partly due to “unusually warm air and ocean temperatures”, Labe says. He notes, for example, that parts of western Siberia saw unusually persistent temperatures more than 5C above the 1981-2010 average for much of the summer, which extended out over the Kara Sea and contributed to substantial ice melt in this area”.
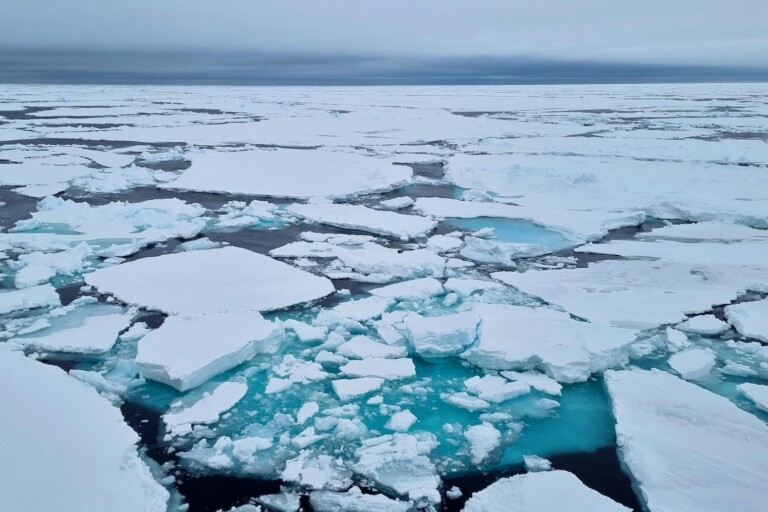
Labe tells Carbon Brief that, going forward, scientists need “more data and observations of other sea-ice metrics, like ice thickness, which may give us better insight into the overall condition of the ice pack, especially during years like 2026 when it is very fragmented”.
(In March 2026, Arctic sea ice reached its peak extent for this winter, clocking in as the joint-smallest in a satellite record going back almost half a century.)
Related
Guest post: Climate change has caused one-fifth of Pine Island glacier retreat
‘Very alarming’ winter sees Arctic sea ice hit record-low for second year running
Q&A: How Trump is threatening climate science in Earth’s polar regions
Limiting warming to 2C is ‘crucial’ to protect pristine Antarctic Peninsula
The post ‘Concerning’ low sea ice persists as Antarctic hits third-lowest winter peak appeared first on Carbon Brief.
‘Concerning’ low sea ice persists as Antarctic hits third-lowest winter peak
Participants at COP31 in Antalya will have a “duty” not to interfere in Türkiye’s internal affairs under the country’s hosting deal with the UN, reviving a clause dropped for last year’s climate summit in Brazil that human rights groups warn could put activists at risk.
Türkiye has faced growing criticism from human rights groups over the jailing of opposition figures, journalists and activists and imposed a blanket protest ban around July’s summit of the NATO military alliance in Ankara.
The contested provision is included in the binding agreement between the UN climate secretariat and the Turkish government that sets out responsibilities over logistical arrangements and details participants’ rights and obligations.
The document, signed in June but only made public on Wednesday, gives accredited COP31 attendees immunity from legal action over what they say, write or do in connection with the conference. Climate Home News understands that this safeguard can be applied to what takes place both inside and, in certain circumstances, outside of the UN-controlled COP “Blue Zone”. For the first time, this protection explicitly continues after the summit ends.

But participants enjoying these “privileges and immunities” also have a duty to respect Türkiye’s laws and regulations and not to interfere in its internal affairs, the agreement states. Rights groups fear its wide-ranging formulation could be used to discourage criticism of the host government.
Climate Home News understands that whether an action is covered by the immunity or infringes on the host’s internal affairs would be evaluated on a case-by-case basis, with close coordination between the country’s authorities and the UN climate change body.
A separate provision states that immunity shall be waived where the UN believes it would “impede the course of justice”.
‘Chilling effect’
Those same provisions featured in the host country agreements for COP28 in the United Arab Emirates and COP29 in Azerbaijan, both regarded as authoritarian regimes, before being dropped for COP30 in Brazil.
Ann Harrison, climate justice policy advisor at Amnesty International, said it is “extremely disappointing” that the COP31 agreement re-introduced clauses that could “hinder the ability of human rights defenders and civil society organisations to conduct their work safely”.
COP31 electrification pledge leaves out clean power commitment
She added the provisions could have a “wider chilling effect” on rights to freedom of expression and peaceful assembly, given concerns over the human rights situation in Türkiye, including laws that “have shrunk civic space” and their “abusive” implementation by authorities.
The UN climate change body declined to comment.
Rights groups have documented blanket protest bans, unlawful use of force by the police and prosecutions of journalists, human rights defenders and lawyers across Türkiye in the last year.
Arrests and protest bans
Last July, environmental activist Esra Işık was sentenced to more than two years for “resisting” a public official over what Amnesty International described as a peaceful protest against an urgent expropriation order linked to the expansion of coal mining in south-western Türkiye. She is appealing the conviction.
Ahead of a summit of the NATO alliance in the capital Ankara in July, authorities put in place a 13-day blanket ban on demonstrations, citing “national security”, and arrested over 200 people. Human Rights Watch said the crackdown showed Türkiye’s “ruthless intolerance of freedom of speech and assembly”.
Earlier this month, Turkish police detained dozens of people as part of what rights groups described as the government’s widening crackdown on LGBTQ+ activists and venues.
Questioned by media as to how he would guarantee the right to protest at COP31, Kurum said earlier in September that his team would “try to meet” any request they receive from civil society and give them “a free space to express themselves”.
“Don’t worry, thinking you will not be able to voice your opinions or really share your thoughts,” he said in an attempt to reassure campaigners, adding that he had put former deputy environment minister Mehmet Birpinar in charge of liaising with civil society.
Civic space needed
Camilla Pollera, human rights and climate change campaigner at the Center for International Environmental Law (CIEL), said meaningful participation at COP31 is fundamental to the legitimacy of climate action.
“At a climate summit, civil society participation necessarily includes being present, speaking out, scrutinising governments’ decisions and climate policies, and advocating for communities most vulnerable to climate change,” she added.

At last year’s COP30 summit, thousands of Indigenous people and climate activists peacefully marched through the Amazonian city of Belém in the first major demonstration outside the UN venue in four years. Smaller-scale demonstrations were largely confined to the “Blue Zone” at COP27 in Egypt, COP28 in the UAE and COP29 in Azerbaijan.
In two other separate incidents in Belém, members of the Munduruku tribe blocked access to the conference centre for hours, demanding an end to development projects in their ancestral land, and protesters stormed through the venue clashing with UN security officials.
The COP31 hosting agreement keeps some of the safeguards previously hailed by civil society groups. The government and the UN secretariat commit to upholding “the fundamental human rights” of all participants in the agreement’s preamble.
Under the deal, Türkiye also needs to ensure that security personnel follow “the highest ethical and professional standards and are expected to behave with integrity and respect”.
The post COP31 attendees told not to interfere in Türkiye’s “internal affairs” appeared first on Climate Home News.
COP31 attendees told not to interfere in Türkiye’s “internal affairs”
As rising seas submerge growing swathes of land, countries that lose territory should still keep their national boundaries, sovereign rights and UN membership, according to a political declaration adopted at the UN General Assembly in New York on Thursday.
The declaration, which was championed by climate-vulnerable small island states, affirms “the presumption in favour of continued statehood” in the face of sea level rise fuelled by climate change, and urges countries to work together to assist communities affected by encroaching oceans.
Speaking at a high-level UN meeting to address the existential threats posed by sea level rise, Cabo Verde’s Prime Minister Francisco Carvalho, one of the initiative’s co-facilitators along with Australia, said the adoption of the text by consensus sends “a message of hope”.
“This declaration has a very special meaning. For us, sea level rise is neither a distant threat nor a theoretical concern,” he said, adding that rising seas put at risk key infrastructure, water resources and economic growth in small island states.
In the Pacific, sea levels have risen at twice the global rate, dramatically increasing coastal flooding events from two to 20 a year in the Republic of the Marshall Islands, and from zero to 102 events per year in American Samoa, according to the World Meteorological Organization (WMO).
Surangel Whipps Jr., president of the Pacific island of Palau, said the summit in New York represents a “moment of international solidarity”, and highlighted that small island states will remain permanent members of the UN.
-
Push for cooking to be part of COP31’s electrification agenda
The President of Kenya and the British climate envoy said Africa should use the global electrification push to roll out clean cooking -
Germany unveils plan to end use of fossil fuels in energy sector by 2045
Germany became the third country to publish a roadmap to phase out fossil fuels after France and the Netherlands, as the UN chief calls on all governments to follow -
UN Climate Summit: UN chief says world has tools to end fossil fuel age
At the UN Secretary-General’s climate summit in New York, countries shared their energy transition plans while Nepal and island nations advocated for more international support



Declaration recognises statehood
An advisory opinion by the world’s top maritime court, the International Tribunal on the Law of the Sea (ITLOS), first upheld in 2024 that countries do not have to shrink their maritime borders even if they lose land territory due to sea level rise. This was reiterated by the International Court of Justice in last year’s landmark ruling on the climate obligations of states.
The new declaration endorsed by all governments at the UN General Assembly stresses that sea level rise “is not a distant scenario but a real and lived experience for many”, and notes that international law must be implemented in global responses to rising seas.
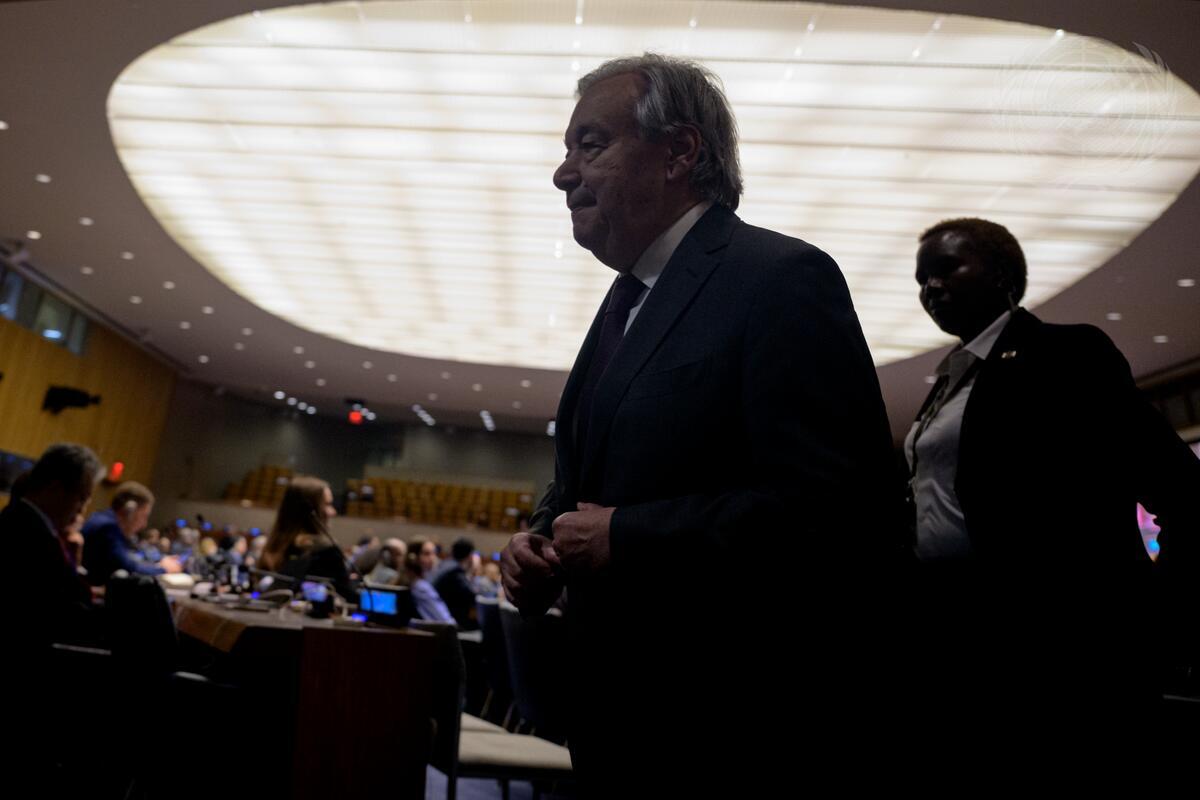
UN Secretary-General António Guterres said the “milestone must now be translated into action”, adding that the declaration should encourage an “ongoing dialogue” at the “highest possible level” leading to practical outcomes. Pacific islands have proposed an international treaty on sea level rise that would provide more legal certainty.
“Those on the frontlines must be front and centre on every decision. We cannot allow countries and cultures to vanish beneath the waves,” he said. “The SOS has gone out. The world must answer.”
At regional summit, Pacific islands ask for COP31 support for clean energy and finance
Goodwin Friday, prime minister of St. Vincent and the Grenadines, said measures to protect vulnerable states will require adequate finance. “Investing in resilience now is more cost-effective than paying the far greater price for loss and damage later,” he added.
Championed by Australia’s COP31 co-presidency, Pacific islands have sought to put adaptation to sea level rise and ocean conservation at the top of the political agenda by inviting world leaders to attend the pre-COP31 summit co-hosted by Fiji and Tuvalu in October.
Tuvalu will also host the second global fossil fuel phase-out summit in April 2027, after around 60 governments met this year in Santa Marta, Colombia, to discuss ending their dependence on coal, oil and gas.
“Our coastlines, our reefs and our communities are living with the consequences of fossil fuel dependence every day, and our people have earned the right to help shape the way forward,” Lynda Tabuya, Fiji’s climate minister, said in a statement announcing details of the conference.
Ocean monitoring gets a boost in New York
Amid record-breaking marine heat and seas rising at unprecedented speed, governments in New York announced new commitments to protect the world’s ocean, as efforts to bolster marine ecosystems and coastal communities rise up the political agenda.
On Wednesday, the EU and Canada announced more funding for a new Europe-led ocean monitoring system called OceanEye, launched in the aftermath of a failed attempt by the Trump administration to dismantle the largest existing network of deep-sea observatories.
During an event at UN headquarters in New York, EU President Ursula von der Leyen and Canadian Prime Minister Mark Carney announced around $163 million in new funding for the initiative, with the EU pledging €92 million ($105m) on top of existing seed funding and Canada pledging C$82 million (US$58m) over five years.
According to an EU statement, while OceanEye will collaborate with the Global Ocean Observing System, that network “remains vulnerable to financial shortfalls and geopolitical disruptions”. A group of 30 countries from Europe, Africa and the Americas joined an international initiative in support of OceanEye, including large coastal nations like Brazil, Namibia and Mexico.
Von der Leyen said OceanEye “can make us the leading ocean data provider in a matter of years”, including by launching new satellites and installing new observatories in the deep ocean. “From outer space to the deepest ocean, our funding helps us keep watch beneath the waves,” she added.
Carney said the initiative would help protect Canada’s Arctic region with real-time monitoring operating year-round. “We can’t protect what we can’t see,” he said, also highlighting that Canada had expanded conservation of its ocean territory from 1% a decade ago to 15% now.
In New York, a group of 19 countries said they are either developing or implementing plans to sustainably manage all of their ocean territory, with 12 new nations joining the initiative. In a joint communiqué, they called on more countries to sign up ahead of COP31.
Warnings of El Niño-fuelled extreme heat
Scientists and world leaders have raised the alarm over this year’s record-breaking marine temperatures, which have persisted above historical peaks for more than 100 days as the naturally occurring El Niño phenomenon intensifies in the Pacific.
Extreme ocean heat could become a threat to coastal ecosystems and communities, experts fear. Water temperatures 1.5C above normal levels have also rapidly fuelled a strong hurricane in the Pacific in recent days.
Despite scientific calls for additional ocean conservation efforts, a report launched this week in New York warned that efforts to protect ocean ecosystems are lagging behind, with only 10% of the global ocean covered by conservation areas and just 3.5% designated as “effectively protected”.
The post Threatened by rising seas, small islands secure right to keep their statehood appeared first on Climate Home News.
Threatened by rising seas, small islands secure right to keep their statehood



-

 Greenhouse Gases2 years ago
嘉宾来稿:满足中国增长的用电需求 光伏加储能“比新建煤电更实惠”
-
Climate Change1 year ago
Guest post: Why China is still building new coal – and when it might stop
-
Greenhouse Gases1 year ago
Guest post: Why China is still building new coal – and when it might stop
-

 Climate Change2 years ago
嘉宾来稿:满足中国增长的用电需求 光伏加储能“比新建煤电更实惠”
-
Climate Change2 years ago
Bill Discounting Climate Change in Florida’s Energy Policy Awaits DeSantis’ Approval
-

 Renewable Energy11 months ago
Sending Progressive Philanthropist George Soros to Prison?
-
Greenhouse Gases1 year ago
嘉宾来稿:探究火山喷发如何影响气候预测
-

 Climate Change2 years ago
Analysis: China’s CO2 falls 1% in Q2 2024 in first quarterly drop since Covid-19