Connect with us

Published

on

Last year was the hottest the Earth has experienced since the start of global temperature records in the mid-1800s – and likely for many thousands of years before.

The year 2024 was the first in which average global temperatures at the surface of the planet exceeded 1.5C above pre-industrial levels in the majority of leading datasets.

While reaching 1.5C in an individual year is not equivalent to a breach of the Paris Agreement’s 1.5C limit – which refers to long-term warming – it nevertheless indicates that the world is quickly approaching this internationally agreed threshold.

Here, Carbon Brief examines the latest data across the Earth’s oceans, atmosphere, cryosphere and surface temperature. (Use the links below to navigate between sections.)

Noteworthy findings from this 2024 review include…

  • Global surface temperatures: It was the warmest year on record by a large margin – at between 1.46C and 1.62C above pre-industrial levels across different temperature datasets and 1.55C in the World Meteorological Organization (WMO) synthesis.
  • Exceptional monthly temperatures: Global temperatures set a new record each month between January and June, extending a 15-month record-setting stretch which began in 2023.
  • Warmest over land: Global temperatures over the world’s land regions – where humans live and primarily experience climate impacts – were a record 2.3C above pre-industrial levels.
  • Warmest over oceans: Global sea surface temperatures set a new record at 1.1C above pre-industrial levels.
  • Ocean heat content: It was the warmest year on record for ocean heat content. In 2024, the oceans added 25 times more heat than all annual human energy use.
  • Regional warming: It was the warmest year on record in more than 100 countries – including China, Canada, Mexico, Germany, Brazil, Greece, Malaysia and South Korea – and in areas where a total of 3.3 billion people live.
  • Unusual warmth: The specific causes behind the exceptionally warm, record-setting temperatures in both 2023 and 2024 remain an open scientific question, with human-caused greenhouse gases, variability in El Niño and changes in the reflectivity of clouds all playing a role.
  • Comparison with climate models: Observations for 2024 are above the central estimate of climate model projections in the Intergovernmental Panel on Climate Change (IPCC) sixth assessment report, but well within the model range.
  • Heating of the atmosphere: It was the warmest year in the lower troposphere – the lowest part of the atmosphere – by a large margin.
  • Sea level rise: Sea levels reached new record highs, with notable acceleration over the past three decades.
  • Shrinking glaciers and ice sheets: Cumulative ice loss from the world’s glaciers and from the Greenland ice sheet reached a new record high in 2024, contributing to sea level rise.
  • Greenhouse gases: Concentrations reached record levels for carbon dioxide (CO2), methane and nitrous oxide.
  • Sea ice extent: Arctic sea ice saw its seventh-lowest minimum extent on record, while Antarctic sea ice was at the second-lowest level on record for much of the year.
  • Looking ahead to 2025: Carbon Brief predicts that global average surface temperatures in 2025 are likely to be the third warmest on record after 2024 and 2023, at around 1.4C above pre-industrial levels. However, large uncertainties remain given how exceptionally and unexpectedly warm the past two years have been.

Record warm surface temperatures

Global surface temperatures set a new record in 2024, surpassing the record set in 2023 by around 0.11C. It was unambiguously the warmest year since records began in the mid-1800s. 2024 was far warmer than any year prior to 2023, exceeding the previous record (set in 2016) by a massive 0.26C.

The figure below shows global surface temperature records from five different datasets: NASA, NOAA, the Met Office Hadley Centre/University of East Anglia’s (UEA) HadCRUT5, Berkeley Earth and Copernicus ERA5.

Other surface temperature datasets not shown – including JRA-3Q, the AIRS satellite data and the Japanese Meteorological Agency – also show 2024 as the warmest year on record.

Annual global average surface temperatures over 1850-2024. Data from NASA GISTEMP, NOAA GlobalTemp, Hadley/UEA HadCRUT5, Berkeley Earth and Copernicus ERA5. Temperature records are aligned over the 1981-2010 period and use the WMO approach to calculate warming relative to the pre-industrial (1850-1900) baseline. Chart by Carbon Brief.

Global surface temperature records can be calculated back to 1850, though some groups such as NASA GISTEMP choose to start their records in 1880 when more data was available.

Prior to 1850, records exist for some specific regions, but are not sufficiently widespread to calculate global temperatures with high accuracy (though work is ongoing to identify and digitise additional records to extend these further back in time).

These longer surface temperature records are created by combining ship- and buoy-based measurements of ocean sea surface temperatures with temperature readings of the surface air temperature from weather stations on land. (Copernicus ERA5 and JRA-3Q are an exception, as they use weather model-based reanalysis to combine lots of different data sources over time.)

Some differences between temperature records are apparent early in the record, particularly prior to 1900 when observations are more sparse and results are more sensitive to how different groups fill in the gaps between observations. However, there is strong agreement between the different temperature records for the period since 1970, as shown in the figure below.

Global surface temperature records, 1970-2024

Annual global average surface temperatures as in the prior chart, but showing the period from 1970-2024. Chart by Carbon Brief.

Global temperatures in 2024 clearly stand out as much warmer than anything that has come before, above even the exceptionally warm temperatures of 2023. This can be seen in the figure below from Berkeley Earth. Each shaded curve represents the annual average temperature for that year. The further that curve is to the right, the warmer it was.

The width of each year’s curve reflects the uncertainty in the annual temperature values, which is caused by factors such as changes in measurement techniques and the fact that some parts of the world have fewer measurement locations than others.

Global mean temperature anomaly and uncertainty in degrees C.
Global average surface temperatures for each year, relative to 1850-1900, with their respective uncertainties (width of the curves) from the Berkeley Earth surface temperature record. Figure from Berkeley Earth.

The year 2024 was the warmest on record for both the world’s land and ocean regions. Global average land temperatures were around 2.3C above pre-industrial levels in the Berkeley Earth dataset, while global ocean temperatures exceeded 1.1C.

The figure below shows land (red) and ocean (blue) temperatures along with their respective confidence intervals, relative to pre-industrial levels, in the Berkeley Earth surface temperature record.

Land and ocean temperatures 1850-2024
Land and ocean temperature rise since the pre-industrial 1850-1900 period. Figure from Berkeley Earth.

Global land regions – where the global human population lives – has been warming around 70% faster than the oceans – and 40% faster than the global average in the years since 1970.

2024 started off quite hot, boosted by an El Niño event that peaked at the start of the year. The first six months of the year set new all-time monthly records, extending a run of 15 record-setting months that started in July 2023. The latter part of the year remained warm, and was only slightly exceeded by the exceptionally hot temperatures experienced in the second half of 2023.

The figure below shows each month of 2024 in black, compared to all prior years since 1940. Each year is coloured based on the decade in which it occurred, with the clear warming over time visible, as well as the margin by which both 2023 and 2024 exceeded past years.
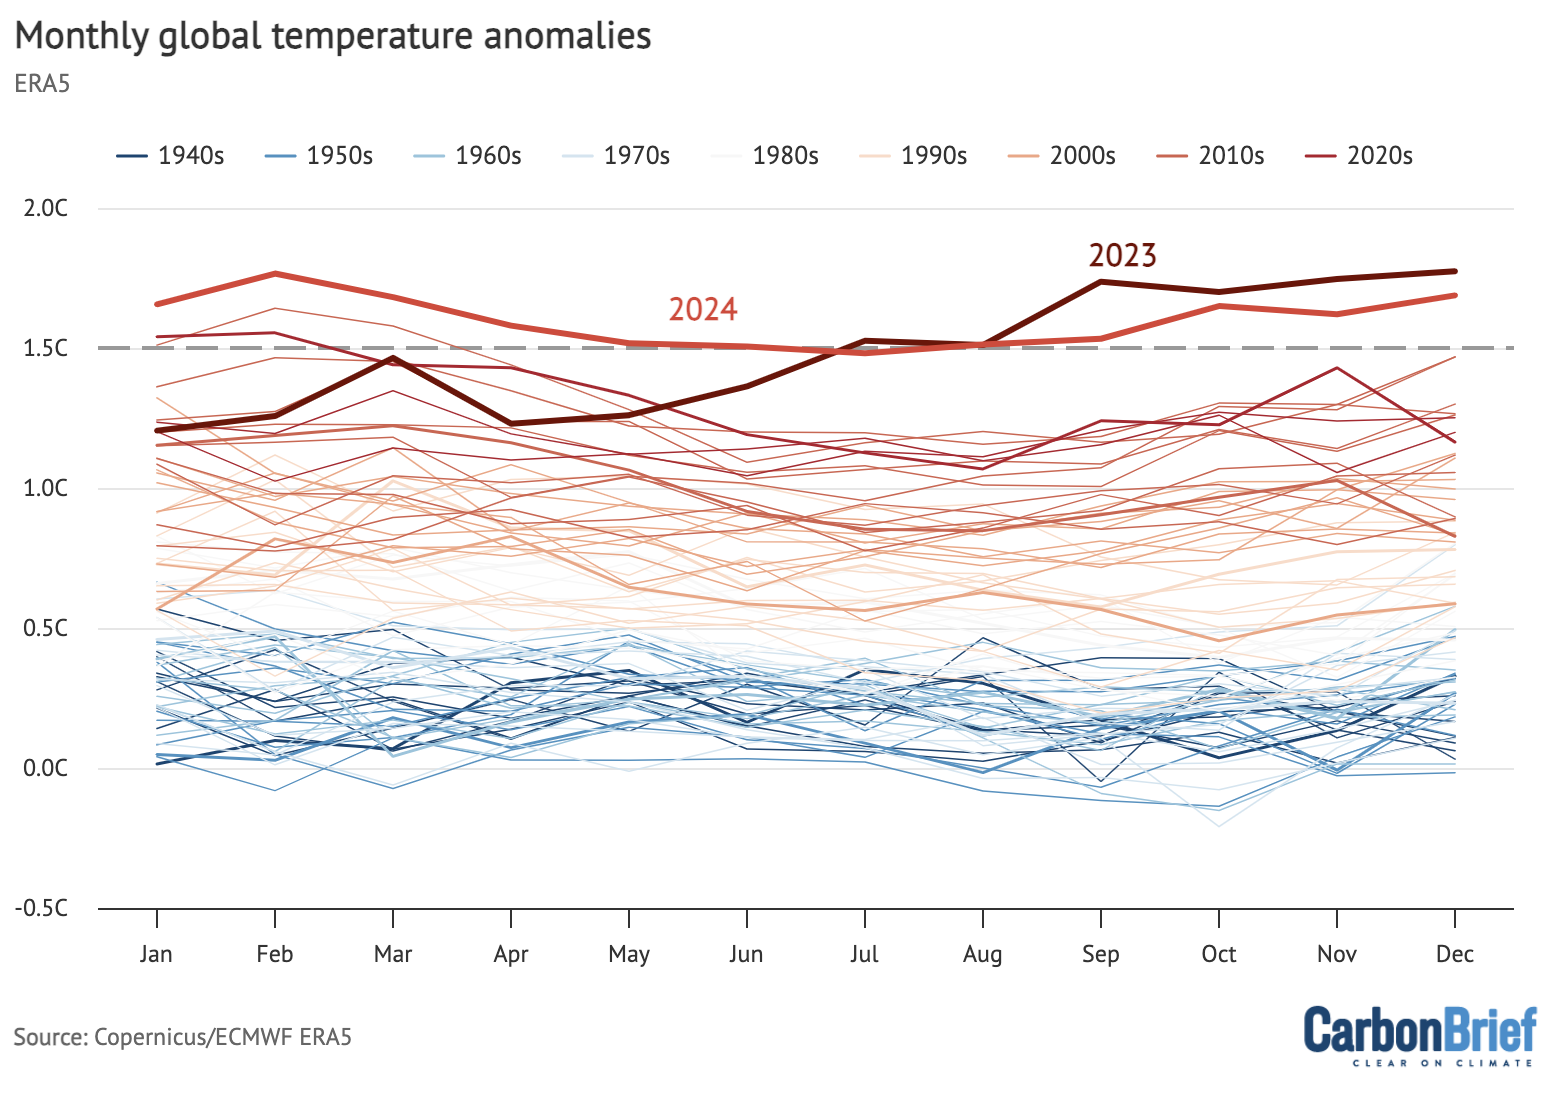
Monthly global temperature anomalies

Monthly global surface temperatures for each year since 1940, with anomalies shown relative to the pre-industrial 1850-1900 period using data from Copernicus/ECMWF ERA5. Chart by Carbon Brief.

First year above 1.5C in most records

In the 2015 Paris Agreement, countries agreed to work to limit global temperatures to “well below 2C” and to pursue efforts to limit the temperature increase to 1.5C above pre-industrial levels”.

While the agreement did not specifically define how to measure the breach of these climate targets, the goals have been widely interpreted (including by the IPCC) to refer to temperature averages over 20 years.

In other words, the limits refer to long-term warming, rather than an individual year that includes the short-term influence of natural fluctuations in the climate, such as El Niño.

However, a single year exceeding 1.5C still represents a grim milestone and a sign that the world is quickly approaching the target. And, in the majority of datasets in 2024, global surface temperatures exceeded 1.5C for the first time. (In the Berkeley Earth dataset, 2023 was actually the first year above 1.5C.)

Temperature record 2024 temperatures relative to preindustrial
NASA GISTEMP 1.47C
Hadley/UAE HadCRUT5 1.53C
NOAA GlobalTemp 1.46C
Berkeley Earth 1.62C
Copernicus/ECMWF 1.60C
JRA-3Q 1.59C
Japanese Meteorological Agency 1.52C

Global temperature anomalies for 2024 relative to pre-industrial temperatures (1850-1900).

NOAA and NASA were the only organisations to report global temperatures below 1.5C – and by just a few hundredths of a degree. Berkeley Earth, Copernicus and JRA-3Q all estimated that temperatures were around 1.6C.

This year, the World Meteorological Organization (WMO) provided a synthesis of the different global surface temperature records – incorporating NASA, Hadley, NOAA, Berkeley, Copernicus and JRA-3Q data – which is a useful tool to provide a best-estimate across the different groups. It finds that 2024 was the first year above 1.5C, coming in at 1.55C compared to 1.45C in 2023.

The figure below shows various temperature records along with their published uncertainty range (where available), alongside the WMO synthesis estimate.
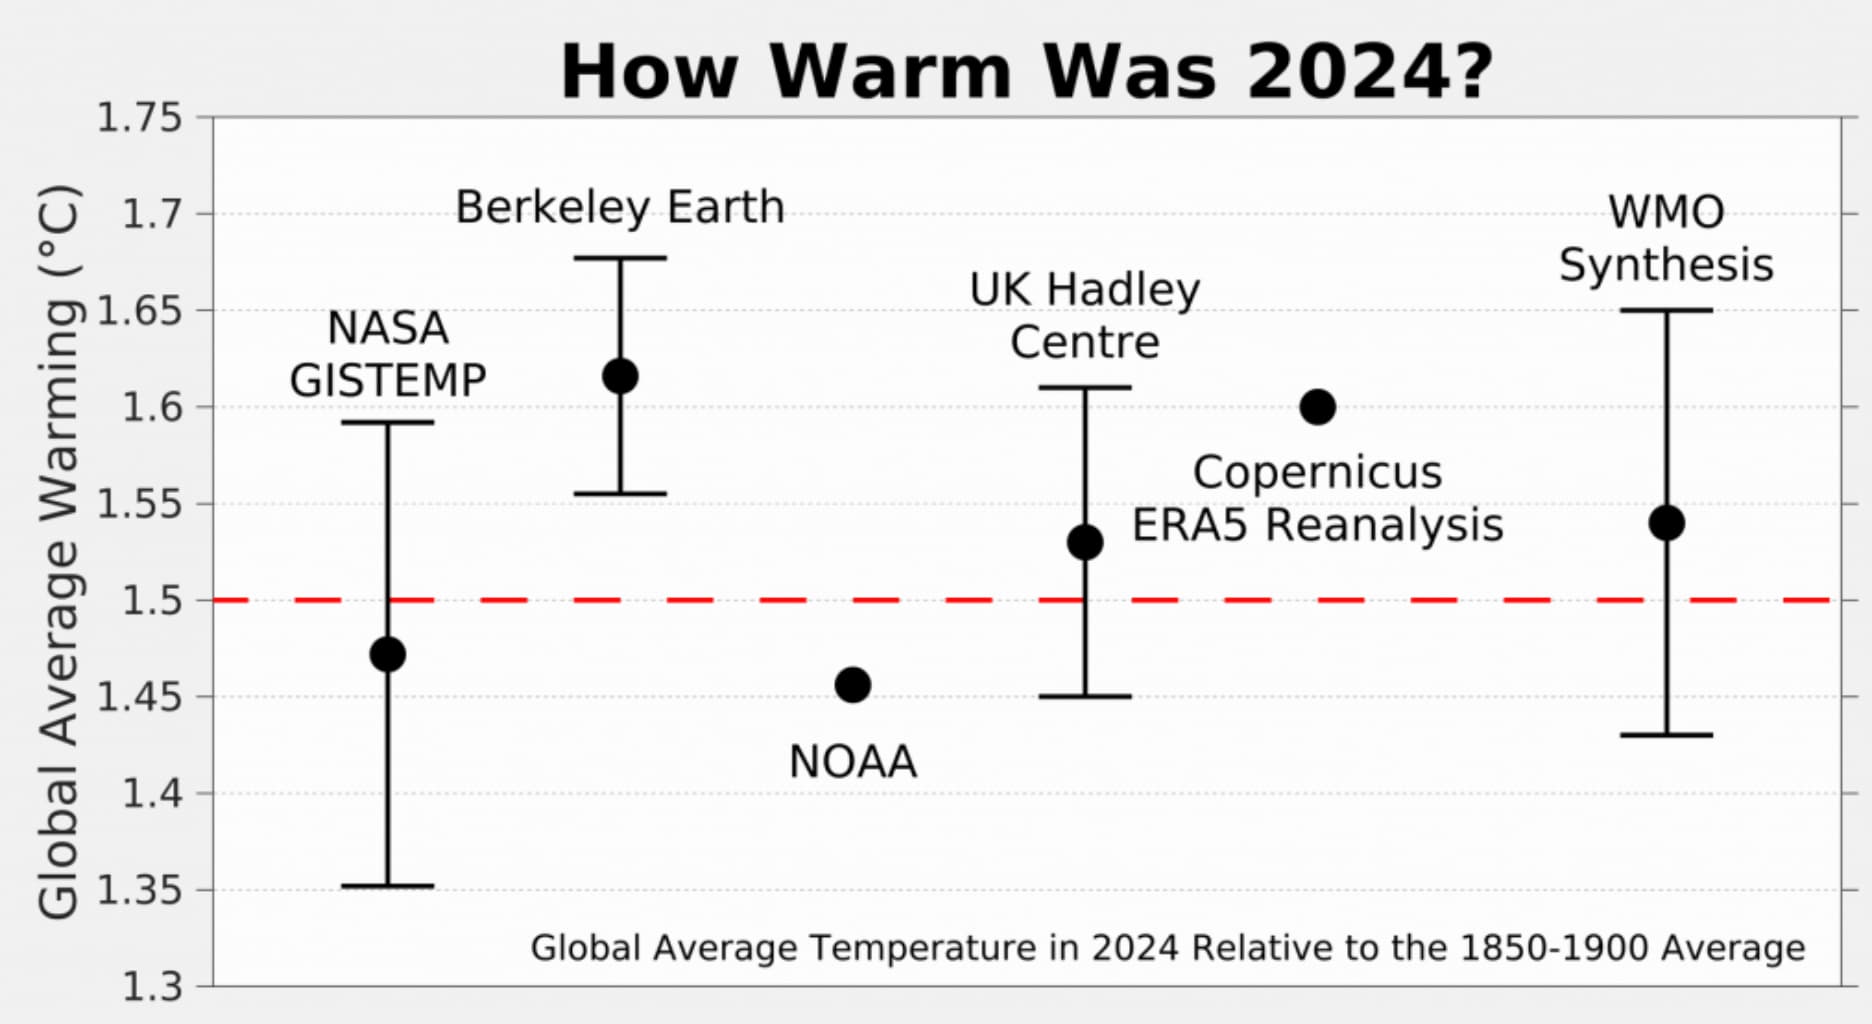
How warm was 2024? Global average temperatures in 2024 relative to the 1850-1900 average
Global surface temperatures in 2024 from each group and the WMO synthesis, with anomalies shown relative to the pre-industrial 1850-1900 period and uncertainties plotted when available. Figure from Berkeley Earth.

As noted earlier, these datasets are nearly identical over the past 50 years. Differences in warming relative to pre-industrial levels emerge earlier in the record, particularly prior to 1900 when observations are more sparse and the choice of how to fill in the gaps between observations has a large impact on the resulting temperature estimate.

The figure below shows how different temperature records look if each is calculated relative to its own pre-industrial baseline, rather than using an average pre-industrial baseline as shown in the prior section. Focusing on warming since pre-industrial levels – rather than more recent warming – magnifies differences between groups, with the variation in warming across groups largely due to the most uncertain early part of the record.
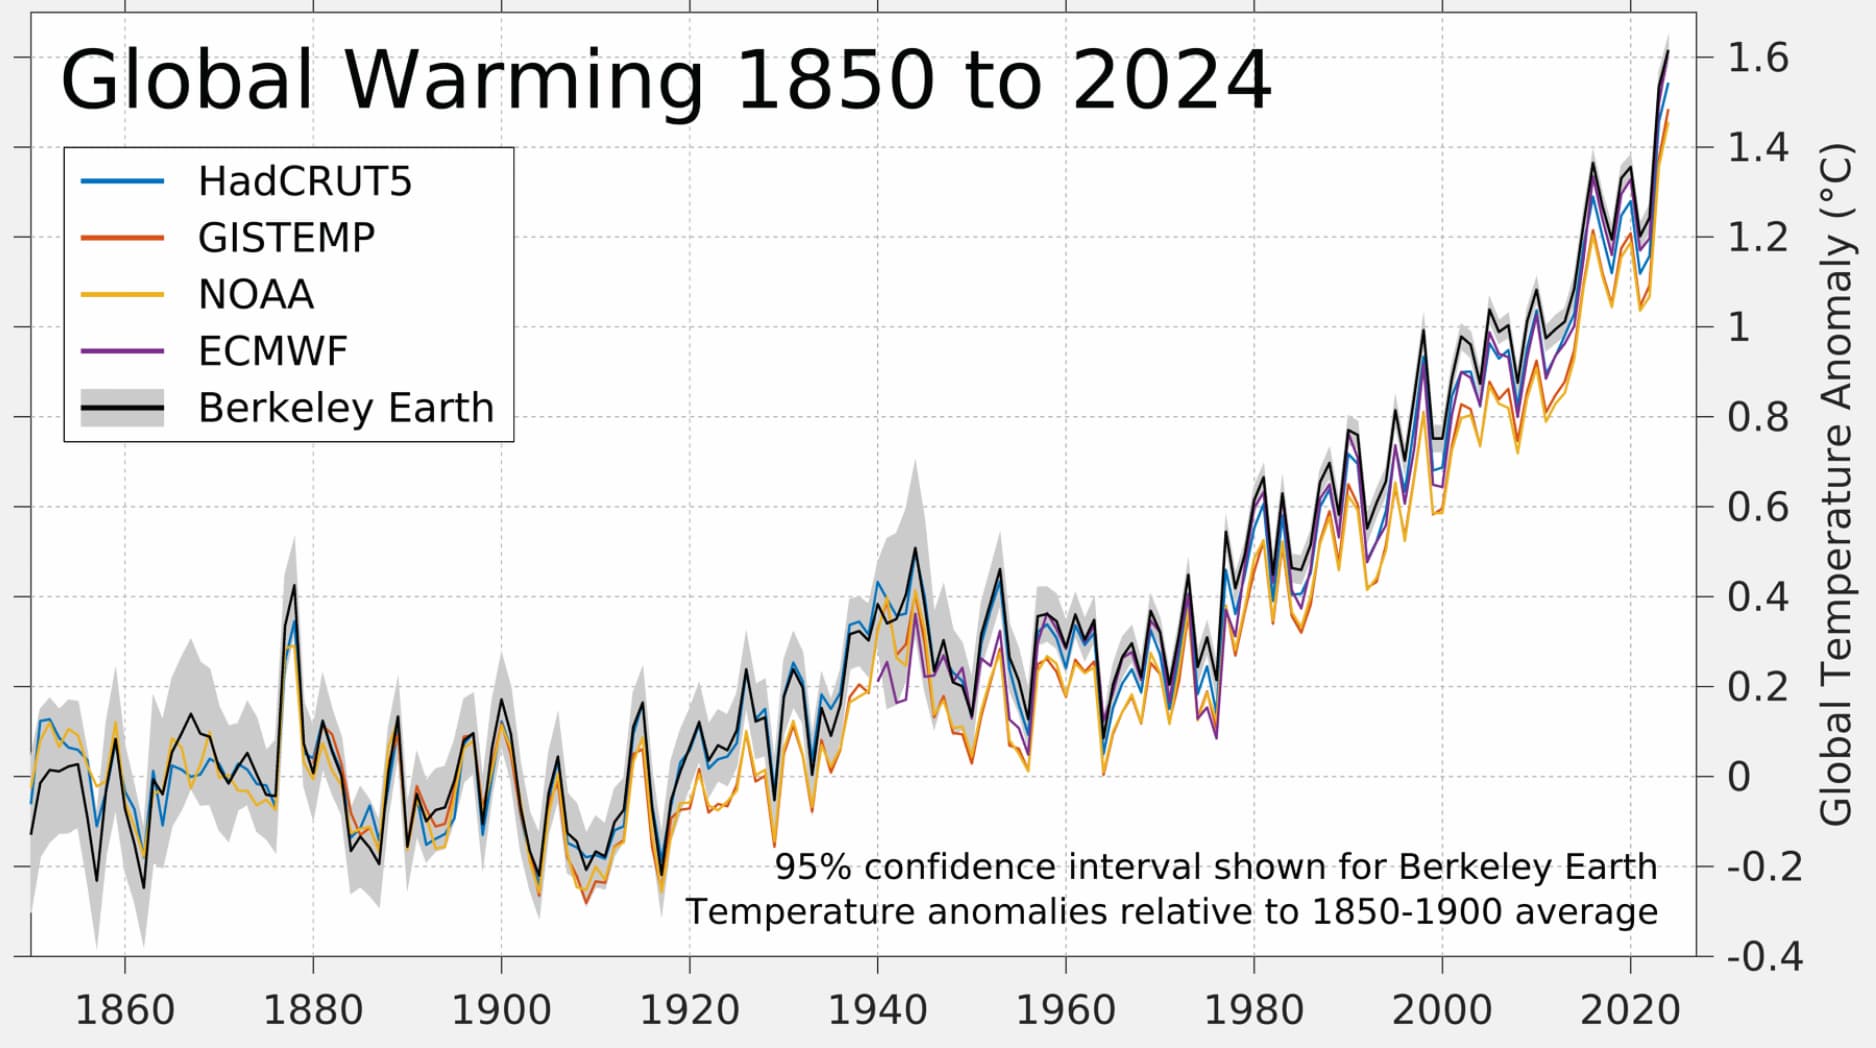
Global warming 1850 to 2024 (95% confidence interval shown for Berkeley Earth temperature anomalies relative to 1850-1900 average)
Annual global surface temperatures since 1850, with anomalies shown relative to the pre-industrial 1850-1900 period for each dataset. Figure from Berkeley Earth.

Ocean heat content sets another record

Last year was the warmest on record for the heat content of the world’s oceans. Ocean heat content (OHC) has increased by around 484 zettajoules – a billion trillion joules – since the 1940s. The heat increase in 2024 alone compared to 2023 – about 16 zettajoules – is around 25 times as much as the total energy produced by all human activities on Earth in 2023 (the latest year in which global primary energy statistics are available).

Human-emitted greenhouse gases trap extra heat in the atmosphere. While some of this warms the Earth’s surface, the vast majority – around of 93% – goes into the oceans. About two-thirds of this accumulates in the top 700 metres, but some also ends up in the deep oceans.

The figure below shows annual OHC estimates between 1950 and present for the upper 700 metres (light blue shading) and 700-2,000 metres (dark blue) of the ocean.
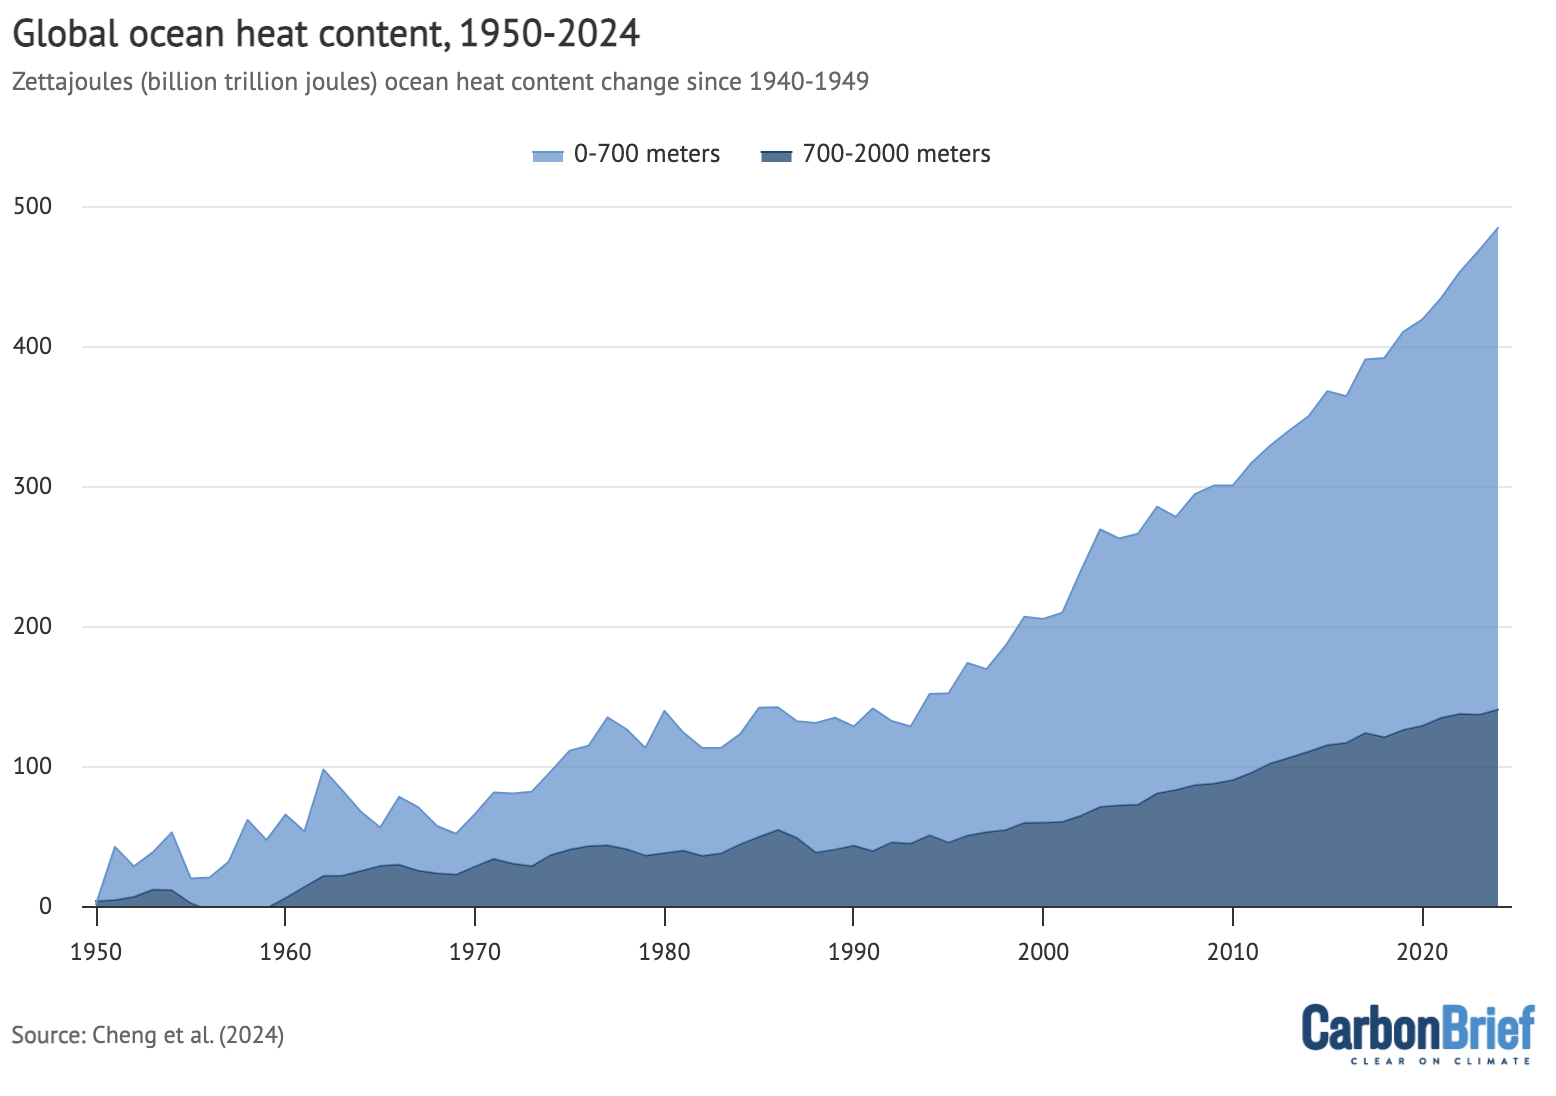
Global ocean heat content, 1950-2024

Annual global ocean heat content (in zettajoules – billion trillion joules, or 10^21 joules) for the 0-700 metre and 700-2,000 metre layers. Data from Cheng et al. (2024). Chart by Carbon Brief.

In many ways, OHC represents a much better measure of climate change than global average surface temperatures, because it is where most of the extra heat ends up and is much less variable on a year-to-year basis than surface temperatures.

The graph above shows a distinct acceleration in OHC after 1991, matching the increased rate of greenhouse gas emissions and other radiative forcing elements over the past few decades.

A year of climate extremes

While media coverage of 2024 temperatures has largely focused on the global average, many different regions of the planet experienced climate extremes.
The figure below shows global temperature anomalies in 2024 across the world, with the red areas warmer than the baseline period (1951-80) used by Berkeley Earth and the (few) blue areas experiencing cooler temperatures.
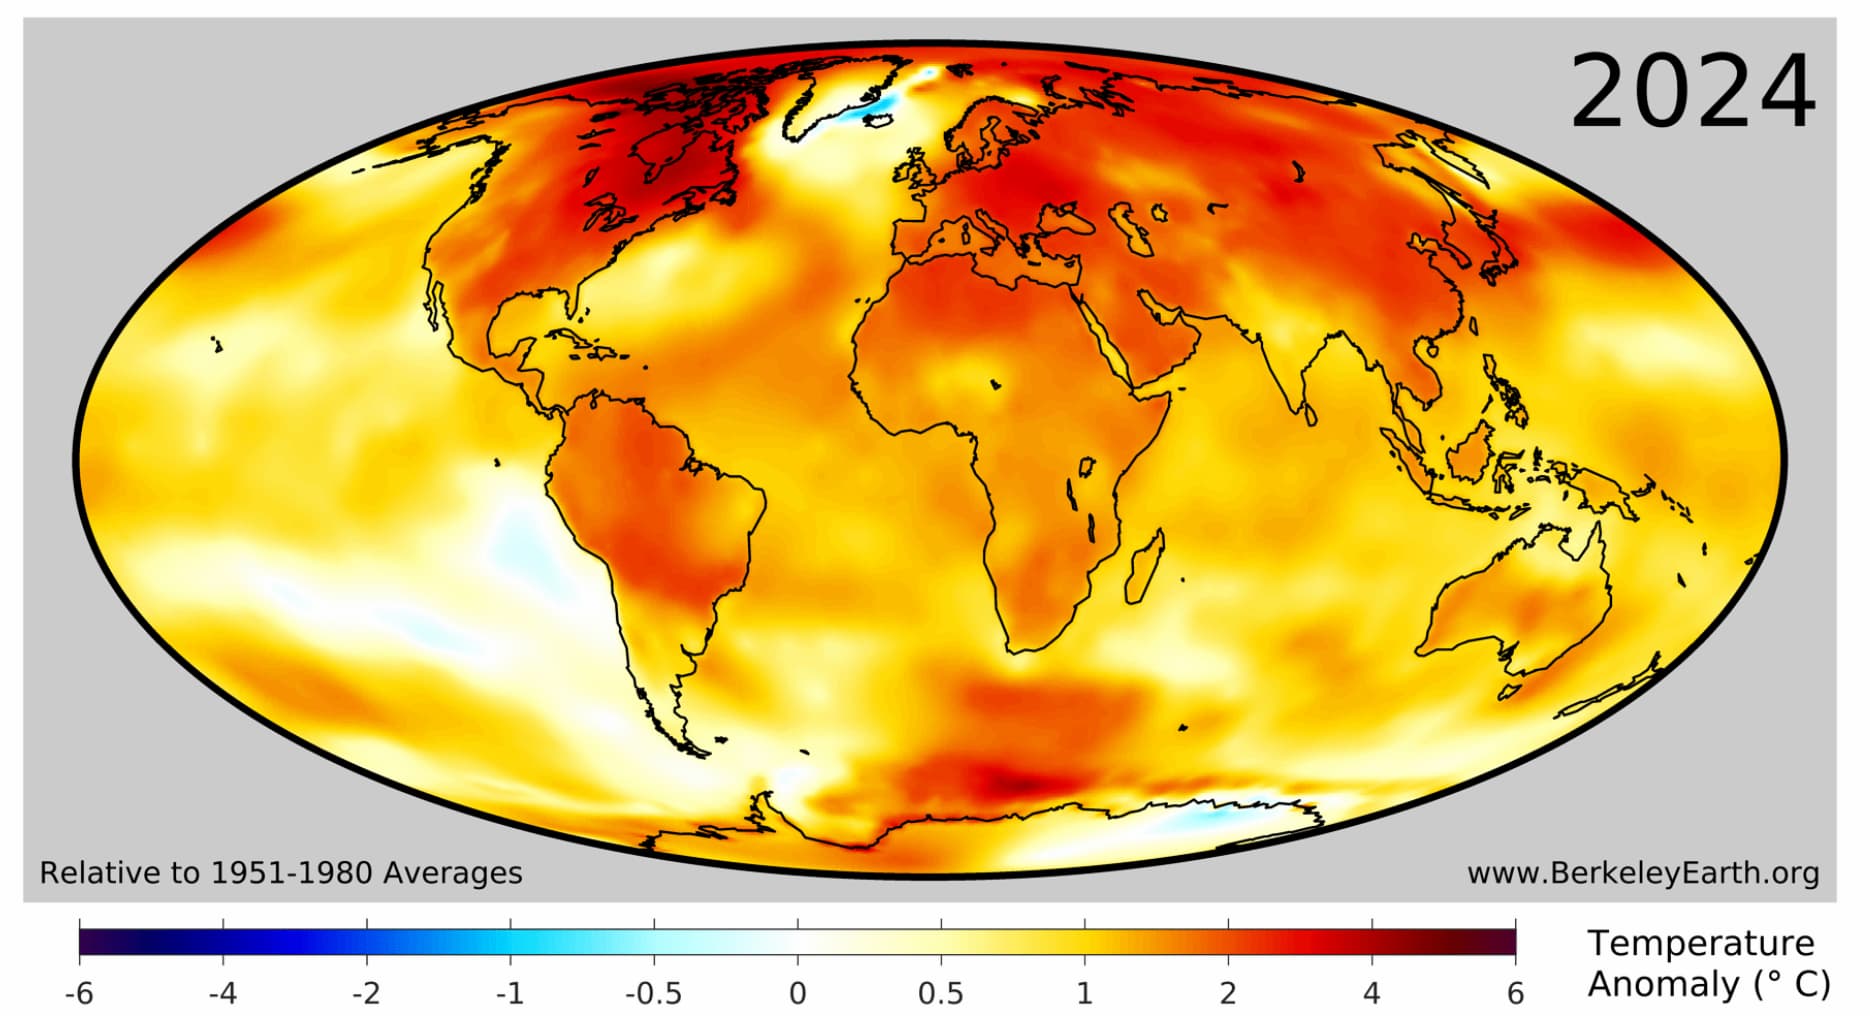
2024 global heat map, relative to 1951-1980 averages
Surface temperature anomalies for 2024 from Berkeley Earth. Note that Berkeley uses a 1951-80 baseline here to show anomalies.

Approximately 3.3 billion people – 40% of Earth’s population – live in places that experienced their warmest year on record in 2024. This was concentrated in Asia, South and Central America, Africa, and Eastern Europe. It also includes two-thirds of the population of China, as well as most of the population of Brazil, Nigeria, Ethiopia, Mexico and one-third of the population of the US.

The figure below highlights regions of the planet that experienced their top-five warmest (red shading) or coldest (blue) temperatures on record in 2024. Overall, around 24% of the planet set a new record, including 32% of the land and 21% of the ocean. No location on the planet experienced record cold temperatures (or even top-five record cold temperatures) for the year as a whole.
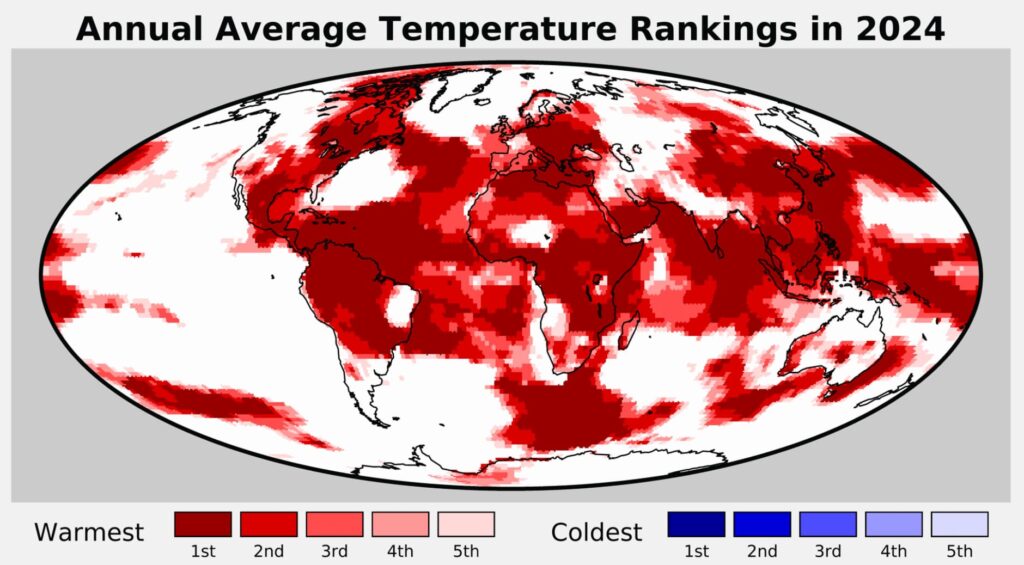
Annual average temperature rankings in 2024
Regions of the world among the five warmest (reds) of five coolest (blues) on record for average annual temperatures in 2024. Figure from Berkeley Earth.

In 2024, more than 100 countries saw their warmest year on record, as listed in the table below.

Africa Asia Europe North America Oceania South America
Algeria
Cameroon
Central African Republic
Chad
Comoros
Democratic Republic of the Congo
Djibouti
Equatorial Guinea
Eritrea
Ethiopia
Gabon
Ghana
Guinea
Guinea-Bissau
Ivory Coast
Kenya
Liberia
Libya
Malawi
Mozambique
Republic of the Congo
Sao Tome and Principe
Seychelles
Sierra Leone
Somalia
South Sudan
Togo
Tunisia
Uganda
Zambia
Zimbabwe
Brunei
Cambodia
China
Indonesia
Laos
Malaysia
Mongolia
North Korea
Oman
Palau
Philippines
Singapore
South Korea
Sri Lanka
Taiwan
Thailand
Vietnam
Yemen
Albania
Austria
Belarus
Bosnia and Herzegovina
Bulgaria
Croatia
Cyprus
Czechia
Germany
Greece
Hungary
Italy
Kosovo
Liechtenstein
Lithuania
Malta
Moldova
Montenegro
Netherlands
Poland
San Marino
Republic of Serbia
Romania
Slovakia
Slovenia
Ukraine
Antigua and Barbuda
Barbados
Belize
Canada
Dominica
El Salvador
Grenada
Guatemala
Haiti
Honduras
Jamaica
Mexico
Nicaragua
Saint Kitts and Nevis
Saint Lucia
Saint Vincent and the Grenadines
Trinidad and Tobago
Federated States of Micronesia
Fiji
Kiribati
Samoa
Solomon Islands
Brazil
Colombia
Guyana
Paraguay
Suriname
Venezuela

While the contiguous US saw record warmth, 2024 was the country’s second-warmest year on record once Alaska and Hawaii temperatures are included.

Furthermore, the continents of North America, South America, Asia, Africa and Europe each set new annual average records in 2024.

Untangling the drivers of spiking global temperatures

Global temperatures spiked in both 2023 and 2024 in a manner that scientists had not anticipated. Projections of 2023 temperatures were far below what actually occurred, and even 2024 projections ended up being on the lower end, despite incorporating 2023’s extremes.

The figure below shows estimates by four different groups that provided temperature predictions for the year prior to any data being collected – the UK Met Office, NASA’s Dr Gavin Schmidt, Berkeley Earth and Carbon Brief’s own estimate.
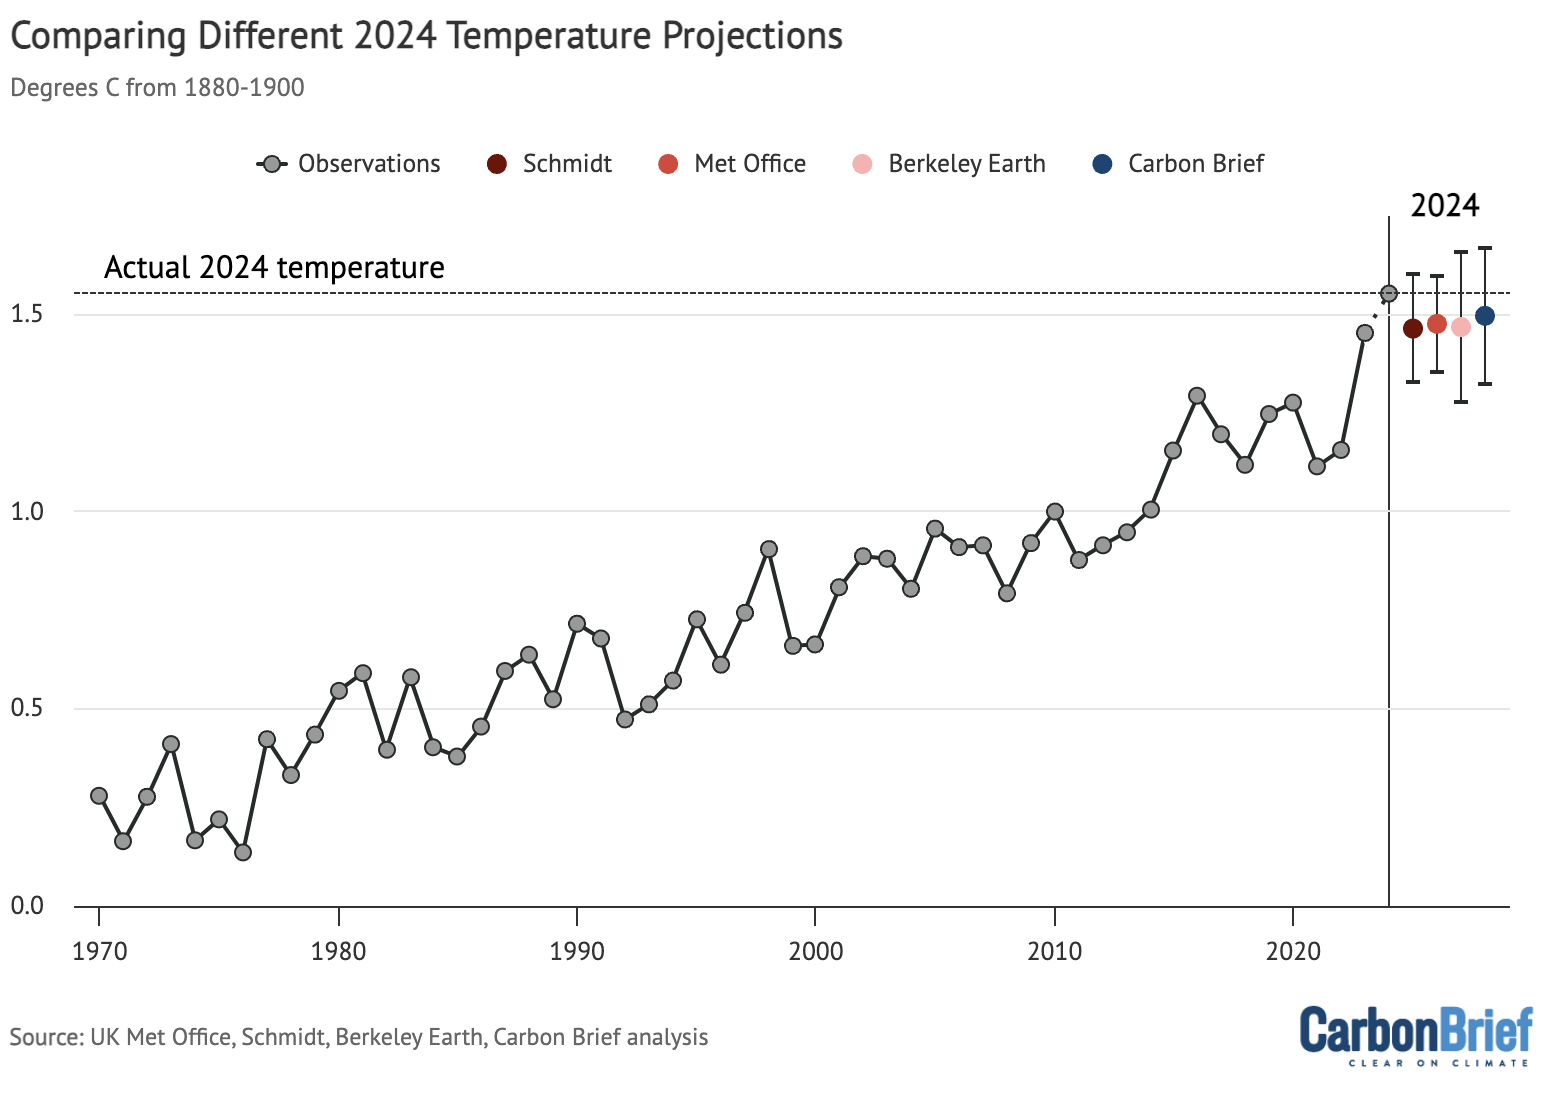
Comparing different 2024 temperature projections

Temperature predictions for 2024 from the UK Met Office, NASA’s Dr Gavin Schmidt, Berkeley Earth, and Carbon Brief relative to pre-industrial (1850-1900) temperatures and compared to the historical average of six different datasets produced by the WMO. Chart by Carbon Brief.

Unusually high global temperatures in 2023 and 2024 have sparked a slew of new studies by scientists attempting to explain the excessive heat. A range of possible causes has been proposed, including:

  • The possibility that El Niño behaved unusually as it followed a rare extended triple-dip La Niña event. A 2024 paper found that when El Niño followed an extended La Niña in climate model simulations, it produced a temperature spike commensurate to what was observed in 2023-24 around 10% of the time.
  • A decline in emissions of sulphur dioxide, reducing atmospheric aerosol concentrations and “unmasking” additional warming from past human greenhouse gas emissions. Multiple different papers have looked at the effects of a 2020 low-sulphur marine shipping fuel regulation, and ongoing research is looking at the effects of a sharp drop in sulphur emissions in China.
  • An unusual 2022 eruption of the Hunga-Tonga Hunga Ha’apai volcano that put around 150m tonnes of water vapour into the stratosphere, as well as some sulphur dioxide. Papers have been mixed on whether the water vapour warming or the sulphur dioxide cooling would be larger.
  • Other factors include an uptick in the 11-year solar cycle, and unusually low Saharan dust concentrations in early summer 2023.

One notable paper, published in the journal Science in early December 2024, found a substantial decline in reflective low-cloud cover in the northern mid-latitudes and tropics. They noted that this has the effect of increasing the amount of solar radiation that reaches the Earth’s surface and is re-radiated as heat.

The finding by itself does not reveal what caused a decline in cloud reflectivity, and the authors note that it could be a combination of natural variability, declining atmospheric aerosol concentrations associated with falling sulfur emissions, or – more worryingly – a sign of a strong positive cloud feedback associated with warming.

The figure below, created by Dr Robert Rohde at Berkeley Earth, synthesises the main drivers of temperature change over the past decade. It includes estimates of the warming contribution from human greenhouse gas emissions, El Niño and La Niña, changes in the solar cycle, the Hunga-Tonga eruption, and the 2020 low-sulphur marine fuel regulations. For the latter two elements, it includes a range of six published estimates of the eruption and five published estimates of the low sulphur fuel rules.
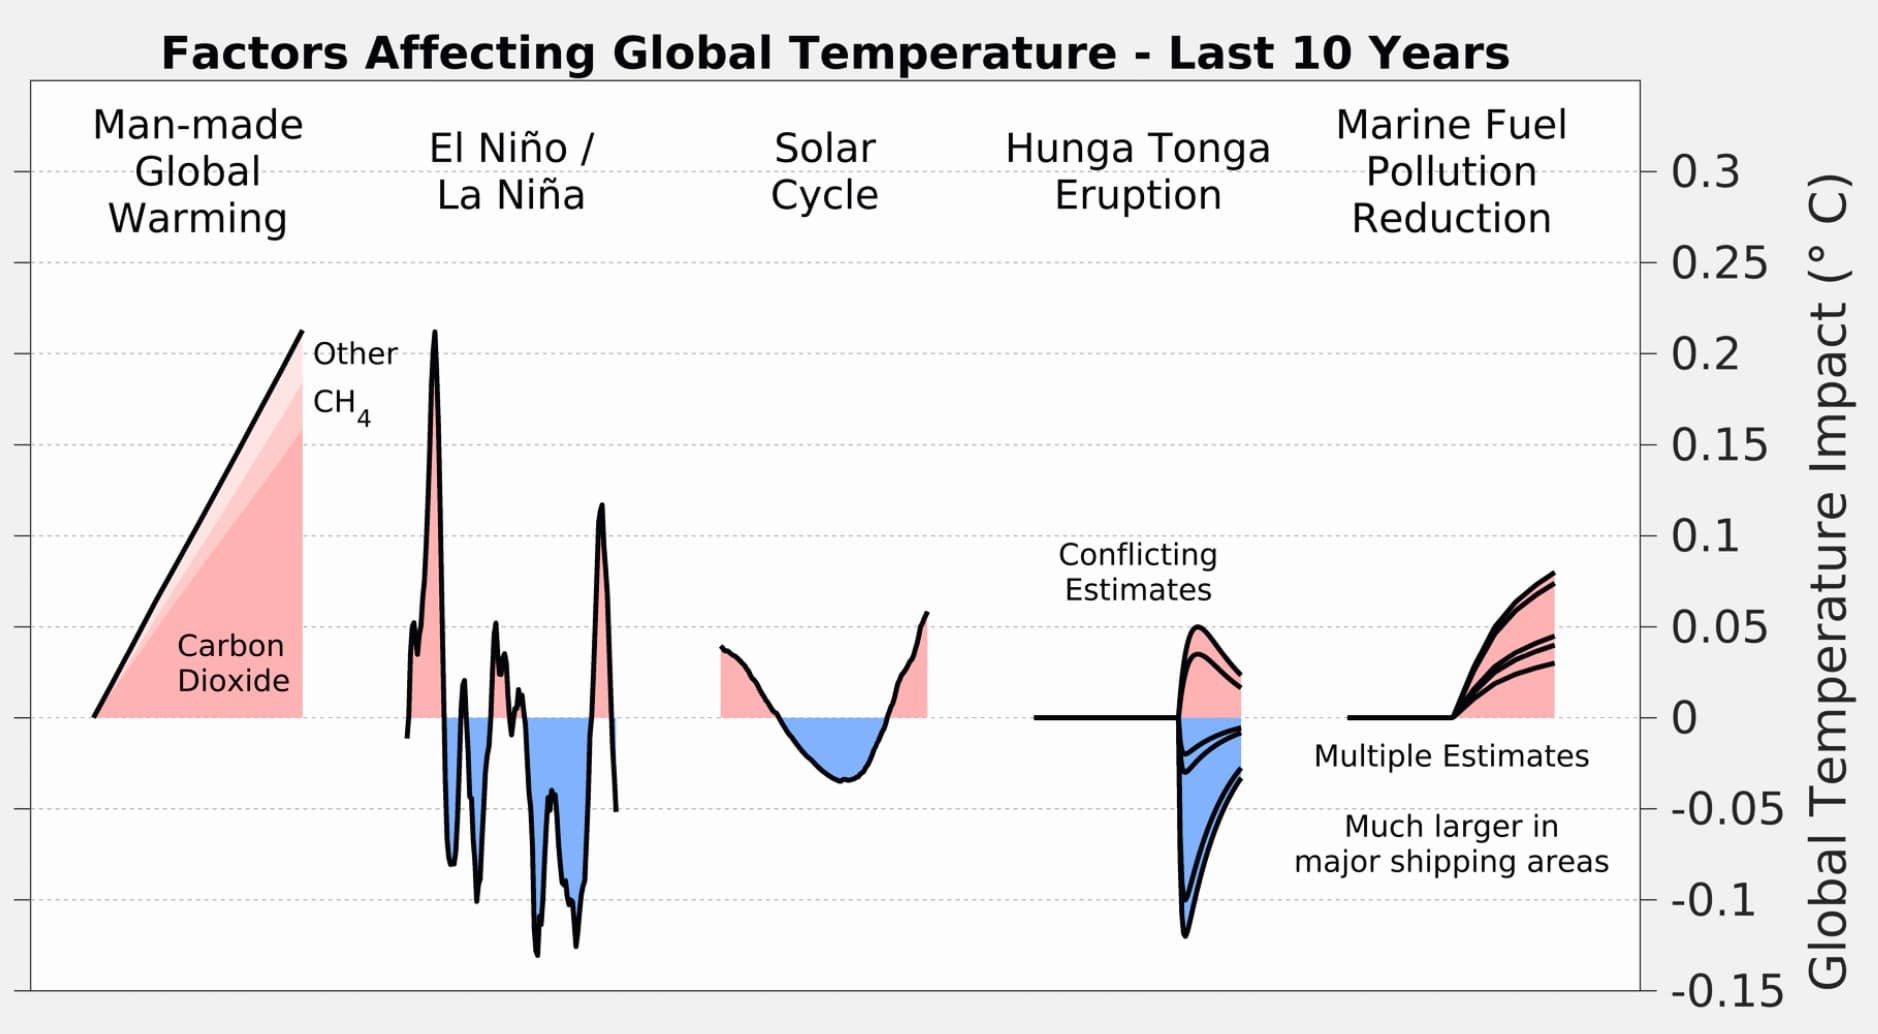
Factors affecting global temperature – last 10 years
Illustration of contributing factors driving global surface temperatures over the past decade. Each line for the Hunga Tonga eruption and marine fuel pollution reduction reflects a different published estimate. Figure from Berkeley Earth.

Over the longer-term, human emissions of CO2 and other greenhouse gases alongside planet-cooling aerosols are the main driver of global temperatures. Global temperatures have risen by more than 1.3C since pre-industrial times as a result of human activity.

However, on top of long-term warming, global temperatures vary year-to-year by up to 0.2C.

These variations are primarily driven by El Niño and La Niña events that redistribute heat between the atmosphere and oceans. However, other factors such as volcanic eruptions, the 11-year solar cycle and changes in short-lived climate forcers can influence year-to-year temperature changes.

The figure below shows the El Niño (red shading) and La Niña (blue) conditions over the past 40 years (collectively referred to as the El Niño-Southern Oscillation, or “ENSO”). While not unprecedented, the extended La Niña conditions since the latter half of 2020 have extended for an unusually long period of time.
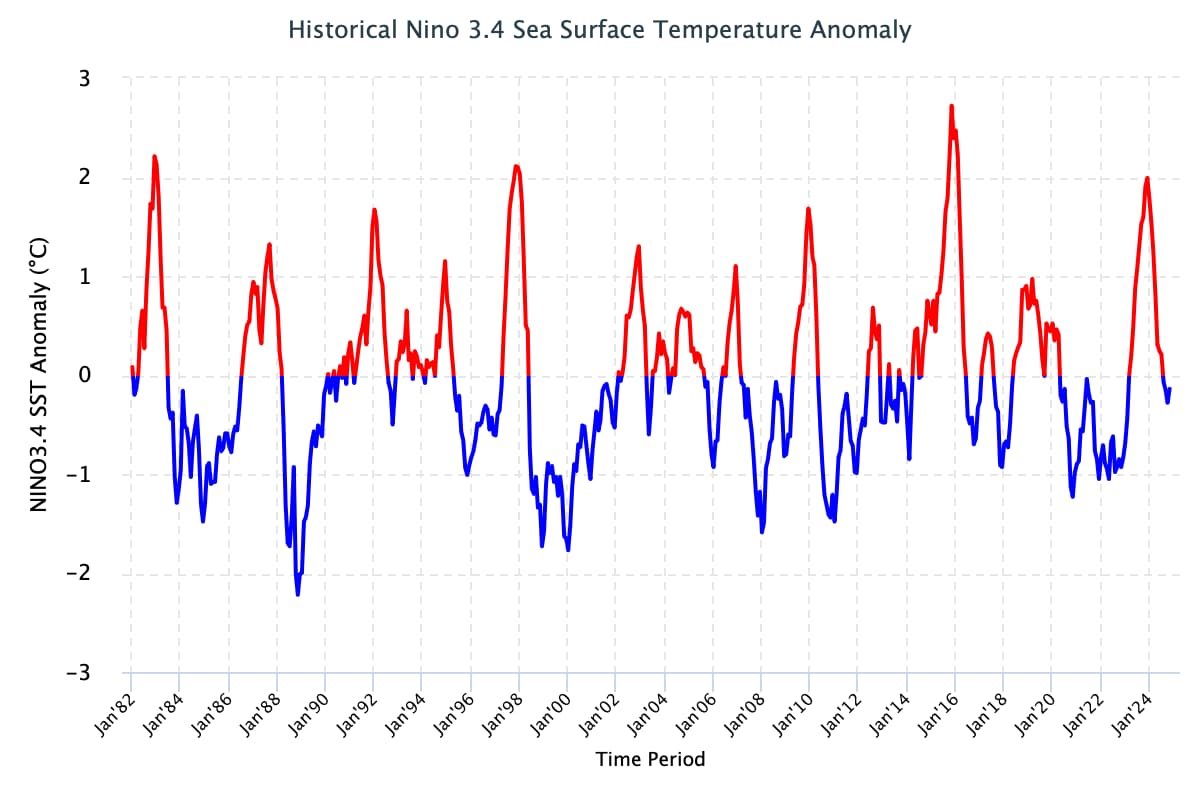
Historical Nino 3.4 sea surface temperature anomaly
Niño 3.4 sea surface temperature anomalies relative to the ocean average, for 1982-2024. Deviations below 0.5C and above 0.5C are generally used to determine La Niña and El Niño conditions, respectively. Figure from International Research Institute (IRI) at Columbia University.

Carbon Brief has used this historical relationship between ENSO conditions and temperature to effectively remove the effects of El Niño and La Niña events from global temperatures, as shown in the figure below.

This analysis indicates that El Niño boosted global temperatures in 2024 by around 0.16C compared to the estimate of global temperatures with both El Niño and La Niña events removed. This was a much larger effect than the 0.04C estimated for 2023, when El Niño emerged relatively late in the year and peaked in November.
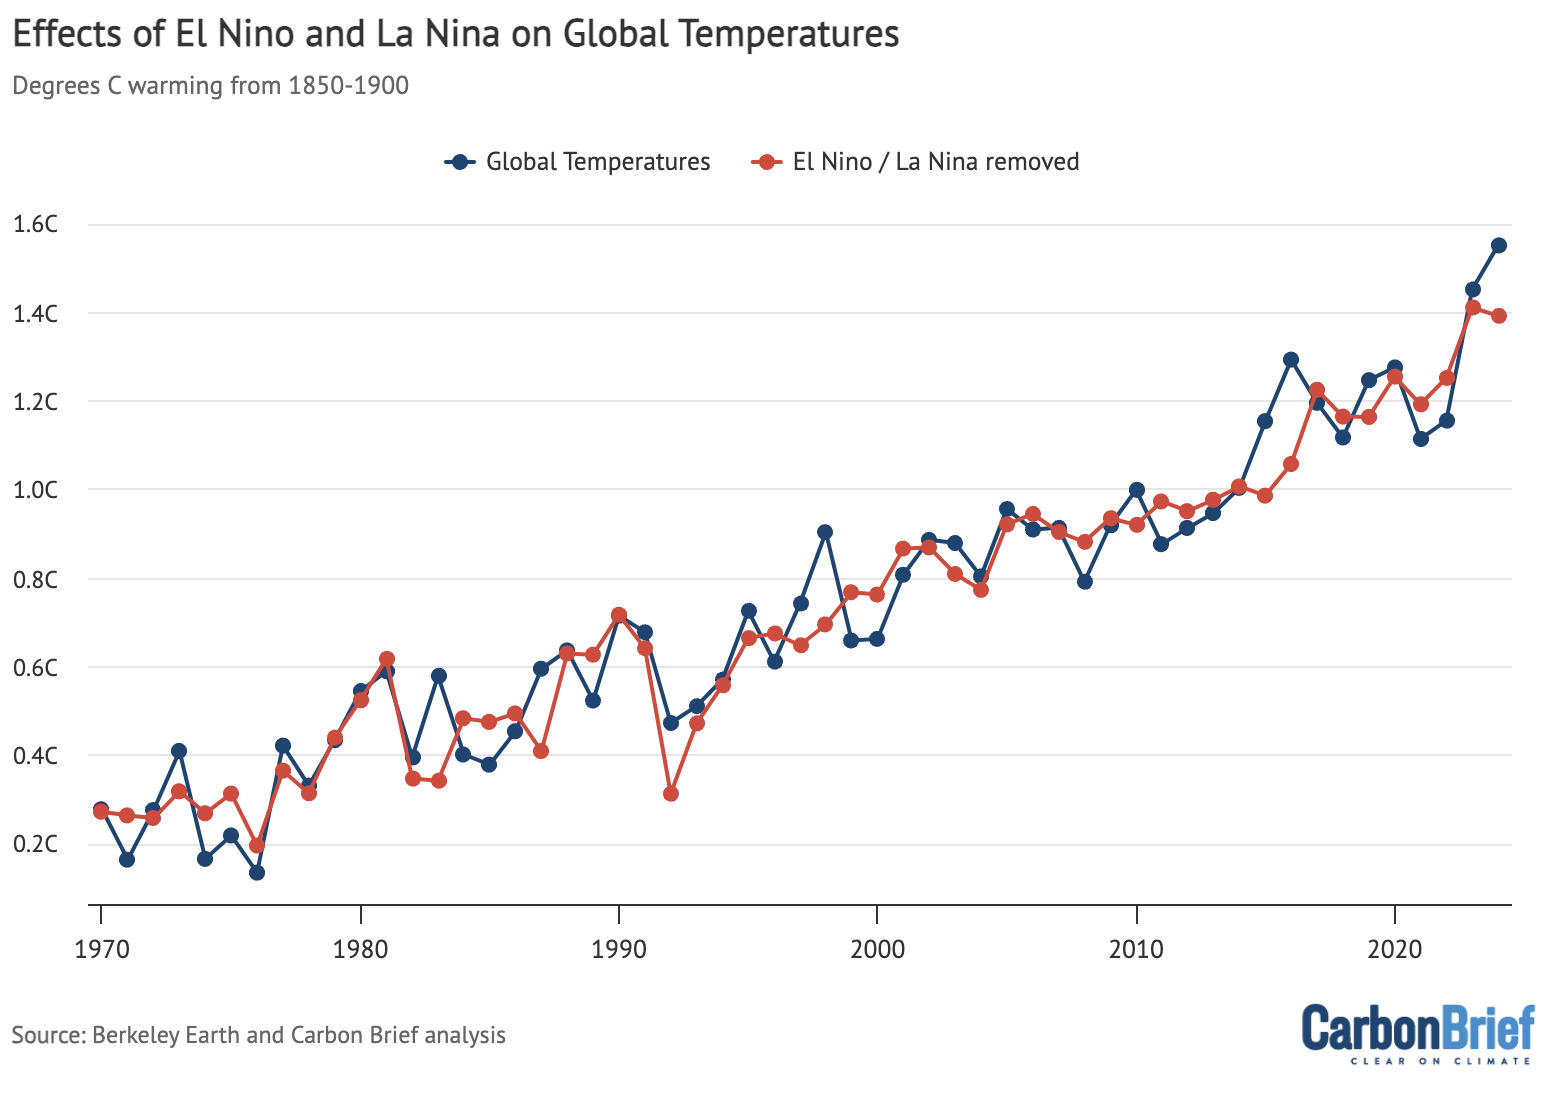
Effects of El Nino and La Nina on global temperatures

Annual global average surface temperatures from the WMO average of six different datasets , as well as Carbon Brief’s estimate of global temperatures with the effect of El Niño and La Niña (ENSO) events removed using the Foster and Rahmstorf (2011) approach. Chart by Carbon Brief.

However, this approach – which relies on a historical lag of around three months between peak ENSO conditions in the tropical Pacific and global surface temperature response – may not fully reflect El Niño effects on 2023. As discussed earlier, the fact that El Niño occurred on the heels of unusually-long La Niña conditions may have contributed to an earlier global temperature response than has been seen in other recent strong El Niño events.

Observations broadly in line with climate model projections

Climate models provide physics-based estimates of future warming given different assumptions about future emissions, greenhouse gas concentrations and other climate-influencing factors.

Here, Carbon Brief examines a collection of climate models – known as CMIP6 – used in the 2021 science report of the IPCC’s sixth assessment. In CMIP6, model estimates of temperatures prior to 2015 are a “hindcast” using known past climate influences, while temperatures projected from 2015 onward are a “forecast” based on an estimate of how things might change.

The figure below shows how observations compare to the full ensemble of 37 CMIP6 models (under the middle-of-the-road SSP2-4.5 emissions scenario for future projections). The blue line represents the average of all the models and the grey areas showing the 5th to 95th percentile range. Observational temperatures are plotted on top of the climate model data, with individual observational records represented by red lines of different shades.

The chart illustrates how observations have generally been below the model average over the past two decades and are slightly above model average in 2024.
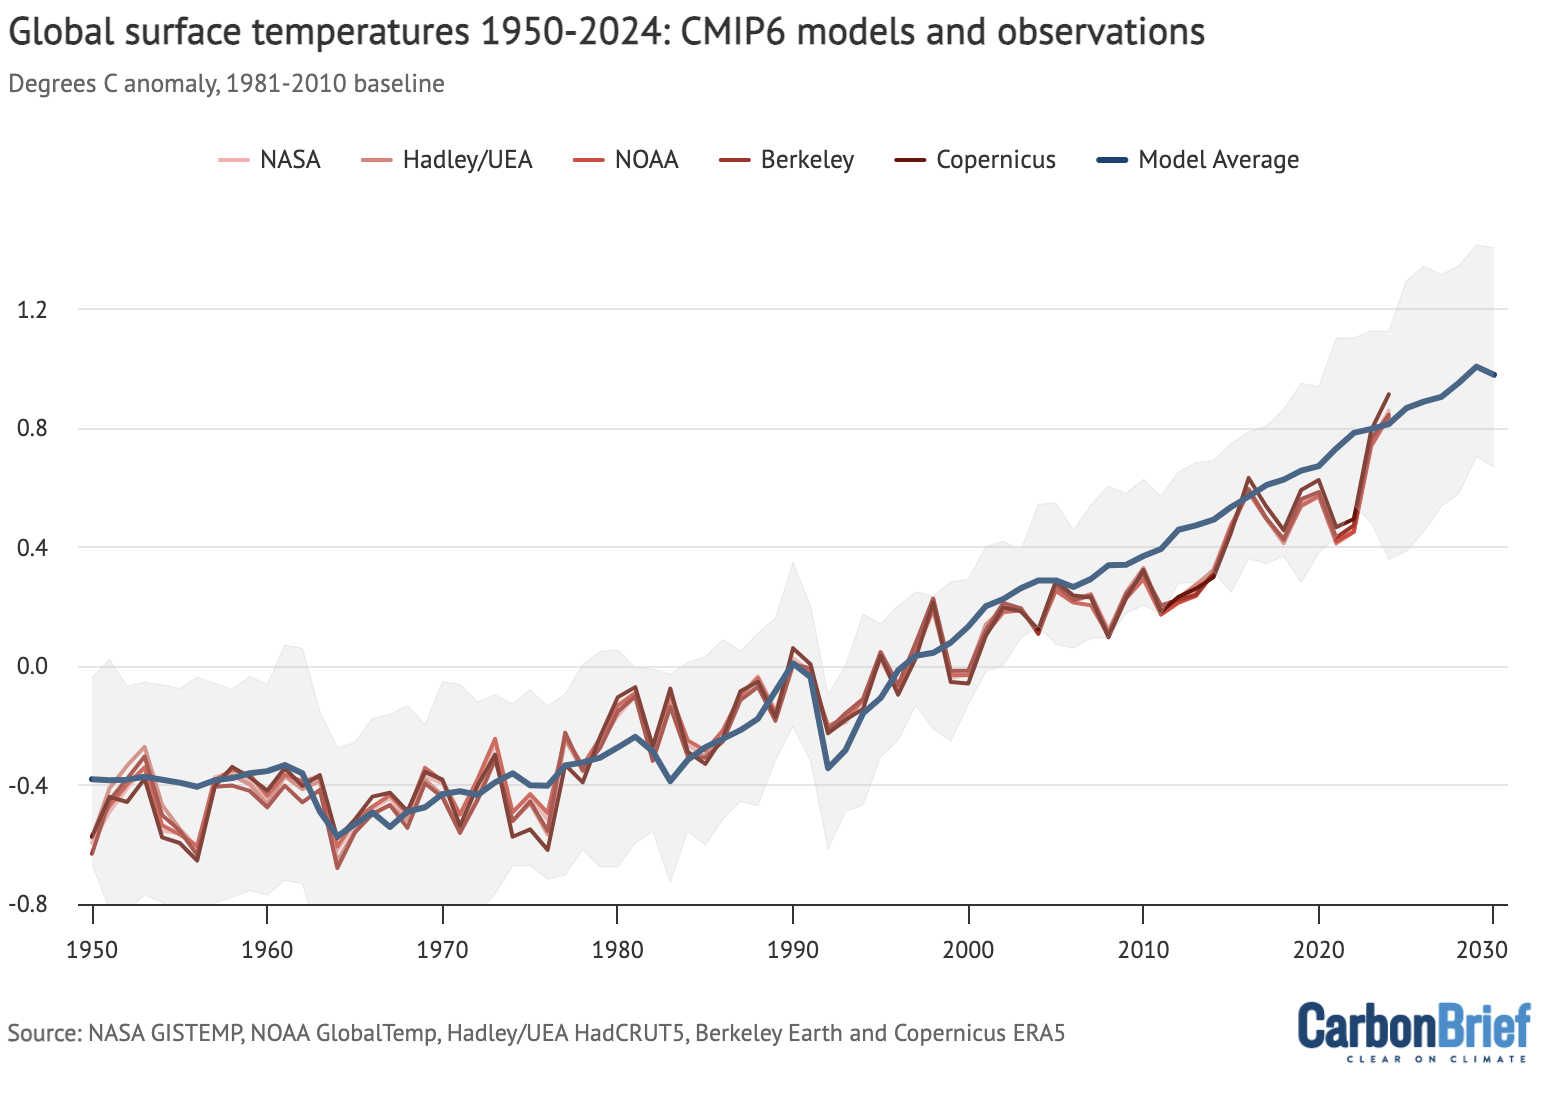
Global surface temperatures 1950-2024: CMIP6 models and observations

Annual global average surface temperatures from CMIP6 models and observations between 1950 and 2030 (through 2024 for observations). Models use the SSP2-4.5 scenario after 2015. Anomalies plotted with respect to a 1981-2010 baseline. Chart by Carbon Brief.

The CMIP6 ensemble is marginally more challenging for this comparison than past generations of CMIP because a subset of its models have unrealistically high climate sensitivity and they reproduce historical observations poorly. To account for this, rather than simply averaging all the models – as had been done in prior assessments – the IPCC employed an approach that effectively weights models by their performance. As a result, the models align better with the range of climate sensitivity derived from multiple different lines of evidence.

In the chart below, the blue line shows the average of 22 different models whose transient climate response (TCR) falls within the IPCC’s “likely” range (which results in temperature projections nearly identical to the IPCC-assessed warming). The grey area shows the 95% (two standard deviation) range of the TCR-screened model projections.
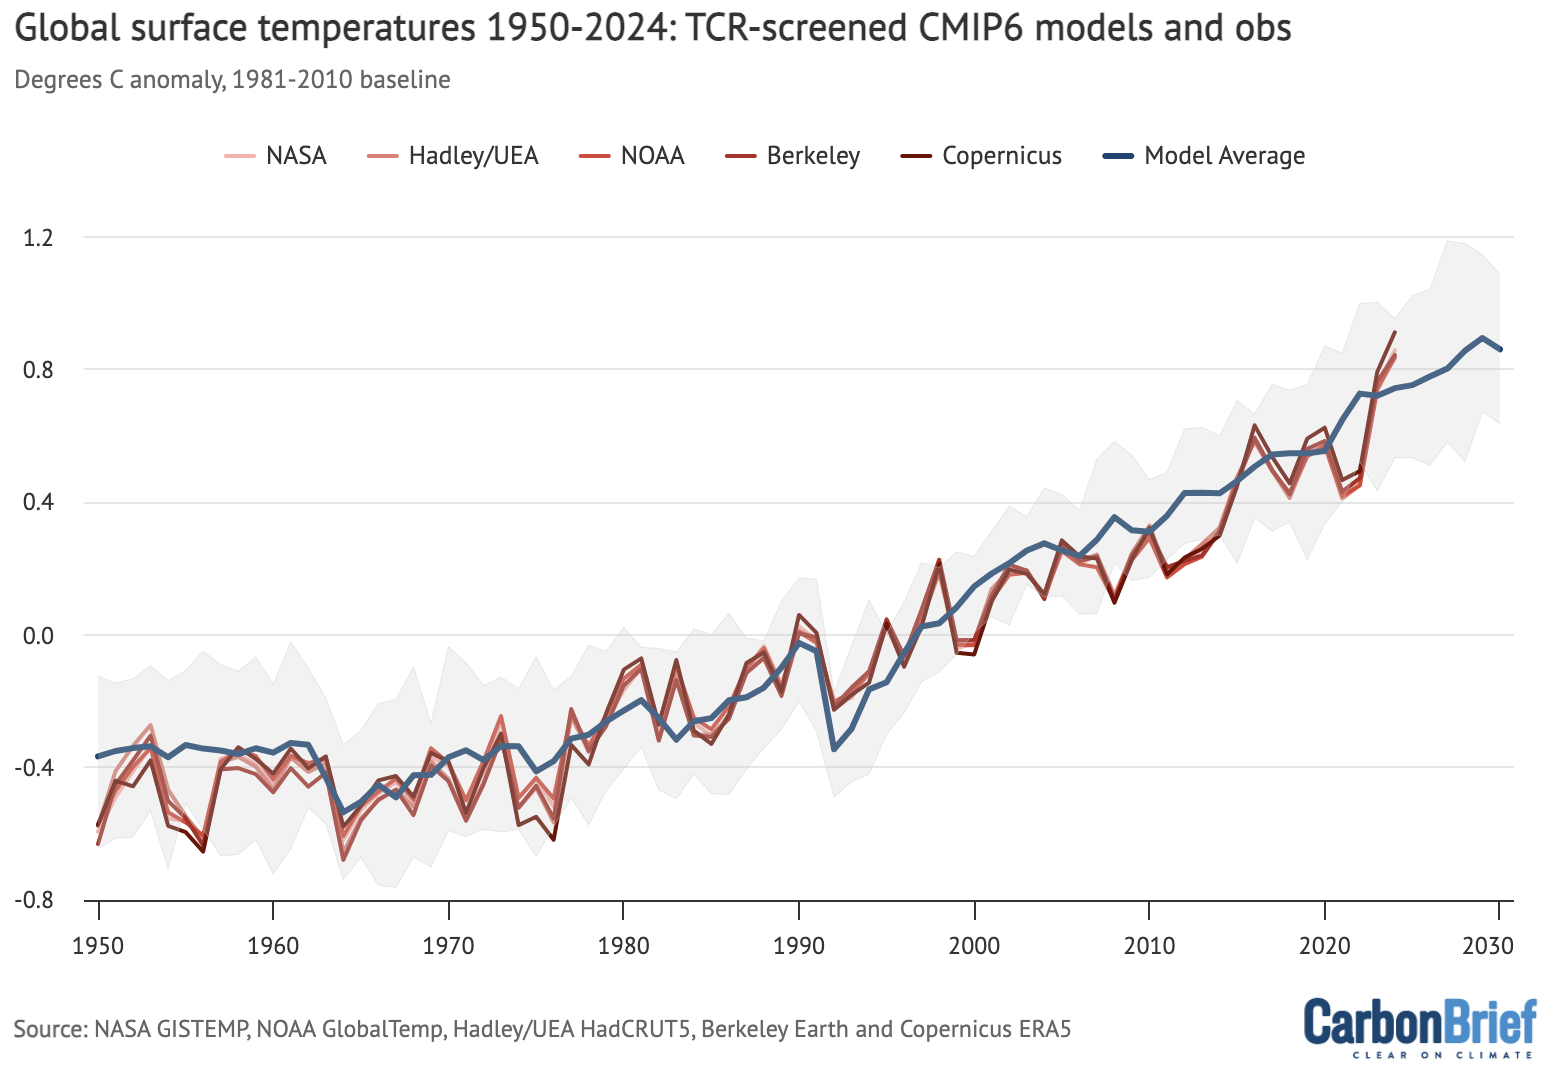
Global surface temperatures 1950-2024: TCR-screened CMIP6 models and observations

CMIP6 models compared to observations as in the prior chart, but models are screened to only include those models with a transient climate response (TCR) in-line with the IPCC’s “likely” range as discussed in Hausfather et al (2022). Anomalies plotted with respect to a 1981-2010 baseline. Chart by Carbon Brief.

The chart reveals that observed global surface temperatures (red lines) are further above the multimodal average, but remain well within the range of TCR-screened model runs.

This might be surprising given the focus on 2023 and 2024 being unusually warm. However, climate models broadly expect an acceleration of warming in the current period in a scenario like SSP2-4.5 where emissions of CO2 and other greenhouse gases continue to modestly increase, but emissions of planet-cooling aerosols like sulphur dioxide are rapidly reduced.

Record atmospheric temperatures

In addition to surface measurements over the world’s land and oceans, satellite microwave sounding units have been providing estimates of temperatures at various layers of the atmosphere since 1979.

The lowest layer of the atmosphere that satellite microwave units provide temperature estimates for is the lower troposphere. This data reflects temperatures a few kilometres above the Earth’s surface. It reveals a pattern of warming in the lowest troposphere that is similar – though not identical – to surface temperature changes.

The records produced by Remote Sensing Systems (RSS), the University of Alabama, Huntsville (UAH) and NOAA show 2024 as the warmest year on record in the lower troposphere. The chart below shows the three records for the lower troposphere.
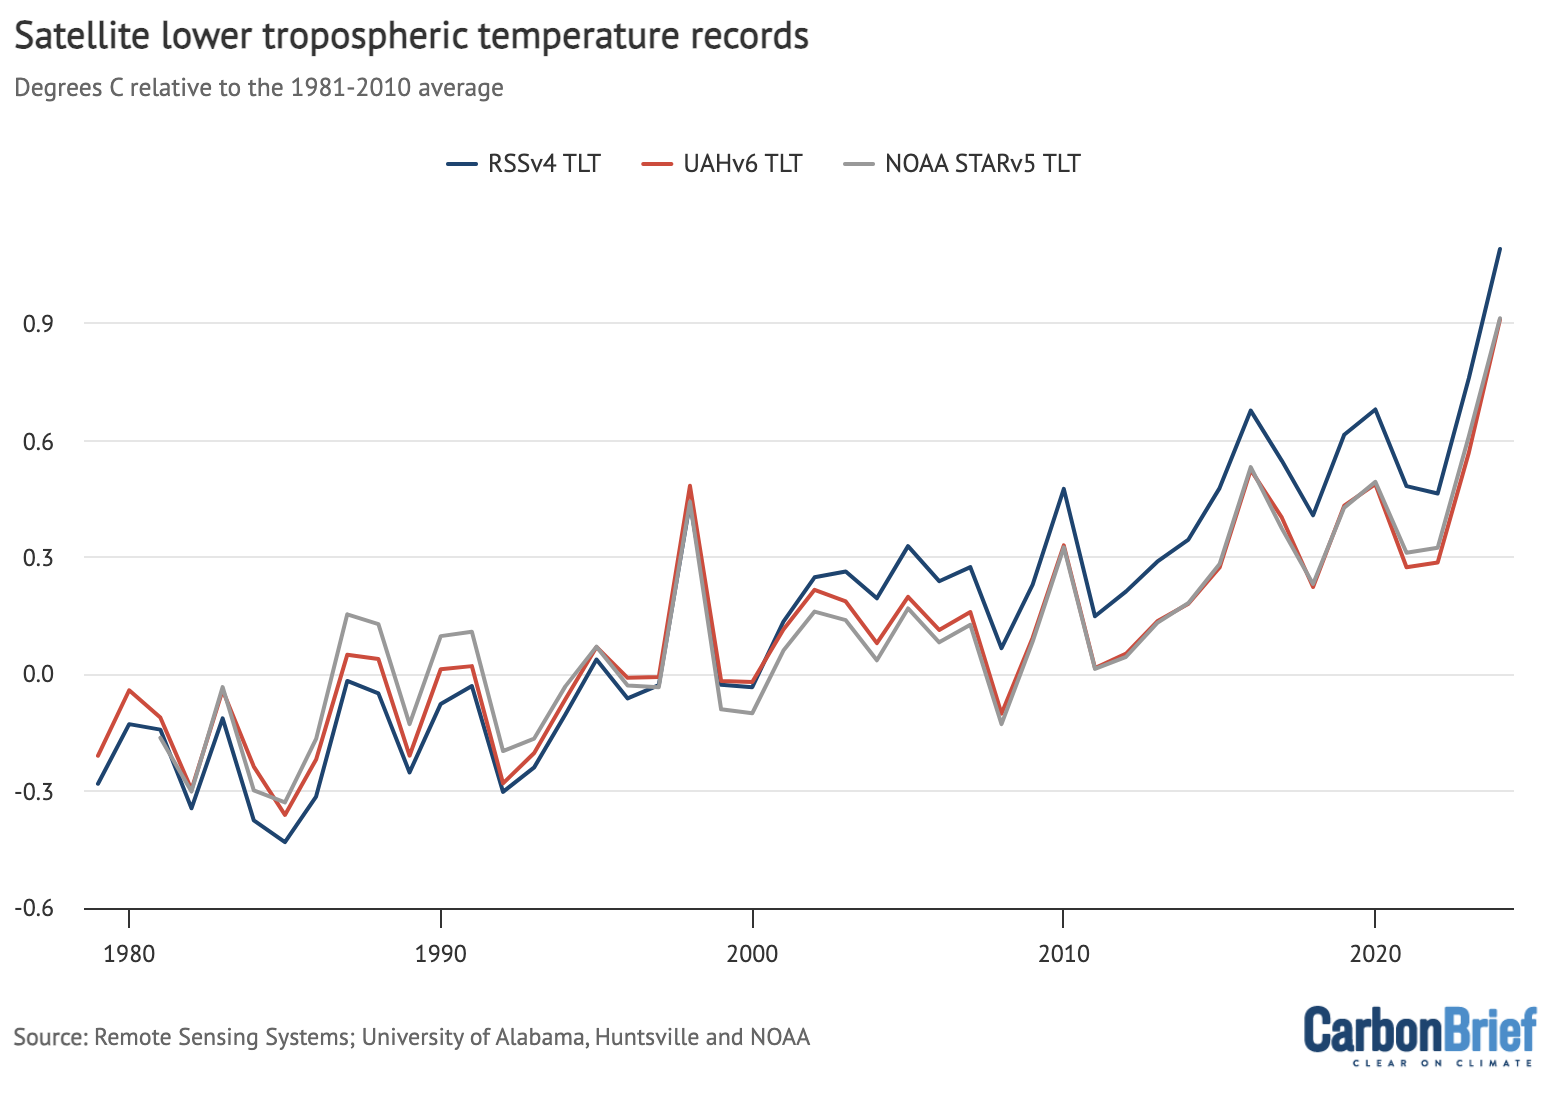
Satellite lower tropospheric temperature records

Global average lower-troposphere temperatures from RSS version 4 (blue), UAH version 6 (red) and NOAA STAR version 5 (grey) for the period from 1979-2024, relative to a 1981-2010 baseline. Chart by Carbon Brief.

The lower troposphere tends to be influenced more strongly by El Niño and La Niña events than the surface. Therefore, satellite records show correspondingly larger warming or cooling spikes during these events. This explains why the year-on-year increase in lower-troposphere temperature – of around 0.3C – seen in 2024 is larger than the ~0.1C increase in surface records.

The lower-tropospheric temperature records show large differences after the early 2000s. RSS shows an overall rate of warming quite similar to surface temperature records, while UAH and NOAA show considerably slower warming in recent years than has been observed on the surface.

Greenhouse gas concentrations reach new highs

Greenhouse gas concentrations reached a new high in 2024, driven by human emissions from fossil fuels, land use and agriculture.

Three greenhouse gases – CO2, methane (CH4) and nitrous oxide (N2O) – are responsible for the bulk of additional heat trapped by human activities. CO2 is by far the largest factor, accounting for roughly 42% of the increase in global surface temperatures since the pre-industrial era (1850-1900).

Methane accounts for 28%, while nitrous oxide accounts for around 5%. The remaining 25% comes from other factors including carbon monoxide, black carbon and halocarbons, such as CFCs.

Human emissions of greenhouse gases have increased atmospheric concentrations of CO2, methane and nitrous oxide to their highest levels in at least a few million years – if not longer.

The figure below shows concentrations of these greenhouse gases – in parts per million (ppm) for CO2 and parts per billion (ppb) for methane and nitrous oxide – from the early 1980s through to October 2024 for CO2 and September 2024 for CH4 and N2O (the most recent data currently available).

Global greenhouse gas concentrations

Global concentrations of CO2, methane (CH4) and nitrous oxide (N2O). Based on data from NOAA’s Earth Systems Research Laboratory. Note that the y-axes do not start at zero. Chart by Carbon Brief.

Sea level rise is speeding up

Modern-day sea levels have risen to a new high, due to a combination of melting land ice (such as glaciers and ice sheets), the thermal expansion of water as it warms and changes in land water storage.

In recent years, there have been larger contributions to sea level rise from melting ice sheets and glaciers, as warmer temperatures accelerate ice sheet losses in Greenland and Antarctica.

Since the early 1990s, the increase in global sea level has been estimated using altimeter data from satellites. Earlier global sea levels have been reconstructed from a network of global tide gauge measurements. This allows researchers to estimate how sea level has changed since the late 1800s.

The chart below shows five different modern sea level rise datasets (blue lines), along with satellite altimeter measurements as assessed by NASA (in black) after 1993. (As sea level rise data has not yet been released for the whole year, the 2024 value is estimated based on data through to October.)

Global mean sea level rise between 1880 and 2024

Global average sea level rise reconstructed from tide gauge data between 1880 and 2024 from Frederikse et al 2020, Dangendorf et al 2019, Hay et al 2015, Church and White 2011, and Palmer et al 2021. Satellite altimeter data from 1993 (black) to present is taken from NASA. Chart by Carbon Brief.

Sea levels have risen by over 0.2 metres (200mm) since 1900. While sea level rise estimates mostly agree in recent decades, larger divergences are evident before 1980. There is also evidence of accelerating sea level rise over the post-1993 period when high-quality satellite altimetry data is available. (See Carbon Brief’s explainer on how climate change is accelerating sea level rise.)

Shrinking glaciers and ice sheets

A significant portion of global sea level rise is being driven by melting glaciers on land. Scientists measure the mass of glaciers around the world using a variety of remote-sensing techniques, as well as through GRACE measurements of the Earth’s gravitational field. The balance between snow falling on a glacier and ice loss through melting and the breaking off – or “calving” – of icebergs determines if glaciers grow or shrink over time.
The World Glacier Monitoring Service is an international consortium that tracks more than 130 different glaciers in 19 different regions around the world. The figure below shows the change in global average glacier mass from 1950 through to the end of 2023. (2024 values are not yet available.) Note that glacier melt is reported in metres of water equivalent, which is a measure of how much mass has been lost on average.

Global glacier melt, 1950-2023

Global average glacier melt over the 1950-2023 period from the World Glacier Monitoring Service, in metres of water equivalent. Carbon Brief.

Greenland ice sheets have become a larger contributor to sea level rise in recent years due to accelerating loss of mass. The year 2024 was the 28th in a row where Greenland lost ice overall, with 80bn tonnes of ice lost over the 12 months from September 2023 to August 2024. Greenland last saw an annual net gain of ice in 1996.

The figure below shows the cumulative mass balance change – that is, the net ice loss – from Greenland between 1970 and October 2024. The authors find that Greenland has lost around 6tn tonnes of ice over the past 50 years – more than 700 tonnes lost per person for every person on the planet.

Greenland ice sheet mass balance, 1970-2024

Cumulative ice loss from Greenland in billion metric tonnes (gigatonnes) between 1970 and 2024 from Mankoff et al 2021, updated through December 2024. Chart by Carbon Brief.

Near-record low Antarctic sea ice extent

Arctic sea ice was at the low end of the historical (1979-2010) range for most of 2024, but did not set any new all-time low records apart from a few individual days at the end of the year.

The summer minimum extent – the lowest recorded level for the year – was the seventh-lowest since records began in the late 1970s.

Antarctic sea ice, on the other hand, was the second lowest on record – after 2023 – for much of the year. Taken together, 2023 and 2024 Antarctic sea ice extent was “way outside anything we have witnessed in our satellite record for their winter months”, an expert told Carbon Brief in October last year.

While long-term trends in Antarctic sea ice have been ambiguous in the past (unlike in the Arctic where there is a consistent long-term decline), there is increasing evidence that human-driven warming is starting to drive significant loss of sea ice in the region.

The figure below shows both Arctic (red line) and Antarctic (blue line) sea ice extent for each day of the year, along with how it compares to the historical range (corresponding shading).

Arctic and Antarctic sea ice in 2024

Arctic and Antarctic daily sea ice extent from the US National Snow and Ice Data Center. The bold lines show daily 2024 values, the shaded area indicates the two standard deviation range in historical values between 1979 and 2010. The dotted black lines show the record lows for each pole. Chart by Carbon Brief.

Looking ahead to 2025

There is reason for caution when estimating likely temperatures for 2025. In 2023, temperatures were significantly higher than predictions made at the start of the year, while 2024 temperatures were towards the high end of annual predictions.

At the same time, there is strong reason to expect that 2025 will be cooler than 2024. As noted earlier, 2024 temperatures were boosted by more than 0.1C by a strong El Niño event that has largely faded by the start of 2025. While global land temperatures remain quite elevated, sea surface temperatures have begun to fall in recent months, and weak La Niña conditions are starting to develop in the tropical Pacific.

It seems unlikely that a strong La Niña will develop in 2025, and it is quite possible that the world remains in ENSO neutral conditions with no formal La Niña being declared for the first half of the year. There is even a small chance that the world will re-enter El Niño conditions by the latter part of 2025 – though most models forecast neutral conditions to persist, as shown in the figure below.

Model predictions of ENSO from Dec 2024
El Niño Southern Oscillation (ENSO) forecast models for overlapping three-month periods in the Niño3.4 region (September, October, November – SON – and so on) for the end of 2024 and then into the spring and summer of 2025. Credit: CPC/IRI ENSO forecast.

There have been four published predictions – from the UK Met Office, NASA’s Dr Gavin Schmidt, Berkeley Earth and Carbon Brief (in this article) – of what temperatures might look like in 2025.

The figure below shows the four different 2025 predictions compared to the average of six different temperature records (NASA, NOAA, Hadley, Berkeley, Copernicus and the Japanese JRA-3Q reanalysis) used by the World Meteorological Organization (WMO). These have been “normalised” to show 2025 warming relative to 2024 in the WMO dataset. This is to remove any differences in predictions due to divergences in the baselines used by different temperature records.

Carbon Brief’s prediction of likely 2025 temperatures is based on a statistical model using the average temperature of the past year, the latest monthly temperature and projections of ENSO conditions over the first three months of 2025.

Comparing different 2025 temperature projections

Temperature projections for 2025 from the UK Met Office, NASA’s Dr Gavin Schmidt, Berkeley Earth and Carbon Brief, relative to pre-industrial (1850-1900) temperatures and compared to the historical average of six different datasets produced by the WMO. Chart by Carbon Brief.

The Met Office, Dr Schmidt, Berkeley Earth and Carbon Brief estimates all have 2025 most likely ending up as the third-warmest year on record, after 2024 and 2023. However, it is still possible that it could be as high as the second-warmest year or as low as the sixth-warmest year, depending on how global temperatures evolve in the coming months.

Against a 1880-99 pre-industrial baseline, the central estimate of all four forecasts for 2025 is around 1.4C warming, with the world relatively unlikely to top 1.5C again next year.

Ultimately, what matters for the climate is not the leaderboard of individual years. Rather, it is the long-term upward trend in global temperatures driven by human emissions of greenhouse gases. Until the world reduces emissions down to net-zero, the planet will continue to warm.

If global emissions remain on the current trajectory, the world will likely firmly pass 1.5C in the late 2020s or early 2030s, as shown in the figure below.

The world will likely firmly exceed 1.5C in the coming years without rapid emissions reductions

Annual global average surface temperatures from the composite average (black dots) along the 30-year LOWESS fit (red line), combined the AR6 assessed warming projection for SSP2-4.5 as published and without any baseline alignment. Chart by Carbon Brief.

The post State of the climate: 2024 sets a new record as the first year above 1.5C appeared first on Carbon Brief.

https://www.carbonbrief.org/state-of-the-climate-2024-sets-a-new-record-as-the-first-year-above-1-5c/

Continue Reading

Climate Change

Q&A: What does China’s 15th ‘five-year plan’ for renewables mean for climate change?

Published

on

China has released its “15th five-year plan for the development of renewable energy”, outlining key targets and policies for the sector in 2026-2030.

A key focus of the plan is boosting renewable generation and consumption as a share of China’s overall energy mix.

It calls for continued capacity additions of wind and solar – albeit at lower levels than previous years – as well as hydropower, biomass and other clean-energy sources.

Specifically, China will aim to install 3,500 gigawatts (GW) of renewables capacity by 2030, 2,800GW will be wind and solar.

The country had previously pledged to install 1,200GW of wind and solar by 2030, a goal that China met six years early.

Another major theme is the provision of wind and solar supply that is “dependable” and “grid-friendly”.

Setting a target for “dependable output” from wind and solar could help to entrench their role as a provider of “energy security”, according to analysts.

The government also aims to boost renewables consumption by developing non-power uses of renewable energy, in sectors such as steel and chemicals.

Below, Carbon Brief examines the key targets and policies outlined in the five-year plan and what they mean for China’s energy transition.

Article Contents

Why are China’s five-year plans important?

Five-year plans are key to China’s political system. An overarching plan, covering all socioeconomic issues of importance to policy leaders, is published at the beginning of each five-year cycle.

The plan for the 15th five-year period (2026-2030) was published in March 2026.

It includes what the government considers to be the most important targets and policy signals for climate and energy. For example, binding targets for carbon intensity, the share of non-fossil energy in total energy consumption and total energy production capacity.

Following this overarching document, five-year plans focused on specific sectors or themes are then published over the course of the five-year plan period.

This year, the government has already published several five-year plans related to energy and climate change. One covers the development of the “new-type” energy sector more broadly. Another wraps climate goals together with other environmental targets under the “Beautiful China” programme.

By contrast, the renewables five-year plan focuses specifically on the development of hydropower, wind, solar, biomass, geothermal and wave energy.

It was published in late July by the National Development and Reform Commission (NDRC), the country’s top economic planning agency, and the National Energy Administration (NEA).

It covers topics including capacity and generation targets, as well as efforts to increase integration and reliability of wind and solar. It also has policies to encourage “non-power use” of renewable energy and ways to strengthen innovation of clean-energy technologies.

What overarching renewables targets are in the plan?

China will aim to install 3,500 gigawatts (GW) of renewables capacity by 2030, according to the five-year plan.

Of this, 2,800GW will be wind and solar – a pledge reiterated from China’s action plan for peaking carbon emissions, which was released earlier this month.

The goal more than doubles a previous 2030 target for wind and solar to reach 1,200GW, which China met six years early.

As of June 2026, the country has installed just under 2,000GW of wind and solar capacity, as well as 454GW of hydropower. Biomass, geothermal and wave energy hold very small shares of the overall energy mix.

As such, China would need to build 160GW of wind and solar each year – and just under 220GW of renewable capacity in total – to meet the targets.

The country installed 277GW of new solar alone in 2024 – and 315GW in 2025.

Bar chart titled “China aims for 3,500GW of renewables by 2030”, with the subtitle “China’s total installed capacity of renewable energy from 2016-2025, and its target for 2030, gigawatts”. The chart illustrates the growth of China’s solar, wind and hydro from 2016 to 2025, as well as targets for solar and wind, as well as overall renewables capacity, for 2030. Installed capacity rose from approximately 500GW in 2016 to over 2,200GW in 2025. Solar energy shows the fastest growth, particularly between 2022 and 2025, where it becomes the largest single contributor at over 1,200GW. Wind capacity increases steadily to around 600GW, and hydro capacity reaches over 400GW by 2025. As shown in the right-most bar, or 2030, China targets 3,500GW of total renewables capacity, composed of at least 2,800GW from solar and wind and 700GW from hydropower and other renewables, such as wave energy and biomass. Source: National Energy Administration, 15th five-year plan for the development of renewable energy. This text was produced with support from AI.
China’s total installed capacity of renewable energy from 2016-2025, and its target for 2030. Source: National Energy Administration, Carbon Brief.

A key part of meeting the targets will be the development of large-scale clean-energy bases in China’s northern regions. These will generate power to be exported elsewhere via ultra-high voltage lines. The plan also encourages greater “local consumption” and installations of distributed energy (see below).

The plan says that further research will be directed at increasing the renewable share of electricity generated by these large-scale energy bases to 100%.

A recent report by the thinktank Global Energy Monitor (GEM) finds that output from these bases “continues to be paired with coal-fired generation in the name of balancing and system flexibility”. It says that currently, coal generates 42% of the power transmitted to the rest of the country from these bases.

China will also add more hydropower, says the plan, with capacity rising from 448GW in 2025 to 570GW in 2030. Some 160GW of this will be pumped-storage hydropower.

Meanwhile, the plan sets a target for renewable power generation to reach 6,000 terawatt-hours (TWh), 4,000TWh of which would come from wind and solar.

This would be a 50% increase in five years as renewables generated just under 4,000TWh of electricity in 2025, according to the National Energy Administration.

By 2030, the plan says that total consumption of renewable energy will stand at 1.8bn tonnes of coal equivalent (Gtce).

This would be up from 1.2Gtce in 2025, which represented about one-fifth of China’s total energy consumption of 6.2Gtce that year.

The renewable targets in the plan are lower than those suggested in a recent study by high-profile Chinese scholars.

The study, from the department of energy and power engineering and the Institute of Climate Change and Sustainable Development at Tsinghua University in Beijing, assessed the “likelihood of China attaining its carbon peak” under different pathways.

It found that, in order to meet its climate commitments, China would need to either install more than 4,000GW of “non-fossil energy capacity” before 2030, or to “maintain a total energy consumption” below 6.5Gtce.

The table below outlines some of the key renewables targets for 2030, as specified in the plan.

Key targets for 2030, adapted from 15th five-year plan for renewable energy
Type 2025 2030 Percentage change
Renewable energy use 1.2Gtce 1.8Gtce 53%
Total renewables capacity 2,340GW 3,500GW 50%
Wind and solar capacity 1,840GW More than 2,800GW 52%
Of which: Solar thermal 1.8GW 15GW 733%
Hydro capacity 450GW 570GW 27%
Of which: Pumped storage hydropower 66GW 160GW 142%
Wave energy 0.4GW
Renewable generation 4,000TWh 6,000TWh 50%
Of which: Wind and solar 2,300TWh 4,000TWh 74%
Non-electricity use 60Mtce 150Mtce 150%
Renewable hydrogen 0.25Mt 2Mt 700%

Why does the plan focus on ‘firm capacity’ for renewables?

As well as increasing the overall size of China’s renewable power supply, the country must also maintain an “uninterrupted and reliable power supply”, officials from the NDRC and NEA told state news agency Xinhua in coverage of the new plan.

To support this goal, the plan says that the development of renewables will “enter a new stage”. This will mean that “improving quality and serving as a reliable alternative” to fossil fuels will be as important as “expanding scale”.

The plan, therefore, proposes targets for the “firm capacity” from wind and solar (置信出力). This is the amount plants or grids can be relied on to produce during critical supply periods, in conjunction with on-site storage.

The target for wind is a firm capacity of at least 11% of total installed capacity by 2030, while the equivalent goal for solar is 6%.

Wind and solar will also be expected to supply more than 20% of total demand in peak periods during the summer and winter evenings, says the plan. It expects “reliable peak-shaving capacity from renewable sources” to reach more than 300GW.

The new targets are a “positive move”, says Yao Zhe, global policy advisor at Greenpeace East Asia, as it “only applies during peak load and critical supply periods, when coal power is typically used to stabilise the power supply”.

She adds that this could, theoretically, “prevent the construction of new coal-fired power projects that are proposed and approved for the reason of meeting peak demand”.

The new metrics mark a change in focus, says Lyu Wenbin, director general of the Energy Research Institute – a state thinktank under the NDRC – in an “explanatory reading” posted on BJX News. He says it “marks a shift in renewable energy development from the mere pursuit of installed capacity to…also taking into account system support capabilities”.

The plan pledges to “accelerate the construction of grid-friendly wind and solar power stations”. It says this will enhance “reliable peak-load generation” and strengthen renewables’ ability to ensure “safe and stable operation” of the grid.

It says this will particularly be a focus in the energy-hungry east, central and south areas of China.

It sets out a slightly different focus for areas that already have a high share of renewables in their power mix, such as north-west China. Here, the aim will be to develop wind and solar parks that are “capable of providing voltage, frequency and inertia support”.

“This is a real challenge”, says James Norman, research analyst at GEM. He says these challenges are particularly acute in some circumstances:

“[For example], when the share of wind and solar is very high, relatively few synchronous generators (like coal) are online or large volumes of electricity are being transferred through high voltage DC lines.”

The plan mentions many technological solutions to address the problem, he tells Carbon Brief. However, he adds, there are no quantitative details for the issue. For example, he notes there is no target for “how many gigawatts of wind and solar must gain grid-forming capability”. This is in contrast to the goals for overall renewables capacity or generation.

Norman was a co-author on the recent GEM report, which identified further barriers to renewable uptake. It said these include transmission bottlenecks, alongside systemic features such as dispatching and power-contract mechanisms.

As a result, said the report, renewable power – especially solar – is increasingly being “curtailed”, particularly in north-western and northern provinces.

Yao also notes that the plan does not “spell out specific measures to address systemic constraints” around the electricity grid and the role of coal in the power sector.

“I interpret this as evidence that the vested interests are still strong in the policy debate,” she adds.

What does the plan say about ‘distributed’ energy?

Alongside gigawatt-scale clean-energy megabases, China also aims to expand construction of “distributed” energy. This means smaller-scale installations, such as rooftop solar.

More than 300GW of “distributed new energy” is to be added over 2026-30, some 60GW per year.

The plan aims for distributed new energy to be adopted in sectors such as industry, transport, buildings and agriculture.

Applications include the use of distributed solar and wind in industrial parks, coal mines and oilfields, as well as encouraging residents to install solar panels on buildings and developing rural clean-energy grids.

In some regions, distributed solar and wind is “likely to meet a large proportion of local demand”, says Prof Pan Jiahua at the Hong Kong University of Science and Technology (Guangzhou). He tells Carbon Brief that micro- and mini-grids using such resources will be particularly important in central and coastal China.

The 60GW annual target for new distributed energy is not “overly ambitious”, says Isadora Wang, head of China at the thinktank Transition Asia. She tells Carbon Brief that distributed solar additions, alone, exceeded 100GW in both 2024 and 2025.

Cosimo Ries, analyst at the consultancy Trivium China, agrees that the target is reachable. The biggest question mark, he tells Carbon Brief, is whether it will continue to make sense for industry and utilities to build distributed power at the volumes seen during the 14th five-year plan period.

He adds that market conditions for distributed solar have deteriorated sharply over the past two years. He says a range of factors have hit investor confidence:

“[Distributed solar faces] growing exposure to market trading, worsening returns in spot markets, growing risks of curtailment and new policies limiting or forbidding the selling of power back to the grid.”

What does the plan say about non-electricity use of renewables?

The plan also sets goals for renewable energy’s role in “non-electricity use”.

This means using renewable energy for purposes other than generating electricity, through converting it to other forms, such as heat or mechanical energy.

The government is aiming for non-power use to nearly triple from 60m tonnes of coal equivalent (Mtce) in 2025 to 150Mtce in 2030.

Ries tells Carbon Brief that he thinks this target is “one of the main highlights” of the plan. However, he notes that limited available data means it is hard to assess the level of its ambition. He adds that, given the relative conservatism of China’s other recent clean-energy targets, this one may also be met relatively easily.

Key applications for non-power use of renewables include “green hydrogen, ammonia and methanol”, says the plan. It also points to using wind and solar for heat, as well as to biomass and geothermal for heating and cooling.

Green hydrogen, ammonia and methanol are the “centrepiece” of the non-power push, according to state-owned newspaper Economic Information Daily.

For hydrogen alone, China plans to scale up renewable hydrogen production to 2m tonnes in 2030, up from 250,000 tonnes in 2025.

Today, non-power use of renewables accounts for only around 1% of China’s total energy consumption, NEA and NDRC officials said in a Q&A. They added that there is “considerable room for growth” in sectors such as industry, transport and buildings.

Potential new applications include the use of wind and solar for heat. This could see the use of centralised wind and solar heating stations in the chemicals, textiles, pharmaceuticals, papermaking and food sectors.

New projects in the steel and cement sectors should use locally-generated wind and solar to power electric-arc furnaces and kilns, adds the plan.

Wang tells Carbon Brief that she believes the naming of individual sectors is a “clear indication” that they will be included in China’s renewable consumption quotas. These already cover aluminium and other heavy industry sectors.

She adds that power and heat demand from the named sectors may help absorb distributed renewable energy. It will also serve as a testing ground for matching demand with supply through increased grid flexibility and power price reforms.

To Ries, the growing focus on non-power use signals that China’s decarbonisation efforts are “now entering deeper waters”. That means regulators are turning from easier-to-abate sectors, such as aluminium, to more challenging industries, such as steel.

The plan could create a “second growth curve” for the new-energy industry, says He Zhao, in a commentary for China Power News Net. He, the vice-president of the China Electric Power Planning and Engineering Institute (EPPEI). says this might begin with non-power use, before shifting to fuel, feedstock and heat substitution.

What does the plan say about China’s cleantech dominance?

The next five years is a prime opportunity for China to “consolidate our leading position across the entire industrial chain” for clean-energy technologies, says the plan.

It adds that the government will “strengthen technological innovation” and accelerate the roll-out of new applications of artificial intelligence in China’s renewable-energy system.

A particular focus for new R&D will be “cutting-edge, original and disruptive technologies”. It also points to technologies that “enhance the reliability of renewable energy” as a substitute for fossil fuels.

The plan names technologies for further development. For wind power, these include “reliable and low-cost” blades, ultra-tall towers and new types of floating platforms. It also mentions the development of “high-altitude wind power”. For solar, it points to the development of perovskite and other “high efficiency” solar cells, as well as space-solar technologies.

The plan also pledges to develop a power market that supports the “full entry” of renewable-energy companies. It underscores that companies should plan for an increasingly market-based and competitive environment.

Meanwhile, the government will also deepen cooperation with other countries on clean energy and “advance” global climate cooperation, it says.

A priority will be “strengthening” international coordination on investment and development in “green energy projects”. Another is “actively promoting the free circulation of China’s high-quality green technologies and products in global markets”.

Chinese exports of clean-energy technologies have been surging, especially since the closure of the strait of Hormuz.

At the same time, Chinese investment in clean-energy projects in Belt and Road Initiative member states totalled $20bn in the first half of 2026. This is also driven by the crisis.

The US, EU and others have launched tariffs and pricing mechanisms to curb imports of Chinese cleantech. This has contributed to pushback from China, against what it and others refer to as “unilateral trade measures”.

China is transitioning from a “major energy nation” (能源大国) to an “energy powerhouse” (能源强国), writes the Energy Research Institute’s Lyu in his explanatory reading. He says this will enable China to increasingly shift to building “systemic” advantages in developing clean-energy technologies.

He continues that, from 2026-2030, China will “move to the very forefront of the global stage” on clean energy, “venturing into uncharted territory”. This will create both “major new challenges and significant opportunities” for the country, he adds.

The post Q&A: What does China’s 15th ‘five-year plan’ for renewables mean for climate change? appeared first on Carbon Brief.

Q&A: What does China’s 15th ‘five-year plan’ for renewables mean for climate change?

Continue Reading

Climate Change

International Seabed Authority Assembly underway as calls for deep sea mining moratorium grows

Published

on

SYDNEY/KINGSTON, Wednesday 29 July — The future of deep sea mining will be a focus for world leaders this week as the International Seabed Authority (ISA) Assembly takes place in Kingston, Jamaica.

Country delegates and members from Pacific Civil Society have come together to discuss a deep sea mining code, while the call for a moratorium grows. It follows the ISA’s contentious decision last week to extend The Metals Company subsidiary Nauru Ocean Resources Inc’s (NORI) exploration contract, despite its support for the pursuit of unlawful deep sea mining via US unilateralism.

The Assembly’s agenda was agreed to yesterday, with a science item put forward by Vanuatu to be heard on Thursday local time. Overnight, Mozambique and Mauritius joined the call for a global moratorium.

Rae Bainteiti, Pacific Political Coordinator at Greenpeace Australia Pacific, said from the ISA in Kingston:

“As we move into the General Assembly this week, the fundamental issue remains that there is not enough science to guarantee the safety and protection of the ocean in a world where deep sea mining is allowed. As trustees of the ocean, the common heritage of humankind, our Pacific governments must stand firm against corporate interests that are pushing to move ahead with deep-sea mining outside the ISA framework. If deep sea mining goes ahead, Pacific communities will suffer the economic, cultural and social consequences. We continue to call on all States to support a moratorium as the principled and responsible pathway to protect the ocean.”

Currently, 45 countries, including seven Pacific nations, support a moratorium or precautionary pause on deep sea mining. Last week, Australia’s Labor National Conference committed to supporting a moratorium, but the government has yet to make an official comment.

— ENDS —

International Seabed Authority Assembly underway as calls for deep sea mining moratorium grows

Continue Reading

Climate Change

Analysis: Wind and solar power overtake fossil fuels in Germany for first time ever

Published

on

More of Germany’s electricity came from wind and solar power than fossil fuels for the first time ever in 2025.

Together, wind and solar power generated 225 terawatt hours (TWh) of electricity – accounting for 44% of the total in 2025 – with just 217TWh (43%) coming from fossil fuels.

Solar and onshore wind have grown rapidly under Germany’s “Energiewende” strategy over the past two decades, as the nation transitions away from both coal and nuclear power.

Renewables have recently faced mounting opposition from the far-right Alternative for Germany (AfD) party and the current coalition government has been trying to develop new gas-power plants.

Nevertheless, Carbon Brief analysis of Energy Institute data – shown in the chart below – illustrates how wind and solar have continued growing, emerging as the nation’s largest power source.

The success of renewables in Germany mirrors the EU as a whole, which also saw wind and solar overtake fossil-fuel power generation in 2025 for the first time.

“Other renewables” includes hydropower, bioenergy, geothermal and other renewable sources not otherwise stated. Source: Energy Institute Statistical Review of World Energy, 2026.

Germany has various targets in place that require a rapid expansion of wind and solar power, including cutting economy-wide emissions to net-zero by 2045.

The nation is also aiming to increase renewables’ share of electricity consumption to 80% by 2030 to achieve a “largely climate neutral” power system by 2035. It aims to decarbonise its electricity entirely once coal power has been phased out, which has a deadline of “no later than” 2038.

(The renewables targets also include electricity generated from hydropower and bioenergy. The latter produces a relatively large share of Germany’s power – roughly a tenth in 2025.)

Germany has to rely on renewables more than neighbours, such as France and the UK, to achieve its climate goals. This is due to its phaseout of nuclear power, which is a key part of the “Energiewende” strategy.

Nuclear power has long faced widespread public opposition in Germany. This year, the centre-right chancellor Friedrich Merz described the nuclear phaseout as a “strategic mistake”, but the government has ruled out a return to conventional nuclear power.

The country has an official coal phaseout date of 2038, but experts say the country is on track to eliminate coal from its power supply years earlier. This is despite some pressure to temporarily slow the transition away from coal during the recent energy crisis.

(Very few outside the AfD are calling to scrap the coal phaseout altogether, but the government will publish a review of the timelines in August.)

While coal generation has fallen quickly, even as nuclear was being phased out, some argue that coal could have been cut more quickly if nuclear had remained.

Gas-power expansion has also been framed by the government in recent years as an essential component of Germany’s transition away from coal and nuclear power, to support a renewables-heavy grid.

The current government under Merz has tried to boost gas and recently adopted a law to provide state support for new gas-fired power plants. The plan is for these plants to be converted to run on “green hydrogen” by 2045, in order to meet the climate-neutrality goal.

Germany aims to install 115 gigawatts (GW) of onshore wind by 2030 and approved a record 20.8GW of new capacity in 2025. 

Meanwhile, solar generation has reached unprecedented levels during the hot summer of 2026.

However, the government’s planned grid reforms have been criticised by the renewables industry for risking slowing down the energy transition. Under the proposals, renewables developers would only be granted automatic grid connections in areas with limited grid capacity if they waive compensation for future curtailed generation.

The post Analysis: Wind and solar power overtake fossil fuels in Germany for first time ever appeared first on Carbon Brief.

Analysis: Wind and solar power overtake fossil fuels in Germany for first time ever

Continue Reading

Trending

Copyright © 2022 BreakingClimateChange.com