

The Greenland ice sheet melt season for this year is over, resulting in the 28th year in a row in which Greenland has lost ice.
This has been a spiky year for Greenland – a mix of highs from abundant snow in winter and lows from some very high melt days in summer.
Those spikes of high snowfall delayed the onset of the melt season in June and reduced melt substantially in August. Fresh snow is a brighter white than old glacier ice, so summer snow effectively acted as a shiny protective blanket – just when the high melt season was getting going.
The 2023-24 year, as the year before, had strong melt rates throughout the northern-hemisphere summer, but also above average snowfall during winter and in June. As a result, the balance between accumulated snow and melting ice on Greenland’s surface ended above the 1981-2010 average.
The increase in both melt and snowfall are exactly what scientists expect in a warming climate. But, overall, Greenland has again lost more ice than it gained – even though, as in previous years, Greenland was comparably cool compared to North America and Europe.
High “calving” rates – the breaking off of icebergs at the face of the ice sheet – meant that Greenland lost 80bn tonnes of ice over the 12 months from September 2023 to August 2024. The last year to see a net gain of ice is still 1996.
This marks the 10th year of these annual reviews – see our previous annual analysis for 2023, 2022, 2021, 2020, 2019, 2018, 2017, 2016 and 2015.
Surface melt
Greenland’s annual cycle covers the 12 months from the previous September up to the end of August. Over this period, we calculate the “surface mass budget” (SMB) for the ice sheet.
The SMB is akin to the bank account for the surface of the Greenland ice sheet. It is the balance between gains (from snowfall) and losses (from ice melt and runoff).
As the ice sheet largely gains snow from September, accumulating ice through autumn, winter and into spring, we start the ice budget year on 1 September.
Then, as the year warms up into late spring, the ice sheet begins to lose more ice through surface melt than it gains from fresh snowfall, generally from the mid of June.
This melt season usually continues until the middle or end of August, the end of the surface budget year.
Snowfall is the only way for the ice sheet to gain mass. Therefore, for the size of the ice sheet to remain constant, this snow must outweigh all other ways the ice sheet can lose ice – iceberg calving, melt at the base of the ice sheet and evaporation from the surface.
According to our calculations, the Greenland ice sheet ended the year 2023-24 with an overall SMB of about 367bn tonnes (Gt). This is the 19th highest SMB in a dataset that goes back 44 years, and it is close to the 1981-2010 average of 348 Gt.
The past year’s SMB is illustrated in the maps and charts below, based on data from the Polar Portal. The blue line in the upper chart shows the day-to-day SMB. Large snowfall events become visible as “spikes”. The blue line in the lower chart depicts the accumulated SMB, counted from the beginning of the “mass balance year” on 1 September 2023. In grey, the long-term average and its variability are shown. For comparison, the red line shows the record-low year of 2011-12.
The map shows the geographic spread of SMB gains (blue) and losses (red) for 2023-24, compared to the long-term average. This shows that southern Greenland had a relatively wet year compared to the long-term average, but the north-west and west lost more than usual. The spikes of snow and melt are clear in the graphs on the right.

Heat over Europe and North America, cool over Greenland
While southern Europe sweltered through multiple heatwaves, northern Europe (with the exception of Arctic Scandinavia) had a rather cool and rainy July, followed by a warmer and sunnier late summer. Svalbard also suffered record temperatures and record amounts of glacier loss this year.
And, yet, Greenland was spared these bouts of heat.
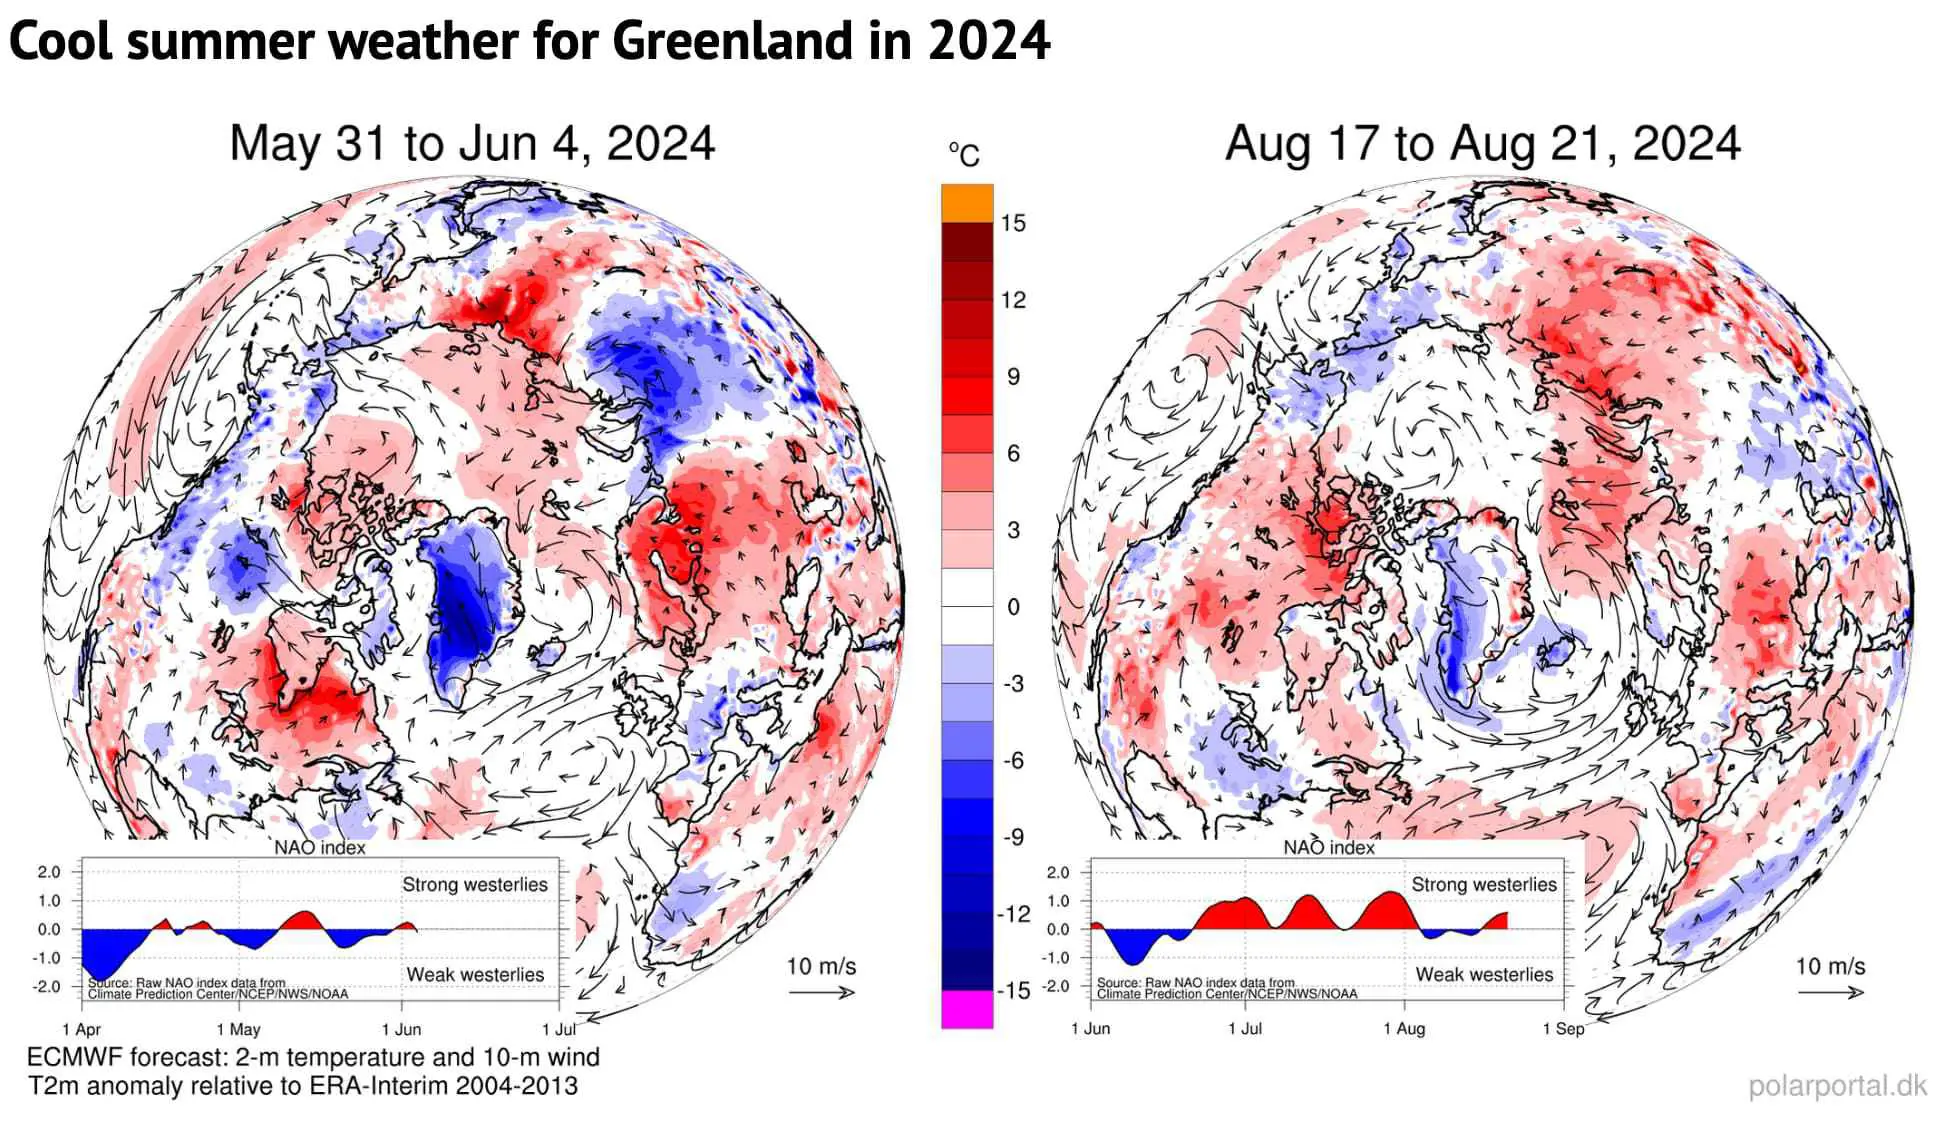
As in previous summer seasons, the comparatively wet and cool spells over the Greenland ice sheet were due to “blocking” weather patterns with ridges over North America and Europe and a trough in between over Greenland.
These high-pressure weather systems have a huge impact on weather extremes. Strong persistent blocks over North America and Europe were present in the course of the summer. This resulted in widespread heat near the cores of these high pressure areas and several heavy rainfall events in various European countries in May and June.
In such a blocked flow, the jet stream is shaped like the Greek capital letter Omega (Ω). With the jet stream bulging up to the north over Canada and northern Europe, troughs of low pressure are found at each “foot” of the omega – including over Greenland.
Svalbard was caught in one the opposite part of the omega with high temperatures and warm air directly over the islands, bringing large amounts of ice melt.
This contrast between Greenland on the one side and Svalbard and the eastern part of Canada is also a common pattern and shows how focusing on extremes in one region of the world means missing out on the opposite extreme in a different region.
The maps below show two examples of these recurring circulation patterns from late May/early June and mid-August. The blue shading shows the cool weather over Greenland (in the centre of the map), while the red shading shows the high temperatures over Canada, Europe and Svalbard .
Snow accumulation
However, the surface mass budget is not just about ice melt.
September, October and November all saw above-average snowfall. Then, as in 2022-23, a rather dry period followed in late winter, followed by spikes in snow in March, April and May.
As a result, the accumulated SMB was close to the 1981-2010 average as melting began.
Subsequently, in June, several large snow fall events brought an emergency blanket back to the ice sheet, delaying the start of the “ablation” – or melt – season to 24 June, 11 days later than the 1981-2010 median. (The ablation season is defined as the first day of three days in a row with an SMB below -1Gt.)
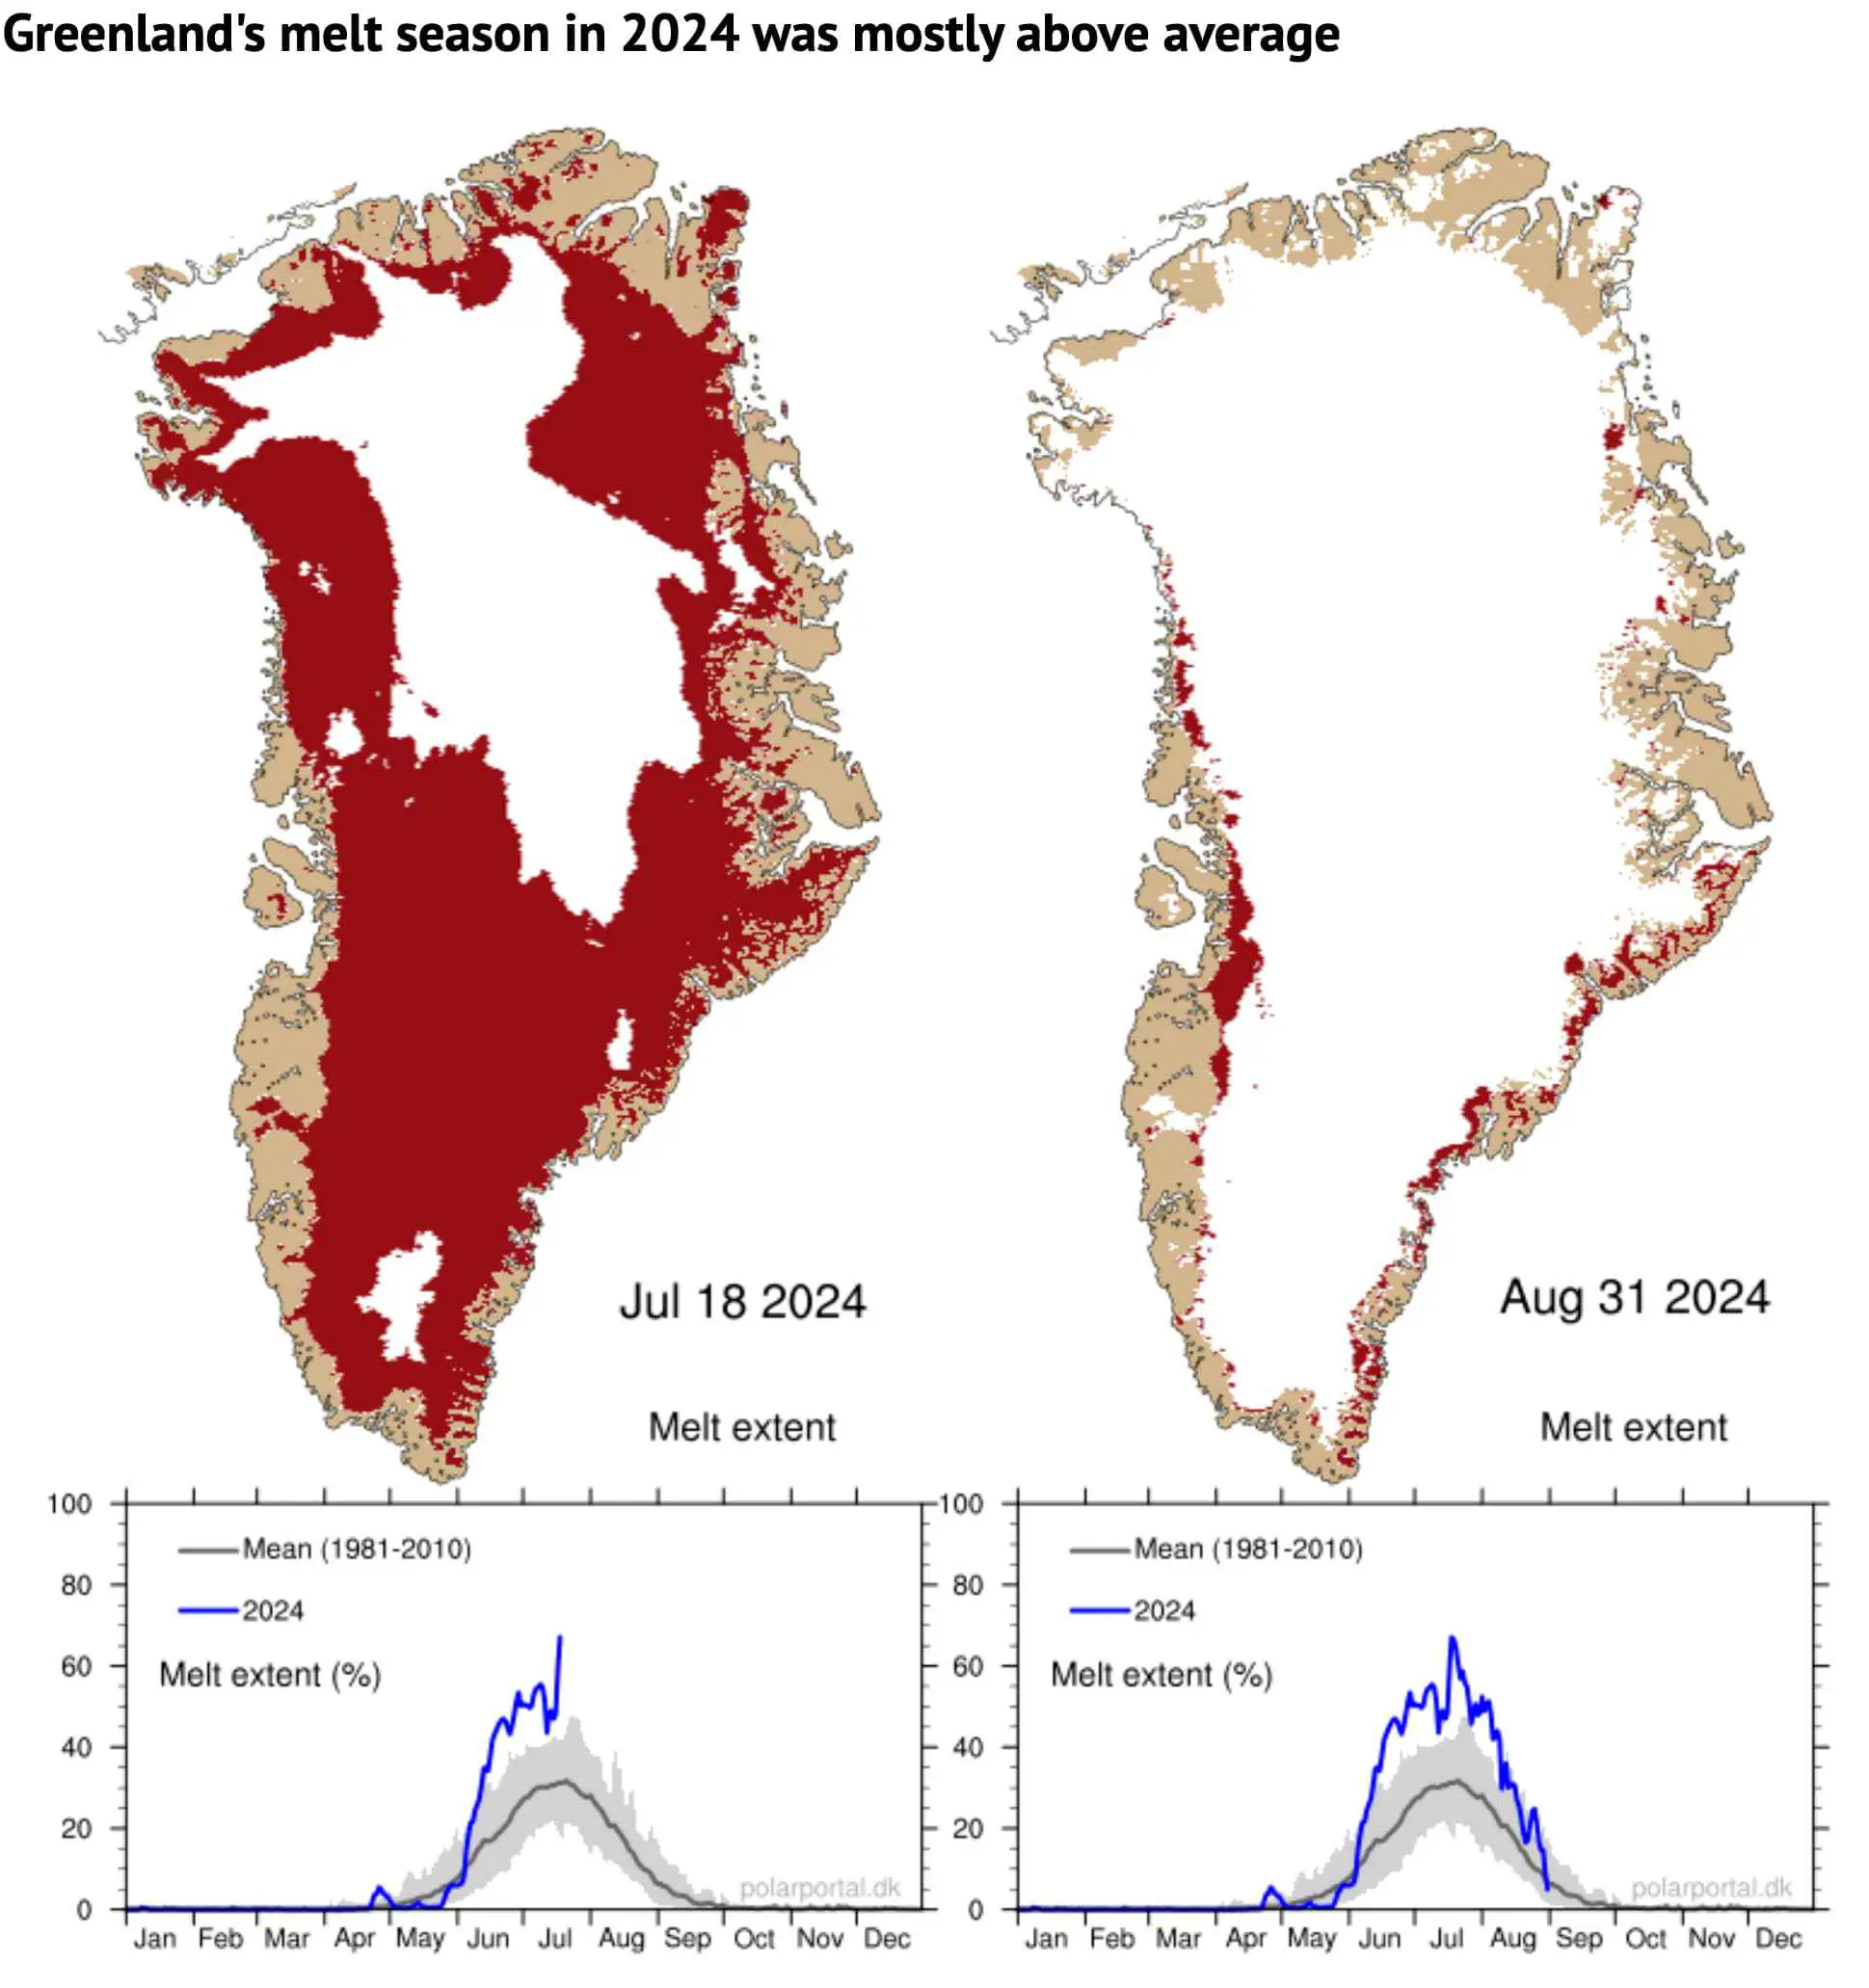
The melt area was well above the average for the period of 1981-2010 during most of June, July and August – despite another spike in snow in August.
The left map shows the area of ice melt on 18 July – the day with the maximum melt extent (67%) of this summer (shaded in red). The map on the right shows the situation at the end of the season on 31 August when the ice sheet was well back into the winter pattern.
The charts beneath show the daily extent of melting across the ice sheet as a percentage (blue line), with the 1981-2010 average shown in grey.
The total mass budget
The surface budget is just one component of the “total” mass budget (TMB) of the Greenland ice sheet:
TMB = SMB + MMB + BMB
Here, MMB is the “marine” mass balance, consisting of the breaking off – or “calving” – of icebergs and the melting of the front of glaciers where they meet the warm sea water. BMB is the “basal” mass balance, which refers to ice losses from the base of the ice sheet. This makes a small, but non-zero, contribution to the TMB and mainly consists of frictional effects and the ground heat flux.
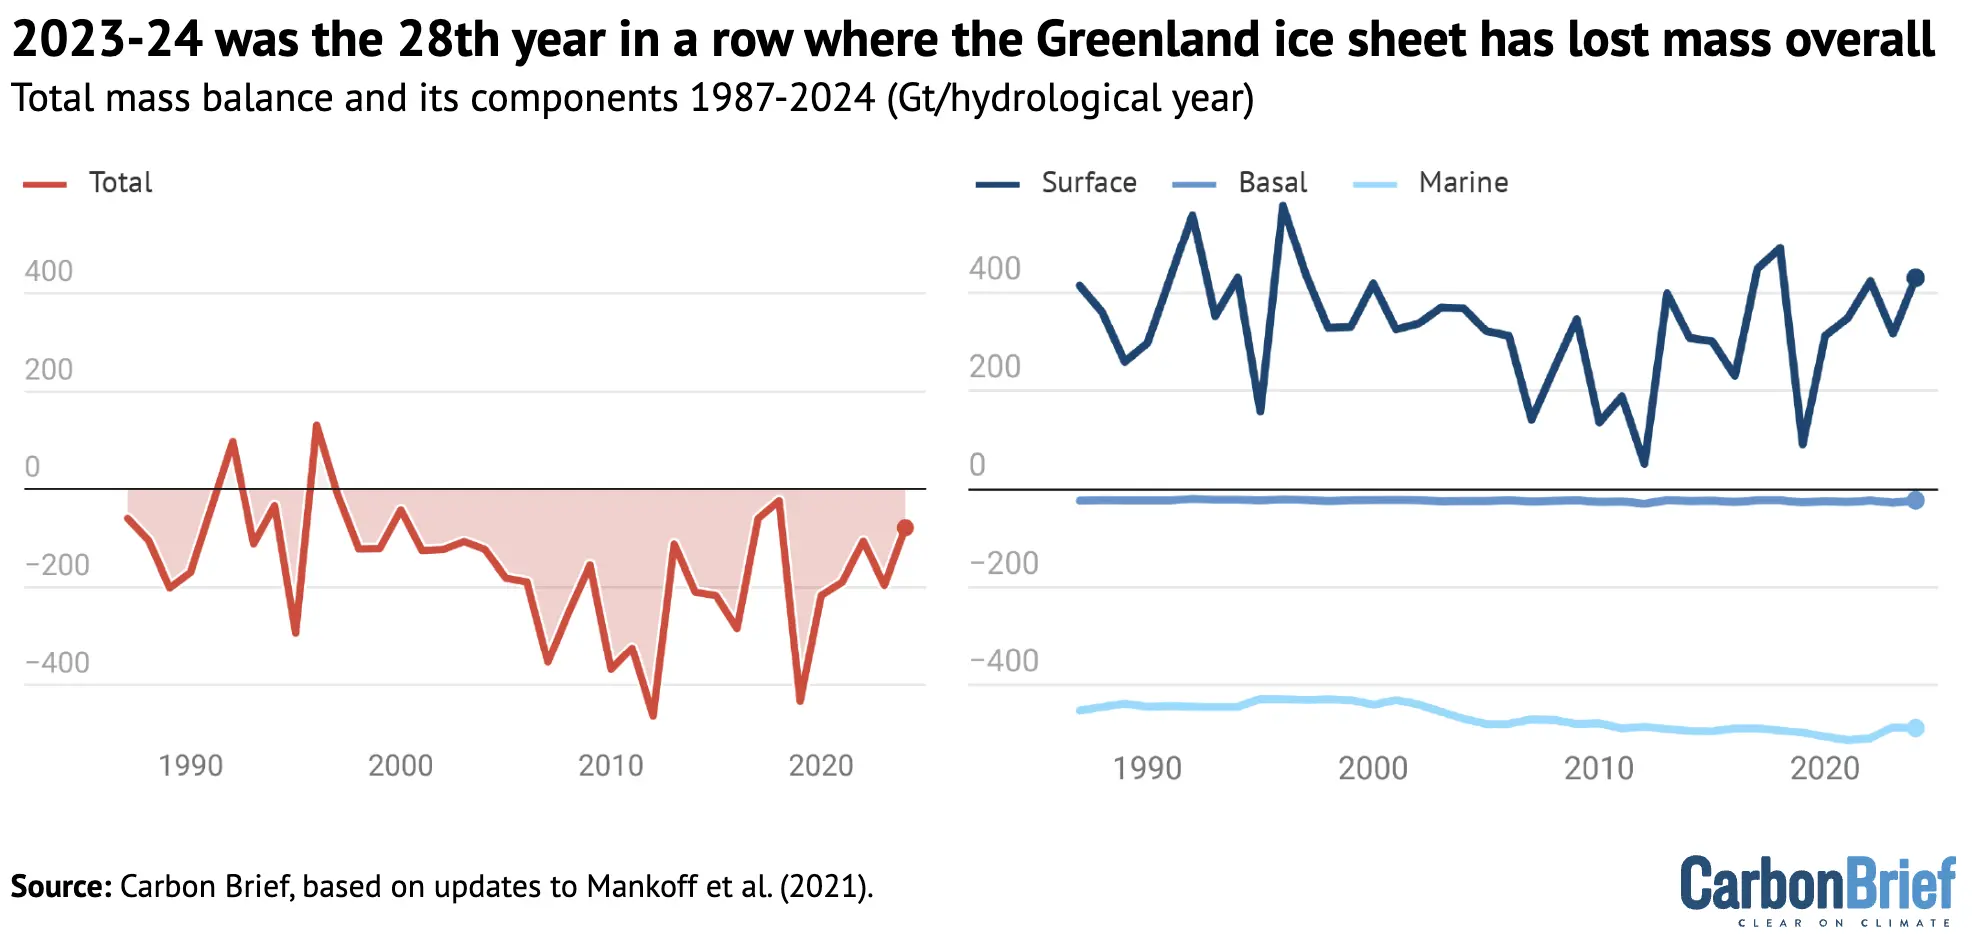
The figure below shows how much ice the Greenland ice sheet has lost (red) going back to 1987, which includes the SMB (blue), MMB (green) and BMB (orange).
For 2023-24, the TMB ended with a loss of 80Gt of ice. This means that 2023-24 was the 28th year in a row with a Greenland ice sheet overall mass loss. As the chart shows, Greenland last saw an annual net gain of ice in 1996.
Satellite data
Using data from the GRACE satellites, we can also estimate how much ice Greenland lost – independently from our calculations above.
The distance of these twin satellites changes slightly due to tiny gravity differences caused by mass changes. In addition, we can measure the speed at which ice flows through control points on the ice sheet where we know the thickness and shape of the ice. Thus, we can estimate MMB, the amount of ice being lost by the process of calving and submarine melting.
This data is openly available, allowing us to monitor the whole ice-sheet budget.
The map and graph below show the gain (blue) and loss (red) in the mass of ice. The difference in these mass changes over a glaciological year (September-August) is the TMB of the ice sheet for that particular year.

According to the GRACE satellite data, most of the ice loss over 2023-24 occurred along the edge of the ice sheet, in particular along the west coast. This is backed up both by PROMICE observations and model data. In the interior of Greenland, a small increase in ice mass is found, as there is usually little or no snow melt in this region.
The graph illustrates the month-by-month development in changes of mass measured in gigatonnes, relative to April 2002. The left axis on the graph shows how this ice mass loss translates into a sea level rise contribution, where 100Gt corresponds to 0.28mm of global sea level rise.
Our calculations and the GRACE satellite data are entirely independent ways of estimating Greenland’s TMB, yet the results are quite closely aligned. From April 2002 to May 2024, the ice sheet losses amounted to 4,756Gt (calculations) and 4,911Gt (satellites) of ice.
As 1Gt of water is equivalent to a cube of 1 km by 1 km by 1 km, 360 of these cubes is equivalent to 1mm of sea level rise averaged around the whole globe.
This means that, since 2002, the Greenland ice sheet alone has contributed around 14mm to global average sea level rise.



The post Guest post: How the Greenland ice sheet fared in 2024 appeared first on Carbon Brief.

Jacynta Fa’amau is a Pacific campaigner at global grassroots climate movement 350.org and a secretariat member of Pacific Climate Warriors.
The first thing that struck me was the sheer size of Queensland’s Saraji coal mine. Standing at the edge of the enormous pit, my brain scrambled for words as I scanned the earth’s open wound – a whole island could probably fit inside it.
Looking down, I noticed footprints of an emu and a koala, pressed and dried in what was once a puddle – signs of how drought had driven animals in desperate search of water, so dangerously close to the coal trucks and heavy machinery ahead.
Earlier this year, I joined a small group of Pacific Islanders on a journey through the Bowen Basin to learn from First Nations communities battling Australia’s mammoth coal industry. Of the more than 40 coal mines operating in the area, BHP & Mitsubishi Alliance’s Saraji mine is one of the largest. So it came as a painful shock to us when in August, the Australian government approved the mine’s extension just months after our visit.
-
As COP31 co-host, Australia should make its polluters pay for climate damage
With UN climate funds running short on cash, now is the time to start taxing the companies whose emissions are driving harm in the Pacific and other vulnerable parts of the world -
At pre-COP, UN climate chief warns of heat threat to mothers and babies
The spotlight on maternal health came on the first day of the pre-COP31 meeting in Fiji, where Pacific concerns are set to top the agenda as ministers gather for talks


Witnessing coal extraction is devastating. It is bad enough to see what pillaging tonnes of coal can do to a mine’s immediate surroundings: dry creek beds, dwindling wildlife, denuded land. But to know that this coal will be shipped across the ocean, bring air pollution, and eventually lead to the destruction of Pacific islands thousands of miles away is another kind of heartbreak.
Rising ocean waters
I’m an Australian-born Samoan. In 2002, I visited my family home for the first time. My father took me to the rural community where generations of my family were raised. He did not have the words to describe how much has changed since rising ocean waters had taken away almost a third of the beach.
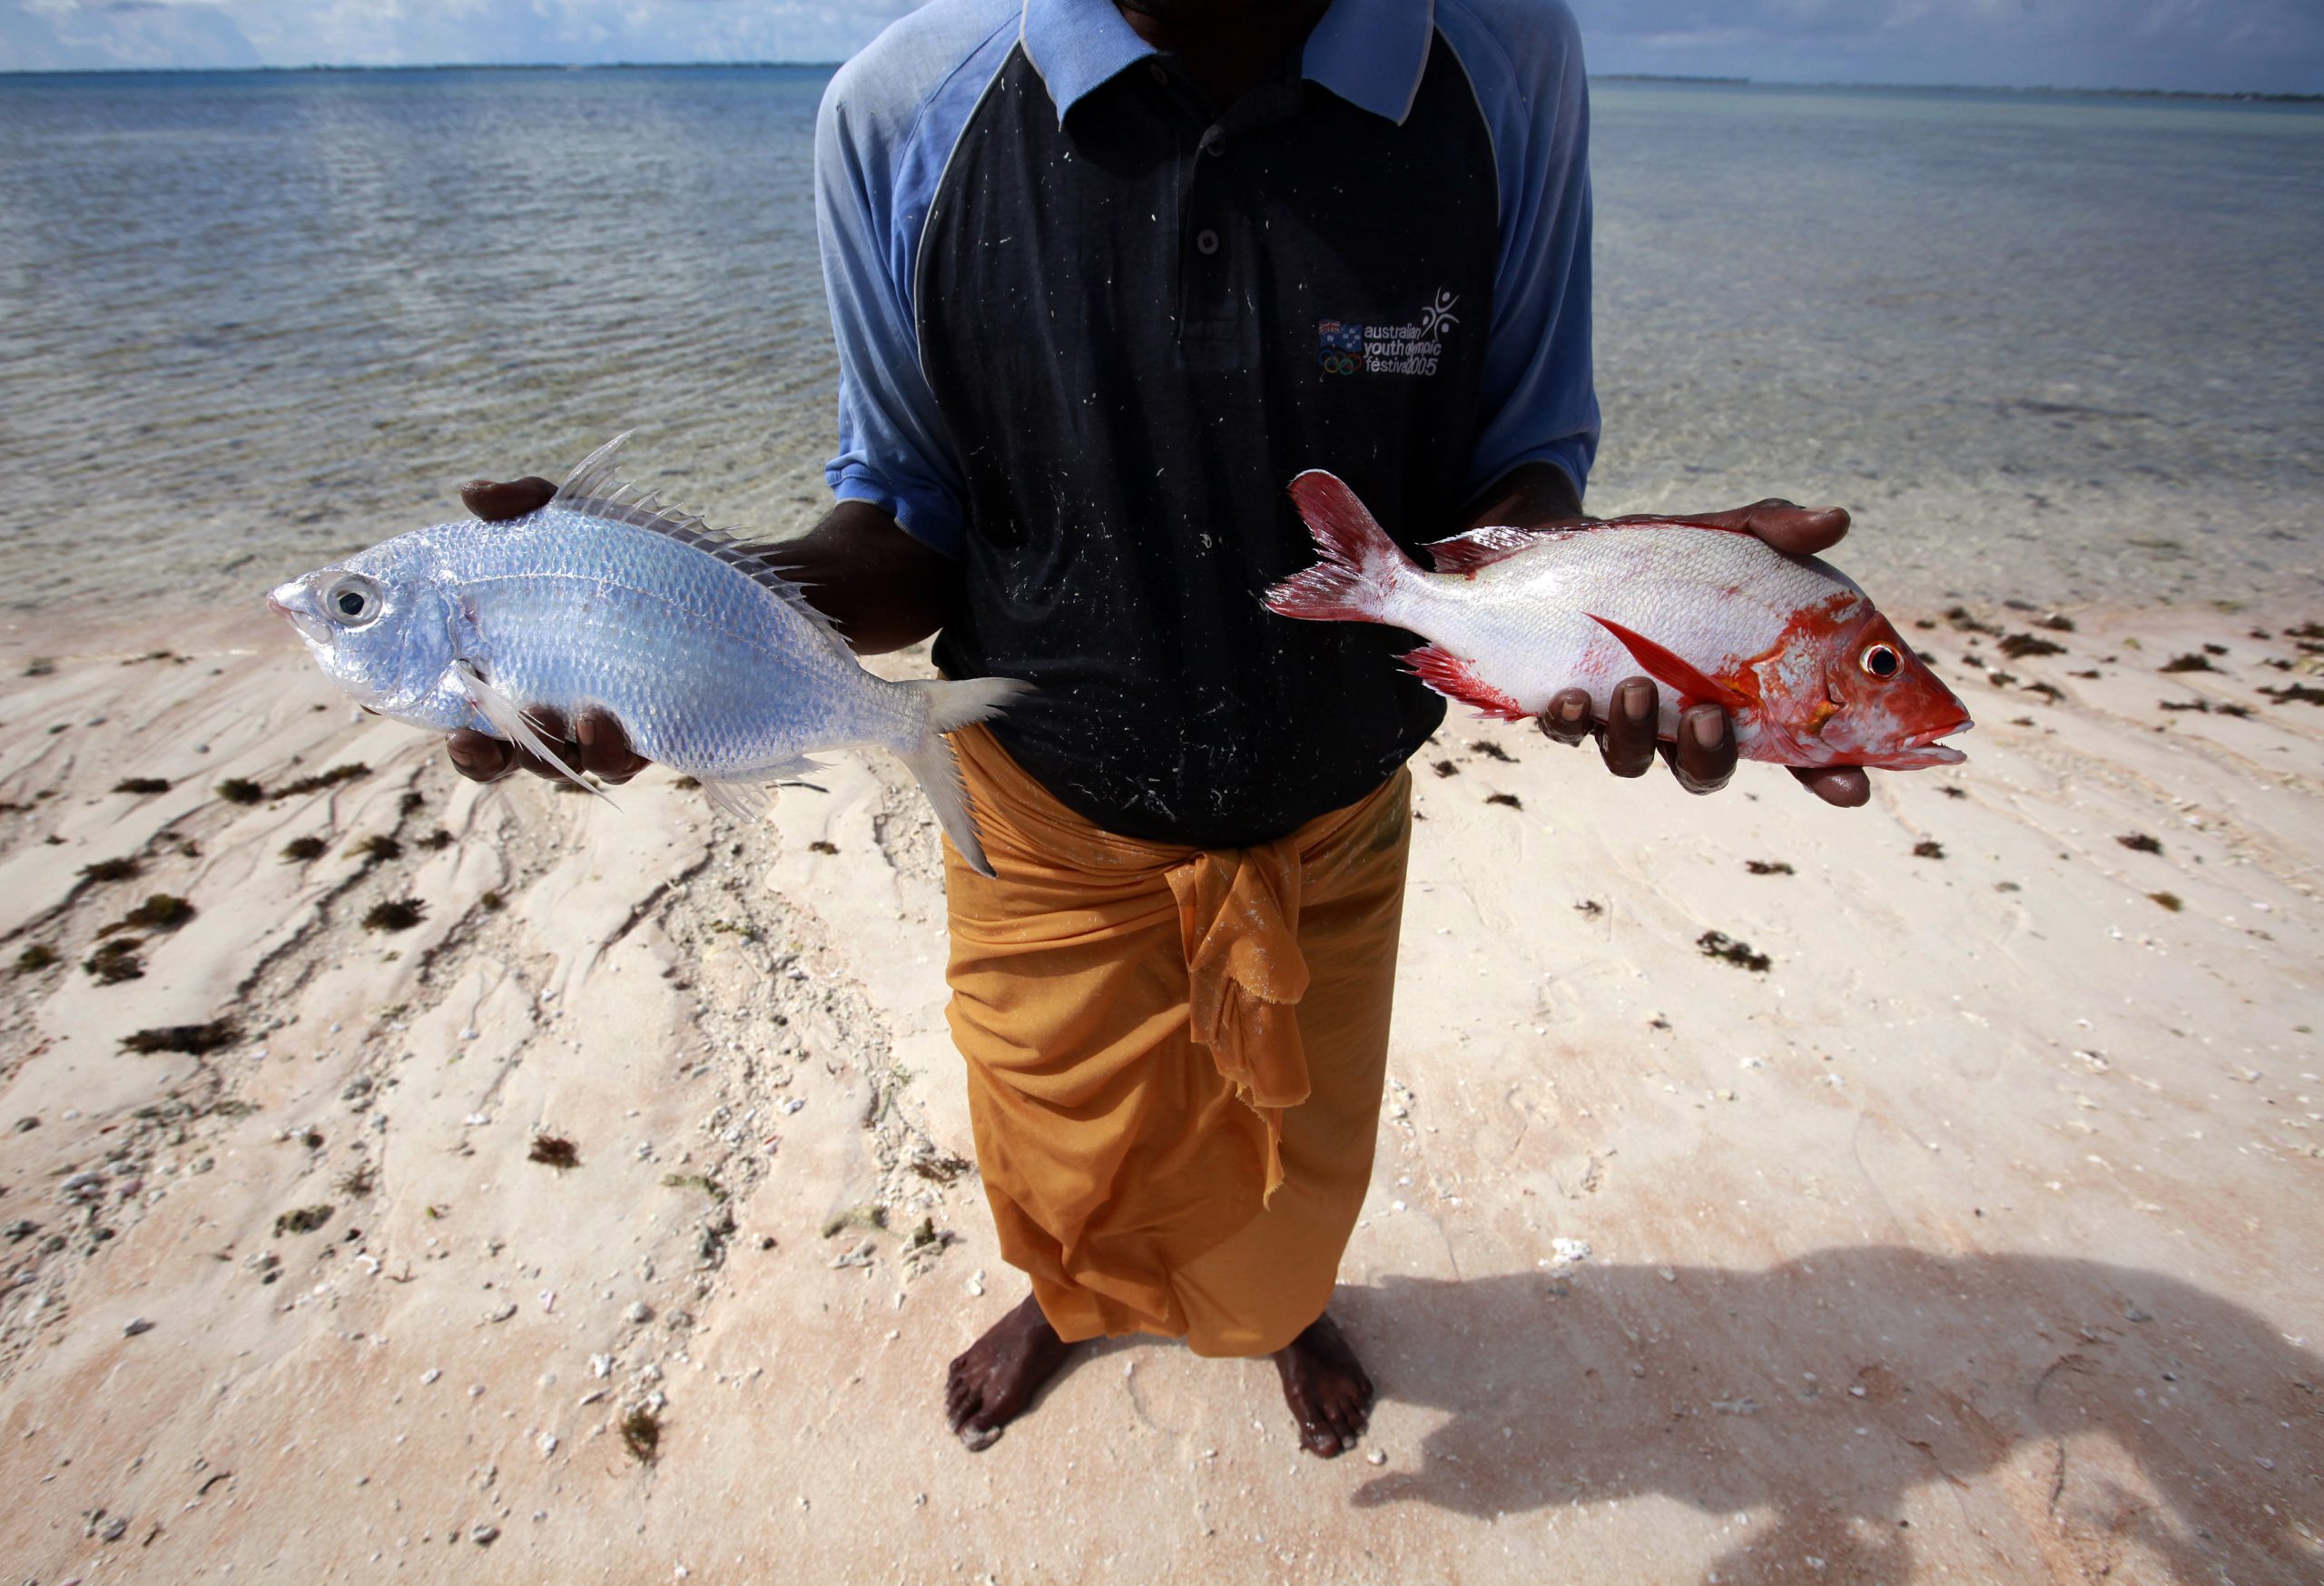
I learned of how we had to relocate my great‑great‑grandparents’ grave to higher ground twice in the last 15 years. Of how my cousins have to paddle out further to sea to catch fish, since warmer waters have destroyed much of the reef. Of how the ocean crashes so close to my uncle’s home that he had to build a new house further away.

We saw reflections of our own climate destruction in the Pacific when we shared these stories with our First Nations relatives at the edge of the Saraji mine. Murrawah Johnson and Teila Watson, both Birri Gubba and Gangulu women, made clear connections between their struggles and ours. “We don’t get to inherit our land and we don’t get to inherit our traditional roles. We are fighting a war on extinction,” Murrawah said.
Coal extraction devastated their lands and cultures – totems have disappeared, fresh water has become scarce – while the effects of using it have devastated ours. “King tide, cyclones, all the violence that has been enacted on your country and people is because of the violence that has been allowed here, to us and our country,” Teila said.
Wearing the mantle of climate leadership
This week, Australia is assuming the mantle of climate leadership as co-president and head of negotiations of this year’s UN Climate Change Conference, COP31. It will lead on deliberating the summit’s priorities as world leaders and climate negotiators descend on Fiji and Tuvalu for the pre-COP meetings.
Ironically, just days before the pre-COP began, the New South Wales Independent Planning Commission approved the largest-ever coal project the state has seen, set to emit an extra 800 million tonnes of carbon emissions. I joined the Pacific Climate Warriors and other communities in submitting about 4,000 appeals to oppose the project – yet these all fell on deaf ears.
-
Fossil fuel expansion threatens COP31 hosts’ credibility, experts warn
Türkiye and Australia are pushing coal, oil and gas at home with no national timeline for their own fossil fuel phase-out -
This Australian coal community is co-designing its own green future
The mining town of Collie offers a promising example of how to survive – and even thrive – amid the global transition to net-zero emissions

But the fight is not yet over. The project still requires federal approval to proceed, so every promise that Australia makes while at the helm of the climate talks counts. These promises will be measured against actual decisions it makes at home: to either lock us into more decades of climate pollution, or begin shutting down coal and gas once and for all.
Pacific leaders have made it clear that countries must align their policies with the 1.5-degree warming goal, a limit that we already know will be breached within the decade. Any chance of keeping this still within reach requires an immediate end to fossil fuel expansion and concrete plans to phase out existing projects. But success will be an uphill battle if COP31’s own head of negotiations refuses to lead by example.
Australia remains the second-largest coal exporter in the world. It is one of the very few industrialised countries under the Paris Agreement’s Annex I that still has no coal phase-out plan. Since 2022, the Albanese government has approved 37 new, expanded or extended coal, oil and gas projects. It is thus unsurprising that its own mitigation policies have been rated by Climate Action Tracker as “insufficient”, even without factoring in fossil fuel exports and related expansion.
Keeping 1.5C alive
Australia must course-correct to earn the mantle it has been given, especially by Pacific nations that backed the country’s bid for the COP31 co-presidency. As a first step, the government must end all coal expansion and explicitly declare a coal phase-out date. It’s the only way to show that it’s capable of leadership that moves beyond endlessly deliberating the “if”, and starts implementing the “how” of keeping the 1.5C target alive.
The dread I felt staring down at the abyss on the edge of that coal mine months ago still exists. I carry it with me as I show up at the pre-COP to demand that leaders heed the calls of Pacific people. But it is tempered with resolve to keep our lands and communities alive. We remain steadfast in our efforts to secure an outcome that protects people everywhere and brings us back below 1.5 degrees as soon as possible.
The post Coal mines and hypocrisy must not be Australia’s COP31 legacy appeared first on Climate Home News.
Coal mines and hypocrisy must not be Australia’s COP31 legacy