As successive heatwaves hit Europe, air-conditioning (AC) has emerged as a new front in the international “culture war” over climate action.
France, Germany and the UK have experienced record-breaking heat and thousands of heat-related deaths this summer, with June temperatures in many regions passing 40C.
This has drawn attention to the relatively low rates of AC use in these countries – and in Europe as a whole – especially when compared to its widespread adoption in the US.
Legacy newspapers, bloggers and even Elon Musk have all weighed in on “European hostility” to AC, criticising Europe’s “cultural conservatism” and “overbearing governments”.
Right-wing politicians, including National Rally in France and the UK Conservatives, have styled themselves as champions of AC, while opposing efforts to tackle climate change.
Missing from most of these interventions is the fact that human-caused climate change has made once-rare heat far more common, in what is the world’s fastest warming continent.
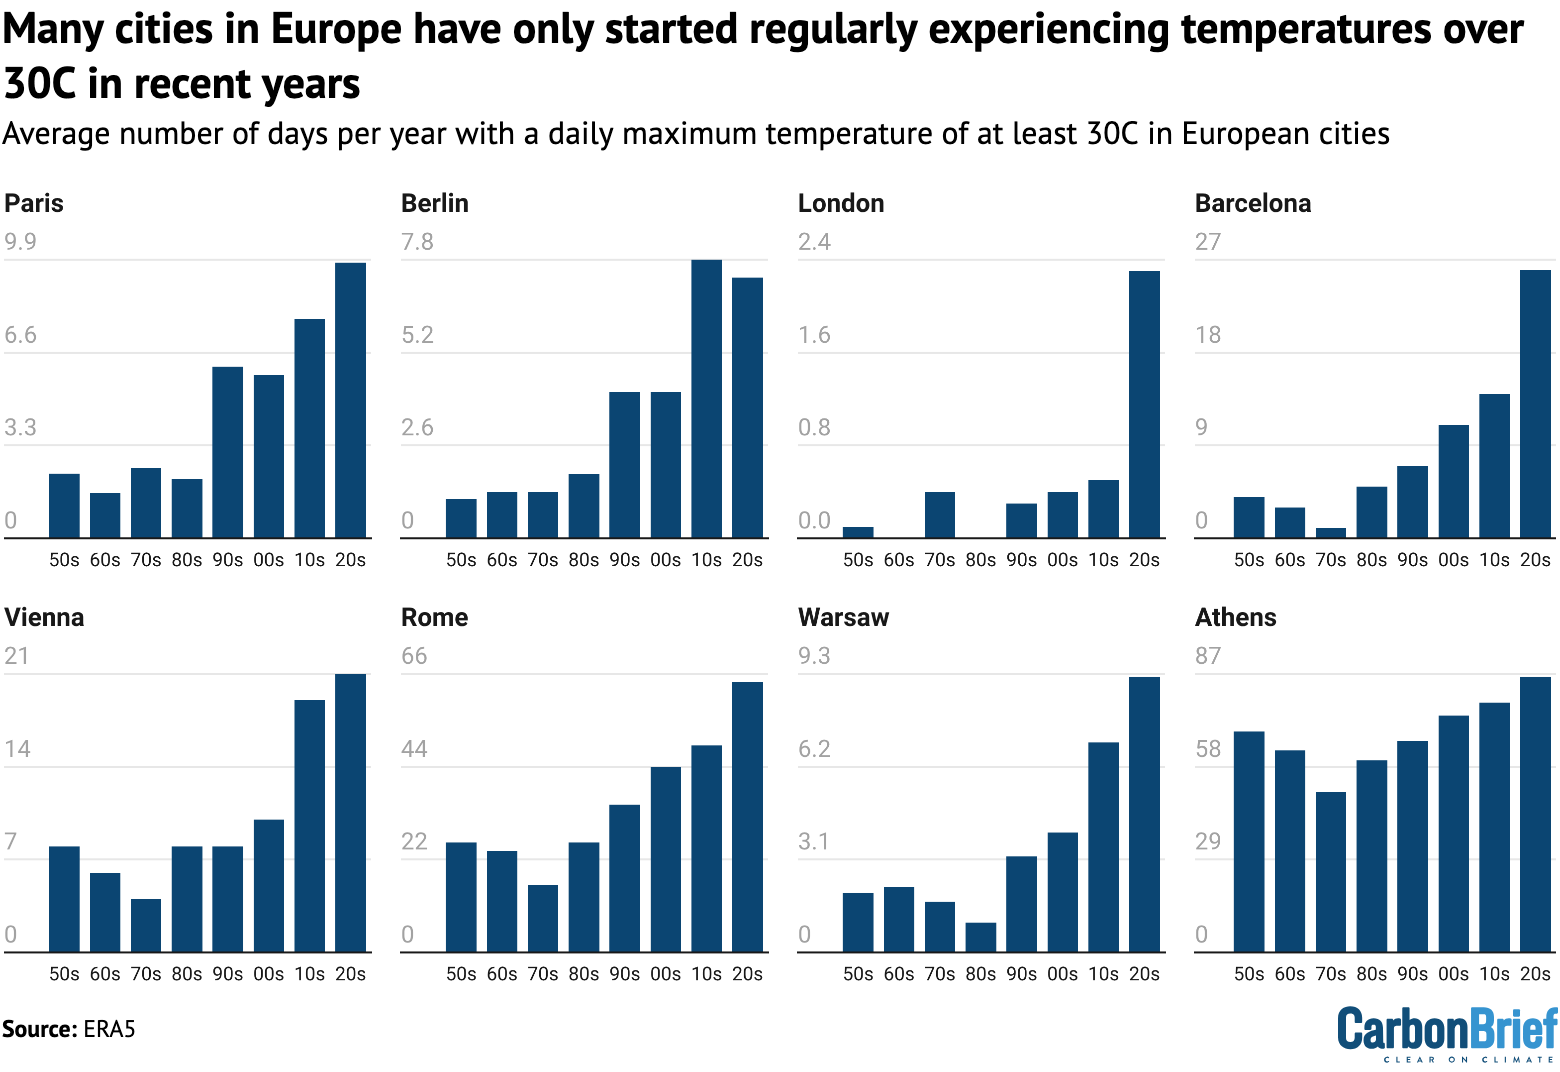
Carbon Brief analysis for this article shows that, until the 2020s, it was rare for many European cities to see days above 30C, making AC an unnecessary expense.
Here, Carbon Brief explains – via eight facts – why AC rates in some parts of Europe are relatively low, as well as clarifies and contextualises some of the misleading claims circulating about the technology.
- Much of Europe has not needed AC in the past
- AC is already widely used in hotter parts of Europe
- Some European nations have ‘resisted’ AC – but its popularity is growing
- AC emissions are growing, but its climate impact could be limited
- Heat from AC can contribute to directly warming cities
- More AC could help to reduce heat deaths in Europe
- ‘Net-zero rules’ are not blocking AC installation in the UK
- AC is not the only answer to overheating cities
Much of Europe has not needed AC in the past
AC installation rates in northern parts of Europe are very low. The best available estimates suggest that 6% of households in Germany and just 4% in England use AC.
However, these rates are largely explained by the historical climates in these nations.
Unlike the US, much of the housing stock and infrastructure in Europe was built at a time when AC did not exist and was not necessary.
Moreover, nations such as France, Germany and the UK have only started to regularly experience extreme heat in recent decades.
The chart below shows the average number of days per year, in each decade since the 1950s, when maximum temperatures have exceeded 30C in major European cities. Capitals such as London and Paris have seen a significant jump since around 2000.
Prof Jan Rosenow, an energy and climate researcher at the University of Oxford, tells Carbon Brief:
“For most of the 20th century, northern Europe simply didn’t need cooling. Homes in Britain and Germany were built to keep heat in, not out, because winters were cold and summers rarely hot.”
Much of the commentary about the relatively low rates of European AC use focuses on cultural or “ideological” factors. (See: Some European nations have ‘resisted’ AC – but its popularity is growing.)
However, Rosenow says people’s views on AC in these countries likely stem from their historically colder climates. He adds:
“Attitudes formed around those facts, not the other way round…There is a cultural element, but it is the product of climate, not of some green ideological project.”
In the past, many in Europe relied on traditional methods to keep buildings cool. Richard Black, head of communications at Climate Analytics, made this point in a post on LinkedIn:
“Once, residents of cities such as Paris could cope with summer heatwaves by opening shutters and windows during the night, and closing them again in the morning to trap the cool air inside…We’ve reached a limit to this sort of adaptation.”
Now, with Europe around 2.5C warmer than pre-industrial levels, climate change is routinely driving record-breaking heatwaves, even in the north of the continent.
This is forcing a reappraisal of societies that were “built for a climate that no longer exists”, as the UK’s Climate Change Committee (CCC) put it in a recent report.
Experts broadly agree that much of Europe will indeed need more AC, particularly in spaces housing the most vulnerable populations, such as care homes, schools and hospitals.
At the same time, they also emphasise broader, “passive” efforts to make cities and homes cooler alongside increased AC use. (See: AC is not the only answer to overheating cities.)
AC is already widely used in hotter parts of Europe
During periods of extreme heat, articles criticising “European hostility” towards the technology frequently note that “only about 20%” of households in Europe have AC.
Often, this is contrasted with the US, where more than 90% of households have AC installed. (In fact, the US is something of a global outlier, matched only by Japan.)
However, the continent-wide figure for Europe obscures the reality. In southern Europe – where temperatures are and have always been higher – AC is relatively common.
The map below, based on official EU data, shows that southern European nations use far more household energy for “space cooling” than those in the north.
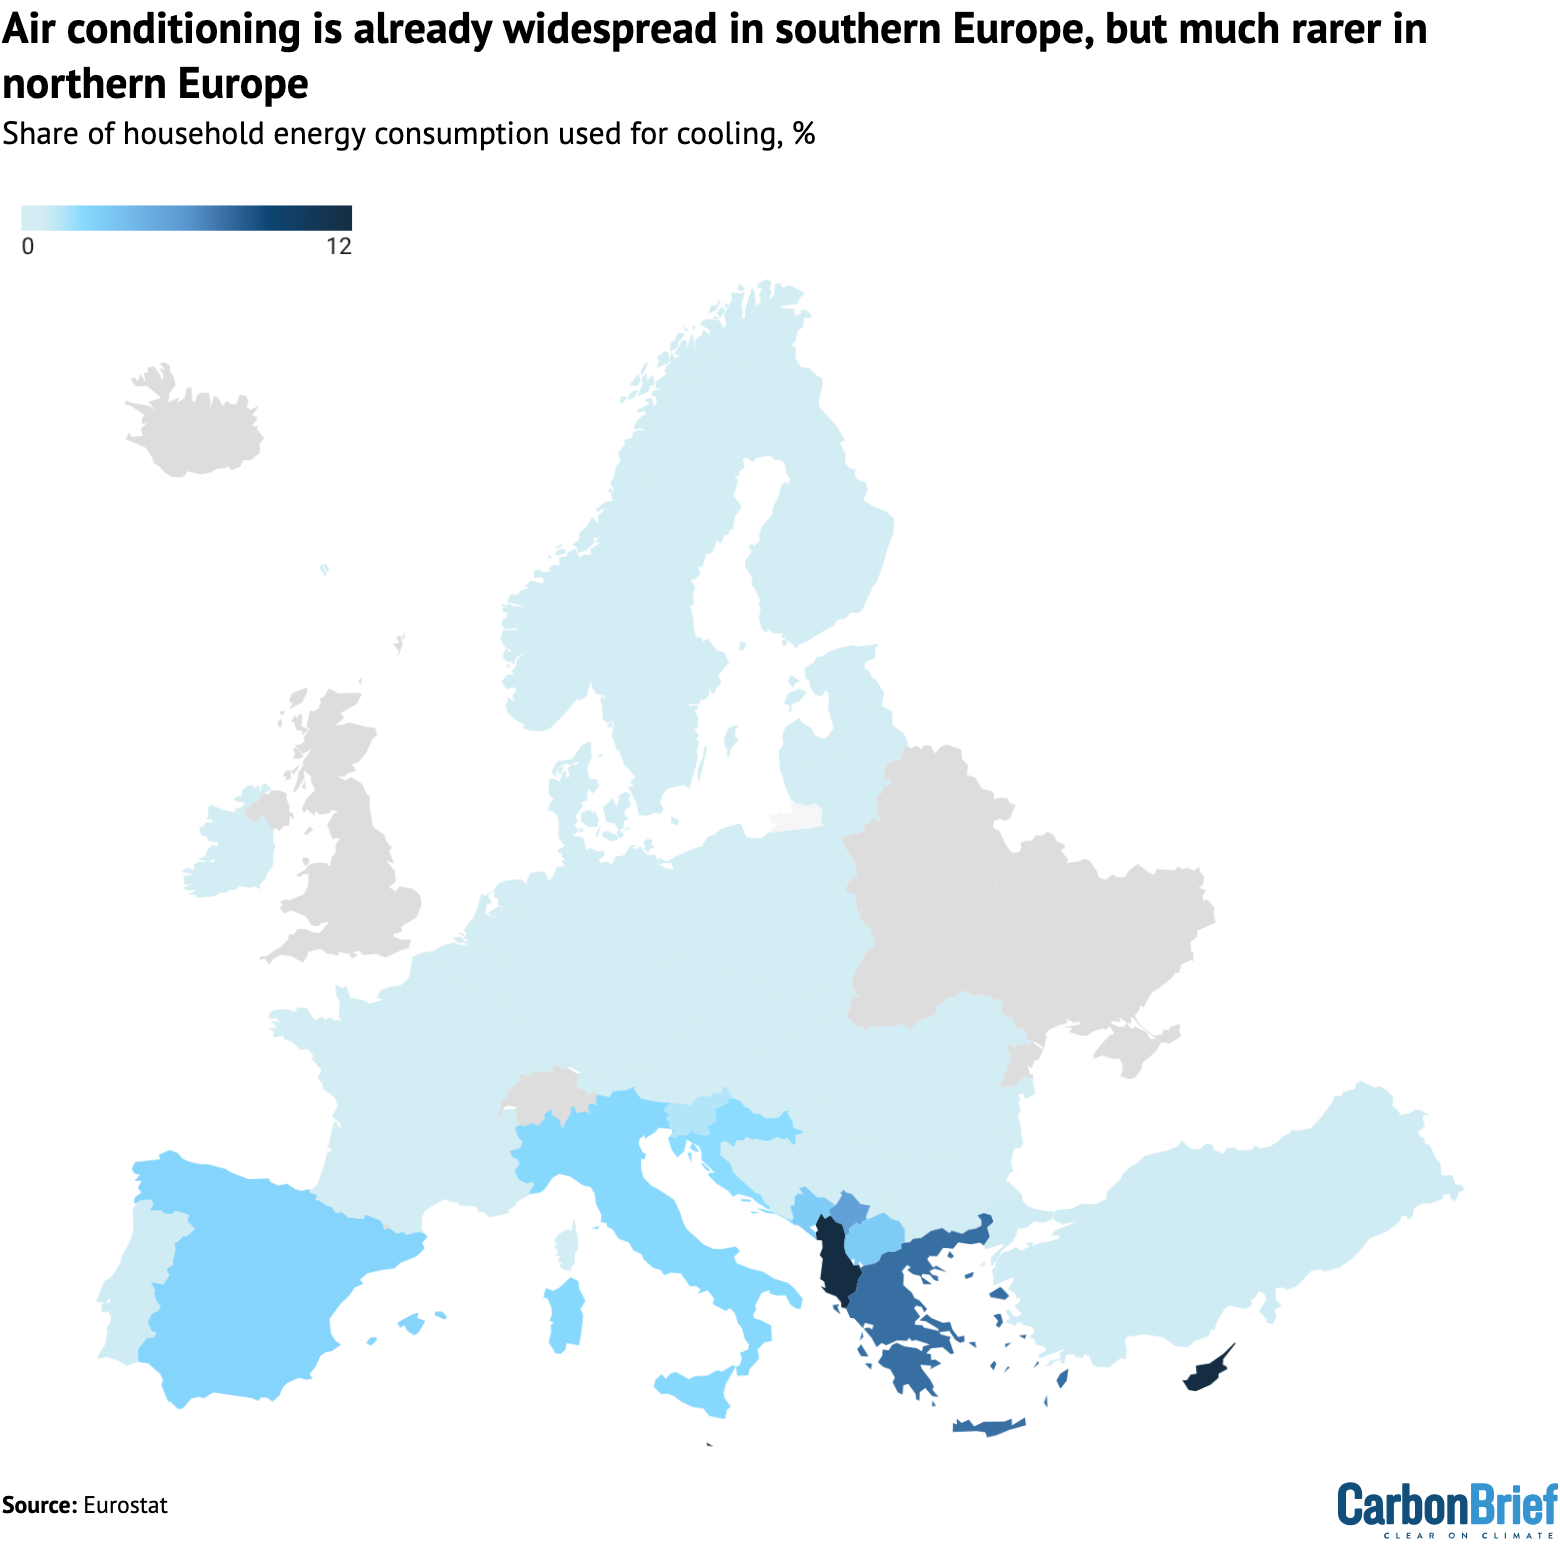
Government figures show that nearly 60% of Italian households have AC. Household-level data in many countries is patchy, but various analyses have placed that figure at 70-80% in Greece and 41% in Spain – with higher penetration in the hotter, southern part of the country.
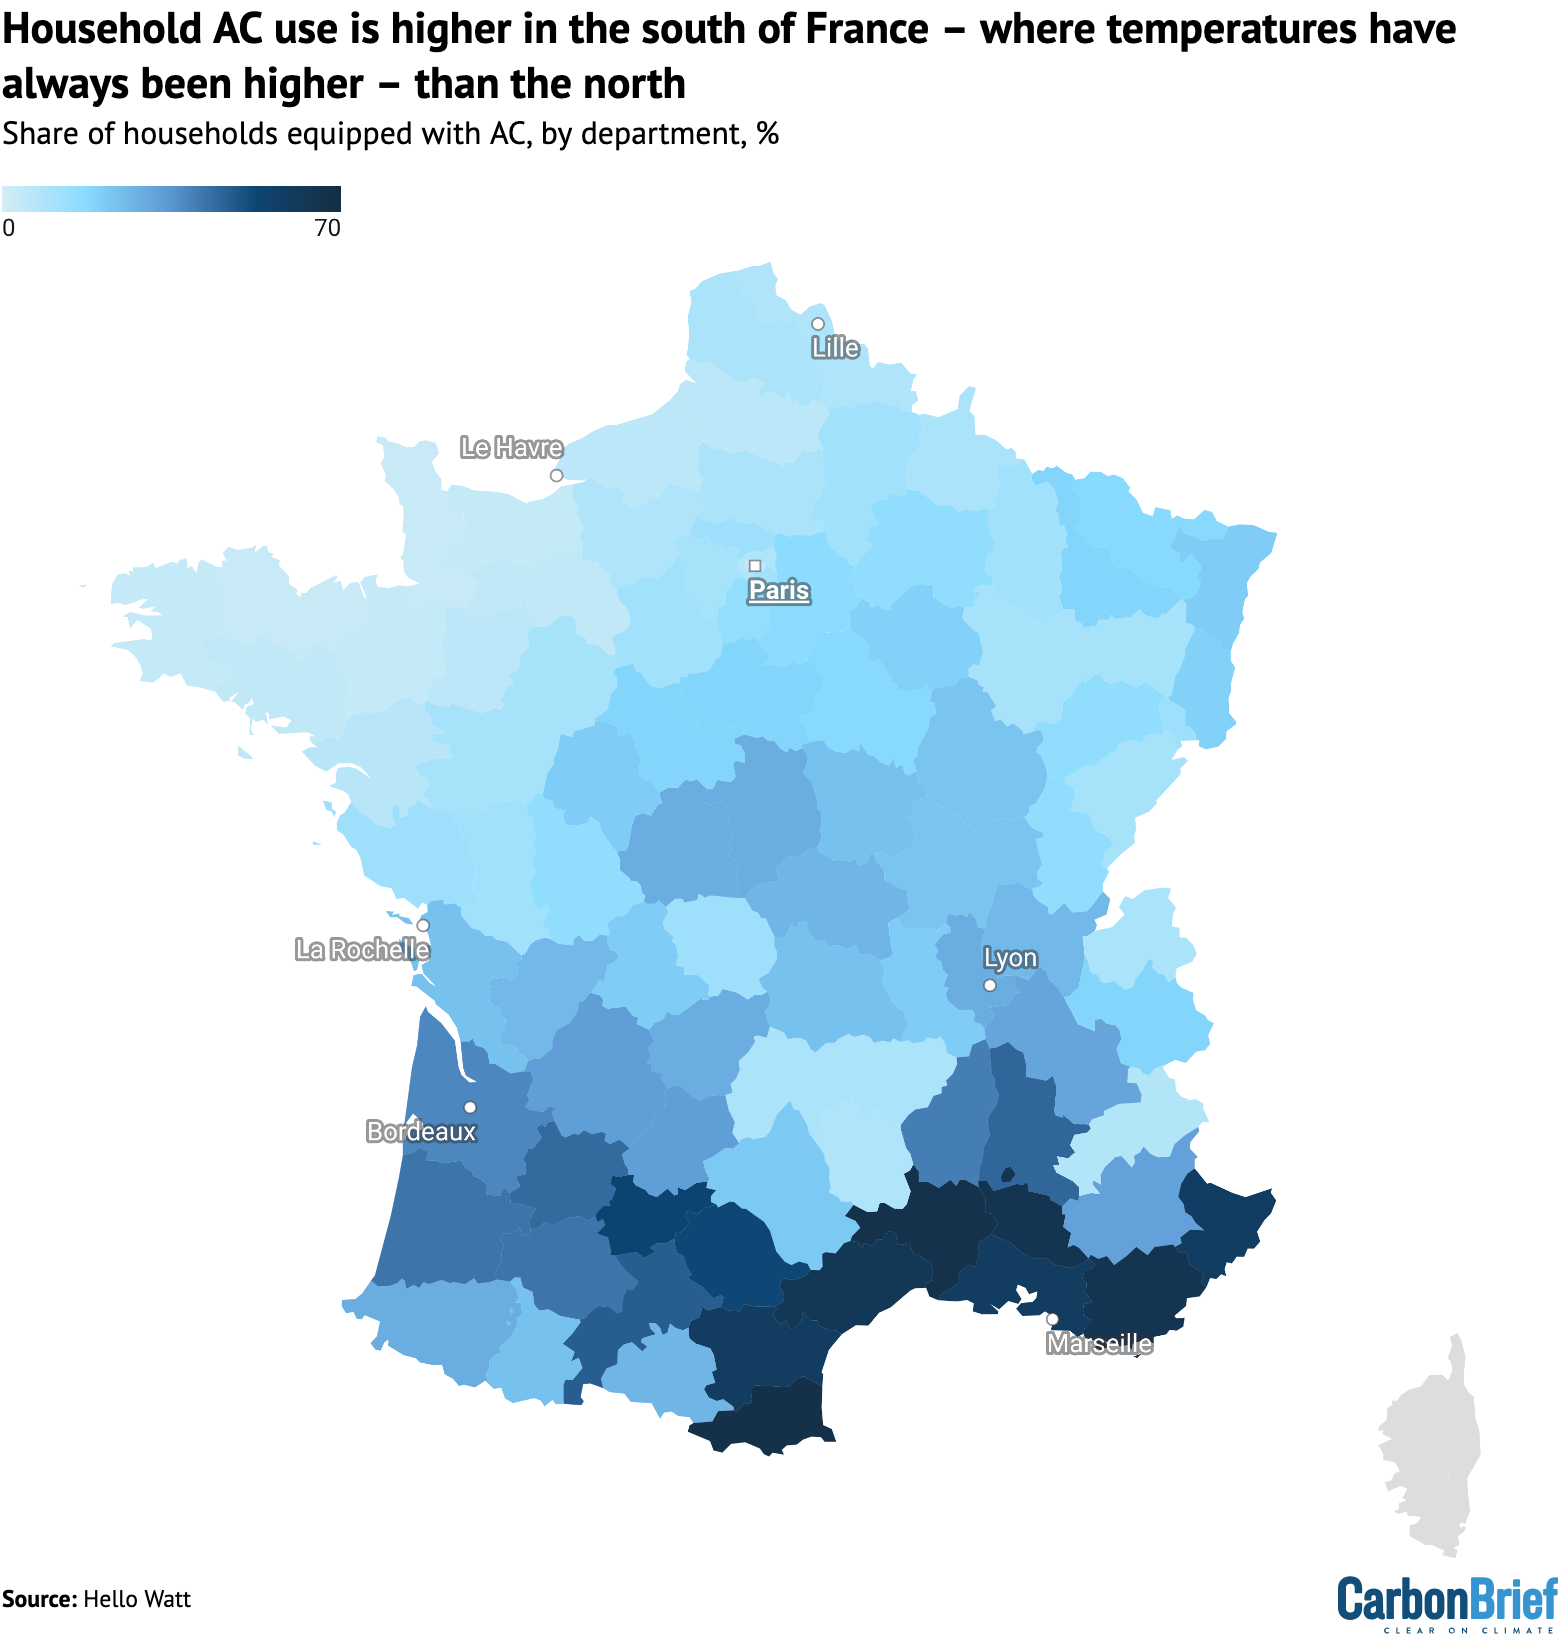
The same pattern can be seen within France. International coverage has stressed the country’s “cultural resistance to AC”, citing a nationwide figure from 2020 that suggests “only” 25% of French households have AC.
However, polling data from customers of the Hello Watt energy app suggests that there is a distinct north-south divide in French uptake. At least 60% of households in Mediterranean regions of France are equipped with AC, according to these figures.
This can be seen in the map below, with households across northern regions, including Paris, reporting far lower AC installation rates, often below 5%.
Finally, when making such comparisons to Europe, it is worth noting that high rates of AC use reported for the entire US also obscure significant differences between – and within – US states. This, too, aligns with differences in regional climate.
Hotter states in the US south have near-universal AC access. But in Washington, a north-western state with a climate more comparable to that of western Europe, 66% of people have AC in their homes.
Some European nations have ‘resisted’ AC – but its popularity is growing
International commentators have written extensively about Europe’s “longstanding resistance to cooling technology”, especially when compared to the US.
Newspaper editorials in the Washington Post and the Wall Street Journal, alongside numerous op-eds and blog posts, have added fuel to this “culture war”. Elon Musk has even promoted an AI-generated message stating that Europeans “should just install AC”.
Often, European attitudes are attributed to “guilt” about AC’s energy demand, “cultural conservatism” or “overbearing governments”. One commentator ascribed divergent attitudes in Europe and the US to “different ideas about physical suffering and sacrifice”.
Meanwhile, right-leaning commentators and climate-sceptic groups have blamed “climate policies, which view AC as an unnecessary luxury”.
In general, these critiques often fail to consider the most obvious explanation, which is that AC adoption is low in northern Europe because the historical climate made AC unnecessary.
Critical articles have instead drawn attention to restrictions on AC use in some European countries, as well as the lack of support for AC in official heatwave guidance.
For France, in particular, polling has indeed highlighted widespread disapproval of AC, both on environmental grounds and due to alleged health impacts. Such messages have also been voiced regularly in French media and by left-leaning and green politicians.
However, across Europe there are plenty of signs that such attitudes are shifting, following successive spells of extreme heat.
Amid the June heatwave, there were reports from Germany, France and the UK of “skyrocketing” AC sales. This surge was even acknowledged by the foreign ministry in China, due to the nation’s role in supplying many of these products.
The shift is taking place in politics as well. Marine Tondelier, leader of the French Green party – which has traditionally opposed AC – recently stated that “there are places where we just can’t do without AC anymore”.
Overall, AC has been on the rise across Europe, with France, Spain and the Netherlands all using more than twice as much energy for AC and other “space cooling” technologies in 2024 as they did in 2015.
AC production in Germany has also risen by at least 75% in recent years and a growing share of German homes are being built with it installed.
Notably, there is little evidence that “climate policies” are blocking Europeans from installing AC. Polling in Germany shows that, while people are concerned about environmental impacts, the high costs of installing and running it are perceived as greater barriers.
Finally, there is an important distinction between individual AC units in people’s homes and installing them in public spaces, such as hospitals, care homes and schools.
While neither is widespread in France, support for the latter can increasingly be found across the political spectrum, from Greens to the far-right National Rally (RN).
AC emissions are growing, but its climate impact could be limited
Some people have noted that a wider rollout of AC in Europe could drive up emissions.
As noted in the Financial Times by columnist and chief data reporter John Burn-Murdoch, there is a logic to this argument, “at least superficially”. He writes:
“AC uses a lot of energy; if the proposed defence against emissions-driven global warming means emitting more, then we have an obvious problem.”
The emissions impact of AC depends heavily on the generation mix of a country’s power sector.
According to the International Energy Agency (IEA), “space cooling” – mostly AC, but this does include some fans – used 2,100 terawatt-hours (TWh) of power globally in 2022.
As such, it was responsible for 1bn tonnes of carbon dioxide (CO2) from electricity use globally. This equates to around 2.7% of total CO2 emissions globally from fossil fuels and industry.
(As well as indirect emissions through power use, AC units can also directly release greenhouse gases – used as AC refrigerants – when they leak or are improperly disposed of. Following the 2016 Kigali Amendment, countries are progressively trying to phase down the use of potent greenhouse gases in AC units.)
In a LinkedIn post, Lauri Myllyvirta, lead analyst at the Centre for Research on Energy and Clean Air and regular Carbon Brief contributor, says:
“There is a lot of alarmist messaging about how much electricity AC uses. However, on an annual basis, the demand is not that substantial. Currently, AC uses about 1% of electricity in the EU and catching up to adoption rates in the US would double this.”
According to the IEA estimates from 2018, “if left unchecked, energy demand from AC will more than triple by 2050”, reaching 6,200TWh of power.
By mid-century, households would contribute the most to the increase (70%), with at least two-thirds of the world’s households potentially having AC, according to the Paris-based agency.
Decarbonising electricity grids and energy-efficiency improvements can reduce AC emissions and their impact on climate.
For instance, in countries with a low-carbon electricity mix – such as France, where nuclear energy accounts for 67% of its electricity generation – expanding AC would have a more limited climate impact than in other countries.
In countries such as India, there could be a more significant increase in emissions as AC is adopted, due to the role coal plays in the country’s energy mix, especially during the night. Demand is growing fast – following low access historically – and many AC units are inefficient, with high electricity use.
According to a new working paper from the India Energy and Climate Center (IECC) at the University of California, Berkeley, “room AC” – portable plug-in units, as opposed to those permanently installed in buildings – already accounts for nearly one-quarter of India’s peak electricity demand (60-70GW) – and this is before the majority of Indian households have bought their first AC unit.
Dr Nikit Abhyankar, co-faculty director of the IECC, tells Carbon Brief that, as AC use is expanded across the world, it should be paired with solar and battery storage, where the “economics have completely shifted” in the last few years. This will help to cut both energy bills and emissions.
According to the IEA, accelerating energy efficiency improvements could deliver more than one-third of all CO2 emission reductions between now and 2030.
The global energy demand needed to run ACs alone in 2050 could be reduced by 1,300GW – the equivalent of all of China and India’s coal plants – through energy efficiency measures, it estimates.
Aditya Valiathan Pillai, a climate adaptation researcher at King’s College London, tells Carbon Brief that, as the use of AC expands, there is a conversation to be had about where and “what type of technology [is used] and who gets access” to it.
A final point is that many AC units are air-to-air heat pumps, which can efficiently heat homes, as well as keeping them cool. As such, wider AC adoption could boost the adoption of electrified heat, helping to cut emissions from gas boilers.
Heat from AC can contribute to directly warming cities
Some critics of AC mention its electricity demands and associated CO2 emissions from fossil-fuel combustion, which contribute to raising the temperature of the entire planet. (See: AC emissions are growing, but its climate impact could be limited.)
But AC also has a localised impact. It works by removing heat from indoor air and pushing it outdoors, raising temperatures on the street and exacerbating the “urban heat island” effect.
Left-leaning French politicians are among those citing this as an argument against AC, particularly in cities. Indeed, Emmanuel Grégoire, the Socialist mayor of Paris, appeared to be making this point in an interview with Le Monde, during the June heatwave:
“[AC] can be useful for cooling collective spaces and protecting the most vulnerable populations, but individual AC is a scourge – it makes the problem worse by heating the city even more.”
One study concludes that, in a city such as Phoenix, Arizona, where the technology is widespread, AC use during a heatwave can raise night-time temperatures by 1-1.5C.
Another models a nine-day heatwave in Paris – in a future with “massive” AC use – and finds an increase in external temperature of more than 2C, due to heat emitted by the units.
Given this, some scientists argue that AC can be a form of climate “maladaptation” – referring to actions that backfire and make people more vulnerable to global warming.
The Intergovernmental Panel on Climate Change (IPCC) has highlighted this issue, concluding:
“AC may constitute a maladaptation because of its high demands on energy and associated heat emissions, especially in high-density cities.”
Compared to the US, more people in Europe live in dense, urban areas. According to Dr Vincent Viguié, a climate change economist at École des Ponts ParisTech, this could leave Europeans more exposed to heat from AC units. He tells Carbon Brief:
“If you live in a neighbourhood that is not dense, like in a suburban neighbourhood or in the countryside, you don’t care about this…So, once again, there is a key difference between US and European cities.”
Viguié is among the experts arguing that other climate-adaptation measures should be considered alongside AC, to keep entire cities cool – not just individual homes. He says:
“It’s not to say that the heat released by AC by itself is a reason to forbid AC…It’s just that not taking that into account may lead to bad decisions.”
More AC could help to reduce heat deaths in Europe
Heatwaves can be deadly, especially for older or vulnerable members of society.
According to climate scientists at World Weather Attribution, “heatwaves cause more deaths in Europe than all other natural hazards combined”.
The heatwave in June 2026 is estimated to have killed more than 20,000 people in Europe. In France – which has seen some of the hottest temperatures – the heatwave caused more than 2,700 heat-related deaths, according to analysis published by Carbon Brief.
AC does help to protect people from the effects of extreme heat. A 2021 study found that globally, AC averted an estimated 190,000 heat-related deaths annually during 2019-21.
With its much higher penetration of AC, the US has fewer deaths due to extreme heat than Europe.
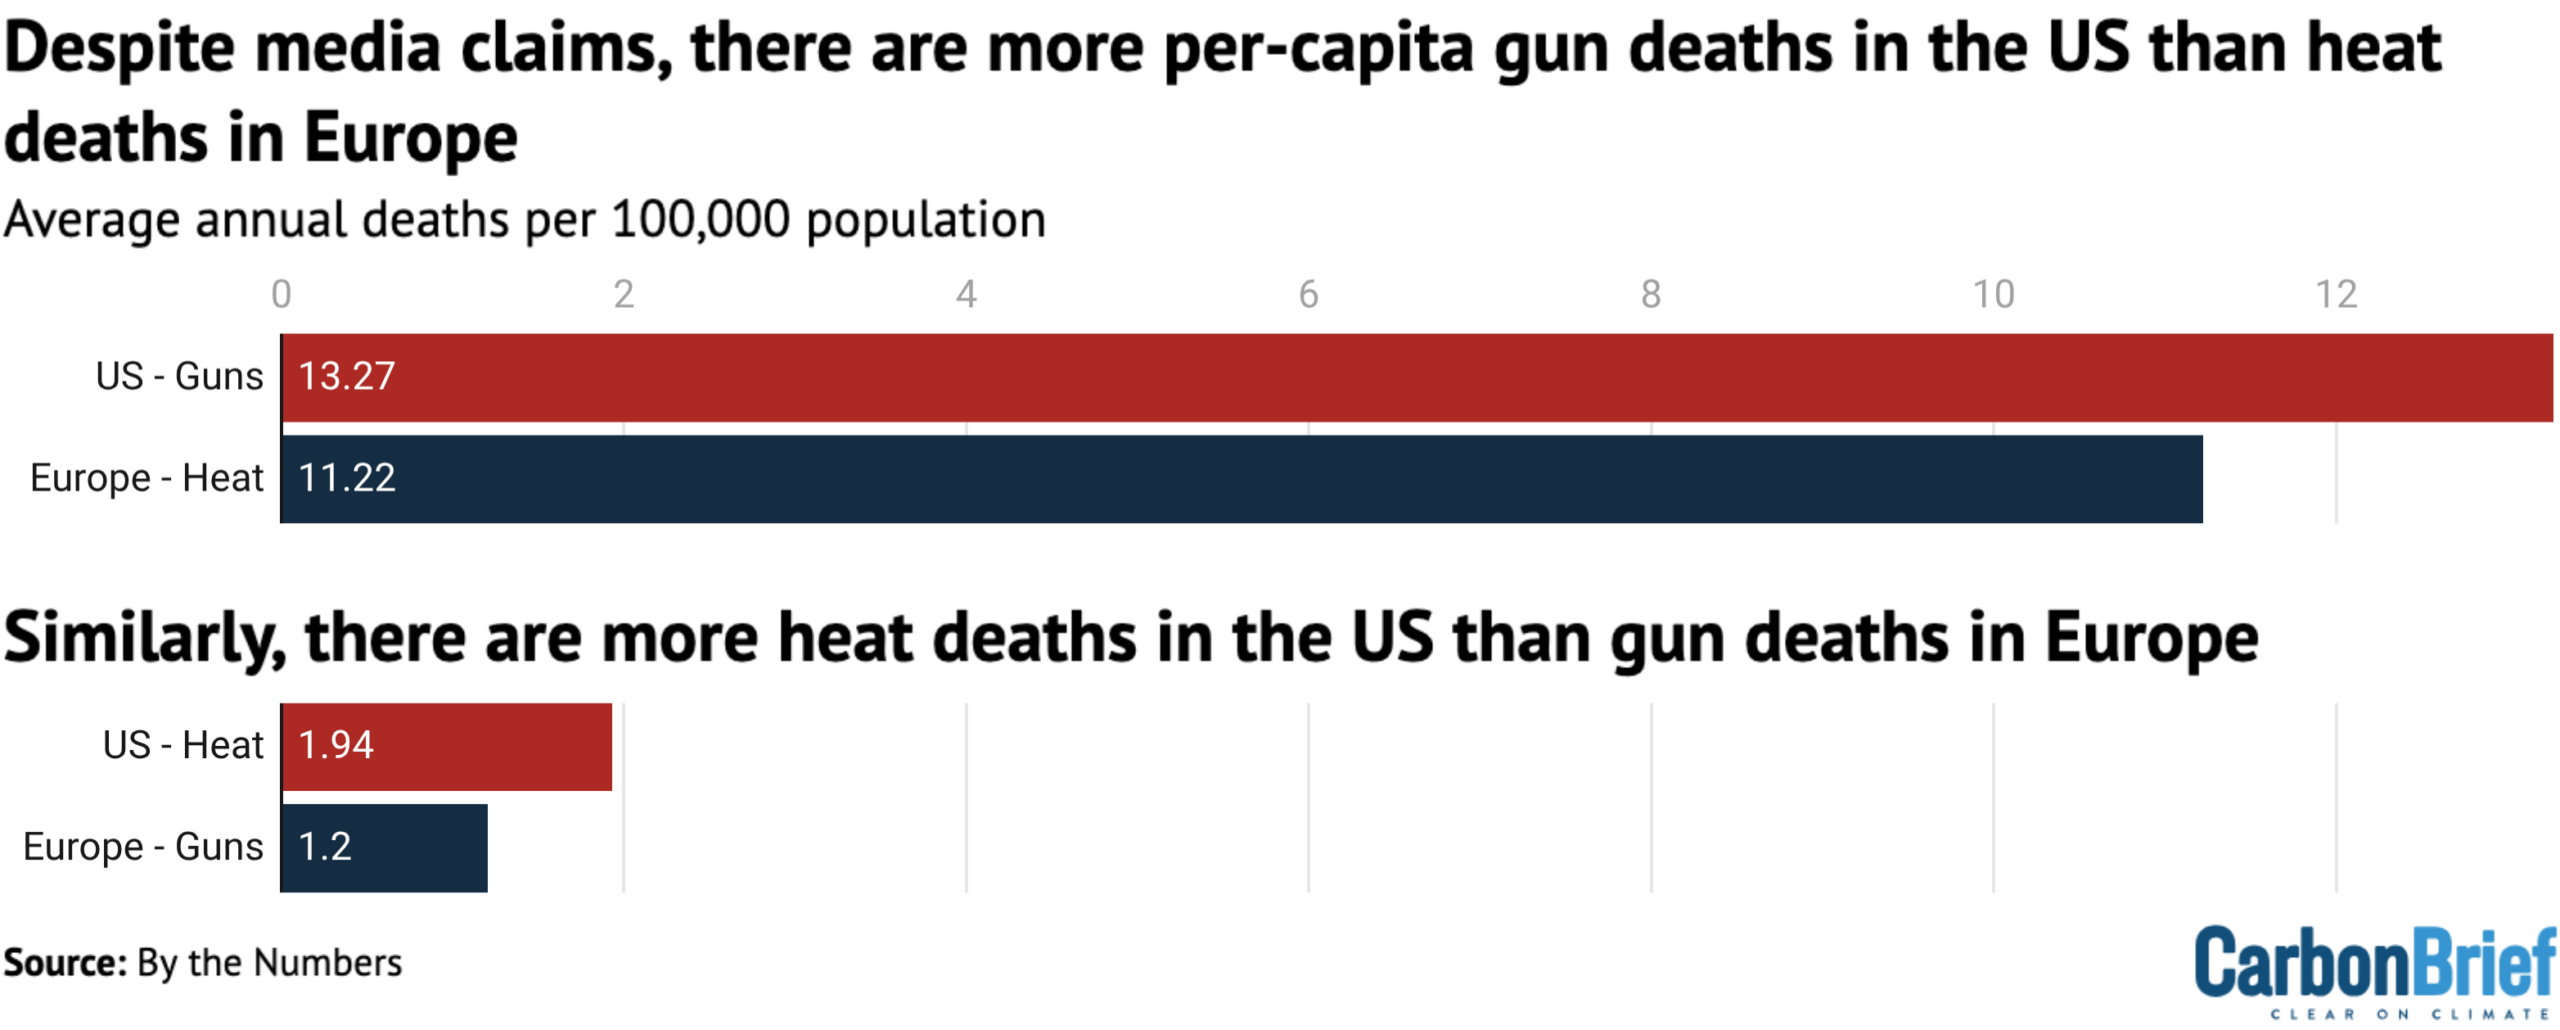
Heat kills around 11 people out of every 100,000 in Europe, compared to around two people in the US, according to analysis by data scientist Dr Hannah Ritchie from Our World in Data.
Several publications have pointed out that “Europe’s heatwaves are deadlier than American gun violence”. While this is technically accurate in absolute terms, Ritchie says the comparison is “a bit silly” for a number of reasons, not least because on a per-capita basis, US gun deaths are higher.
However, experts suggest that AC is only one part of a wider effort to protect people from extreme heat.
A 2020 study looking at heat-related mortality in Canada, Japan, Spain and the US, found that excess deaths due to heat decreased between 1972 and 2009.
For example, the proportion of deaths due to extreme heat fell from 1.7% to 0.5% over the period in the US and 3.5% to 2.8% in Spain.
However, an increase in AC only explained 16.7% of the drop in the US and 14.3% in Spain.
The research concludes that “other factors have played an equal or more important role in increasing the resilience of populations”. This is supported by research that shows changes to cities, such as planting more trees, as well as behavioural shifts and public-health measures, can all protect people from dangerous heat.
Additionally, across Europe there is already a range of policies and measures in place to protect the most vulnerable from heatwaves. Many of these were brought in following the unprecedented summer of 2003, when 70,000 died from extreme heat.
These policies were highlighted by French environment minister Agnès Pannier-Runacher, in response to the far-right National Rally (RN) party’s AC proposals:
“The incompetent RN has just found out that nursing homes need air-conditioned rooms. Thank you, but it’s actually been mandatory since 2004.”
Another study found that measures that have already been rolled out in France would cut the projected death toll of a 2003-like heatwave by more than 75%. This is in part due to the expansion of AC in places such as nursing homes, but also other approaches, such as heat action plans.
For example, France has a multi-tiered action plan, which includes local governments ensuring access to cooled spaces and water, keeping a list of vulnerable individuals for targeted interventions, as well as national information campaigns.
According to the UN’s office for disaster risk reduction, this French plan has led to a “significant reduction in heat-related mortality”.
While action plans have proved successful in a number of nations, less than half of European countries have such a plan in place.
‘Net-zero rules’ are not blocking AC installation in the UK
In the UK, Conservative politicians and right-leaning media have tried to pit the adoption of AC against net-zero policy.
Writing in the climate-sceptic Daily Telegraph, columnist Matthew Lynn claimed falsely:
“Strict net-zero rules now mean that aircon is effectively banned in the UK.”
(Further down the article, he concedes: “AC is not strictly speaking banned in new-build homes in the UK. But tough environmental rules mean that it is very hard, and expensive, to install in practice.”)
The same narrative has been used in articles by GB News, the Sun and others. A separate article in the Daily Telegraph’s “money” section goes further, claiming that AC had been “torn from homes under net-zero clampdown”.
A blog post from the Ministry of Housing, Communities and Local Government rebuts these claims, stating:
“There has been media coverage this week suggesting that AC is banned in homes. This is incorrect.”
For the UK, while it is true that fewer than 5% of homes currently have AC, this is largely due to the fact that it was not hot enough in the past to warrant the expense. Historically, the focus has therefore been on keeping buildings warm, rather than cool.
Extreme heat has previously been rare in the country, so homes were built with insulation and other measures to keep heat in during the “dank winters”. (See: Much of Europe has not needed AC in the past.)
Current regulations do not ban the installation of AC outright. However – as the government’s blog post notes – there is no blanket rule, meaning there are some localised differences.
Certain areas – or certain kinds of properties – may be subject to additional complications for installing AC.
In a 2025 video on Instagram, shadow secretary of state for energy security and net-zero Claire Coutinho referenced the London plan, for example, which is a framework for development in the capital launched in 2021. She said:
“[London mayor] Sadiq Khan says no. The London plan says we shouldn’t have air con because it uses too much energy. But this is mad! This is a poverty mindset that we need to get away from.”
The London Plan does not stop homes from having AC. It simply says that, for new buildings, passive design measures should be prioritised, such as the orientation of the building, the window design and incorporation of measures such as external shading and trees.
A recent response from the mayor added further measures, such as the need to “minimise the necessity for the operation of mechanical measures including AC, which would further add to the heat island effect within urban areas and add operational cost to residents”.
Elsewhere, new-build homes across England must meet the requirements of “part O” of the 2022 building regulation updates. This includes addressing overheating in buildings through energy-efficient design and prioritising passive cooling, with AC as a last resort.
For existing buildings, most AC units fall under “permitted development rights”, meaning no planning application is required to install them.
Additionally, regulations were relaxed in 2025 to make it easier to install an air-to-air heat pump – which can both heat and cool air – without planning permission.
This means that, far from blocking the expansion of AC, net-zero policy has made it easier to install specific cooling systems.
Speaking to Carbon Brief, Andrew Sissons, director of sustainable future at Nesta, says the government must now implement its announced £2,500 subsidy for air-to-air heat pumps “as quickly as possible”, to further ensure that the technology can be rolled out efficiently. He adds:
“[The government] should also continue to expand permitted development rights for air-to-air heat pumps, with a particular focus on flats and homes in denser areas. As long as heat pumps meet the MCS [Microgeneration Certification Scheme] noise test, there are few reasons to limit their use via the planning system.”
Some properties, such as large homes, listed buildings or those in conservation areas, may still require planning permission to install an air-to-air heat pump or other AC. Sissons notes that this can add cost and delay to installation.
While it cannot be said that AC has been blocked or banned due to net-zero, neither has it been prioritised.
This may shift as temperatures continue to rise. UK government advisors at the Climate Change Committee (CCC) suggest that 22% of the UK’s housing stock will likely need active cooling, such as AC, to cope with 2C of global warming.
The CCC’s recent adaptation report also calls for all new homes to be built using low-cost, passive cooling measures, alongside more AC.
Active cooling such as AC is more likely to be needed for retrofitting existing homes, the report adds.
AC is not the only answer to overheating cities
AC has become increasingly politicised in Europe, as demonstrated by France’s RN party announcing its “grand plan for AC” in all public buildings.
As noted by Dutch MEP Gerben-Jan Gerbrandy, this “far-right” embrace of AC is coming from the same people who for years have “delayed emissions reductions”.
In response, left-leaning policymakers in Europe have frequently downplayed the role of AC, prioritising programmes of urban greening and retrofitting older buildings.
Such approaches for dealing with extreme heat have already proved successful. Therefore, many experts argue that these methods, alongside AC, will be essential to prepare for a hotter world.
According to the IPCC’s sixth assessment report, adaptive infrastructure, such as urban forests and green roofs, can reduce energy use because of cooling, with co-benefits for climate, air quality, physical and mental health.
While retrofitting older buildings for heat as well as insulating them from the cold might prove challenging, urban greening and an active shade policy – one that determines how much of every street is exposed to direct sunlight – are simple measures cities can adopt.
Some experts have also warned about the high cost of running AC, expressing concerns that excessive reliance on the technology could increase energy poverty.
In a Carbon Brief guest post published in 2025, researchers at the Basque Centre for Climate Change found that framing AC as the “default solution” can miss the opportunity to design “more inclusive, human-centred responses” to rising temperatures.
William Lewis, a PhD candidate and one of the guest post’s authors, tells Carbon Brief it is not a case of “one or the other”, when considering AC and other options:
“We have this opportunity in European countries to choose a slightly different path [from the US], which isn’t AC in every single home.”
King’s College London’s Pillai says that, by centring the debate on AC, the far-right response to the heatwaves in Europe has “completely neglected the science of how you cool human beings”.
There are many solutions, he adds, that are already widely used across hot developing countries, such as ceiling fans, windows that open and cross-ventilation, as well as strategies to reduce cumulative hours of heat exposure.
Pillai tells Carbon Brief that, while places reaching 42C and higher “definitely need to think about AC very seriously”, places in the “low to mid 30Cs” could rely on these alternatives.
Behavioural change, he adds, is the “least glamorous part” of heat policy, but “pulls most of the weight” of protecting people. These include a wide range of actions and responses – from reducing heat exposure, to wearing lighter clothing and drinking more water and fluids.
There are also workplace protections. Pillai tells Carbon Brief that these could include legislation on mandatory work breaks, cooling and shade requirements at workplaces, as well as health insurance that covers heat stress days that have been lost by heat-exposed workers.
The post Eight facts about air conditioning amid an overheated global debate appeared first on Carbon Brief.
Eight facts about air conditioning amid an overheated global debate
Climate Change
Furry Little Peach x Greenpeace
What happens when a love of marine life meets a playful imagination?
Sydney artist, illustrator and children’s author Sha’an d’Anthes, better known as Furry Little Peach, has teamed up with Greenpeace to create Happy Ocean Happy Planet: a joyful celebration of the extraordinary creatures that call our oceans home.
Sha’an felt inspired to create an illustration celebrating the beauty and resilience of marine life. Its hopeful message, A Happy Ocean is a Happy Planet, sparked a special collaboration with Greenpeace and a limited-edition t-shirt designed to help protect the oceans that inspired it.
The exclusive Furry Little Peach tee is available as a gift to new regular Greenpeace donors who give $30 or more and make at least three donations. By becoming a regular giver, you’ll help Greenpeace campaign for ocean protection.

ARTIST INTERVIEW: Sha’an d’Anthes (Furry Little Peach)
Sha’an shares the story behind the artwork, the local marine creatures featured in the design and why hope can be such a powerful force for action.
Hi Sha’an! Can you tell us a little about yourself and what you do?
My name is Sha’an d’Anthes, I also go by the pseudonym Furry Little Peach and I’m an illustrator, artist and children’s author based in Sydney, Australia. I love creating joyful, vibrant and nostalgic art that looks at the world through the lens of childlike wonder.

What do you love about drawing animals and nature?
I love all of the different shapes, colour and narrative you get to explore when drawing animals and nature. I’m also a city-slicker these days, and so I think that my work is a sort of escapism (for myself and hopefully for my audience).
How did the Greenpeace collaboration come about?
I went to the premiere of David Attenborough’s documentary Ocean, and felt compelled to create something to share the message of the film. This t-shirt is actually based off of that illustration including the tagline in I included when I shared it “A Happy Ocean is a Happy Planet”. I’m so grateful Greenpeace approached me for the project – it was a blast.
Where did you start when creating the Happy Ocean Happy Planet design?
The Happy Ocean tee starts the same as all of my work – with a brainstorm/braindump and really loose concept sketches.
How did you choose the animals for the illustration?
I actually asked Greenpeace to help me with the research of local marine life and they were so accommodating. They very quickly delivered me a huge list of local species of fish, mammals and coral and I just went through and looked up each creature and curated a little group of sea life that I thought would look sweet together – a mix of sizes, types, colours, textures and shapes.
What did you use to create the artwork?
So much of my work is traditional, but when it comes to things like t-shirts I always use digital drawing programs because I like to draw each colour in a separate layer which requires me to jump in and out of layers because it allows me to control colour and printing. When working digitally I always sketch in Procreate (an Australian digital art app), and then with this project I created final art in Adobe Fresco because it called for a vector graphic (an image that can be blown up to any size).
Do you have a favourite creature in the design?
I love painting Humpback Whales and always have, but I also have a soft spot for the sweet little Jelly Blubber jellyfish.
What did you want people to feel when they saw the artwork?
I specifically wanted to focus on the outcome that all of us want to see – a happy, thriving ocean where creatures are given the time and space to balance themselves. I feel that even when tackling tough subjects, leaning into hope is my natural inclination. As long as we have hope that things can be better, we will continue to take action.
What was the most fun part of creating it?
I actually documented the entire process of this project in a studio vlog on YouTube – and you can see how much fun I’m having doing final art jumping between layers and building the image. I had just come off completing final art for two books which are multi-year long projects, so being able to do a project that from start to finish in just a few days was really freeing at the time.
What does a “happy ocean” mean to you?
An ocean that given the time and space to repair and balance itself. Something I really took away from David Attenborough’s Ocean is that ocean ecosystems are actually really good at repairing themselves if we just let them do their thing.
How can people get their hands on the t-shirt?
The shirt is a reward for regular givers to Greenpeace – those who commit to at least 3 months of donations will receive the tee as a gift. Read about how at http://act.gp/flp-tee
How is Greenpeace helping to make our oceans happier places?
They have a deep focus on the health and happiness of our oceans through advocating for the set up of marine sanctuaries, holding big ocean polluters to account and calling for a ban on deep sea mining.
What are you working on next?
I will be jumping headfirst into Peachtober – an annual daily art challenge I run each year in October, if there are any artists reading this it’s a great time so please come join! In terms of publications my next picture book The Late Bird will be out in February 2027 (published by Harper Collins US) and then I have an creative activity book for adults coming out next August with Chronicle US and Penguin Australia. Otherwise you can always check out what I’m tinkering away with in my studio on Instagram and YouTube.

Climate Change
AI giant Anthropic’s first Australian data centre deal an “egregious” example of Big Tech double talk
SYDNEY, Thursday 17 September 2026 — Greenpeace Australia Pacific has slammed AI giant Anthropic’s deal for its first Australian site in Queensland’s Western Downs, the heart of coal seam gas country, saying the project will entrench gas and turbocharge climate pollution.
The expected electricity demand from the data centre site, situated in the middle of the Western Downs coal seam gas fields, is comparable to 1.5 million Australian households. Greenpeace’s report Energy Vampires: The AI data centres draining Australia called for a moratorium on frenzied data centre development until appropriate guardrails are in place.
Joe Rafalowicz, Head of Climate and Energy at Greenpeace Australia Pacific, said: “This is an egregious example of Big Tech giants being given carte blanche to drain energy and water, and use polluting gas to fuel their hyperscale data centres.
“AI and Big Tech corporations claim to bring new renewable energy to the grid, while blatantly planning to power their operations with polluting fossil fuels.
“Planning documents show the first stage of this behemoth project could be powered by ‘behind the metre’ gas — the same playbook AI companies have used in the US, leading to a 20% increase in climate pollution from electricity. Now these companies want to bring their cowboy plans to Australia and the Federal Government is allowing it.
“If they plugged into the local grid, the power required would increase Queensland’s electricity grid emissions by around 6.6 million tonnes — an 18% rise. If they build their own gas-fired power plants, this will drive up Queensland’s emissions even more.
“Billions of dollars are now pouring into a massive pipeline of proposed new data centres, of unprecedented size, being built at incredible speed across the country. Australians should be worried about the extreme lack of scrutiny being applied to these projects, and the corporations leading the data centre charge.
“The data centre build-out is happening without the endorsement of the Australian people, yet we are the ones who will pay the price. We can not allow unchecked data centre expansion to derail our renewable energy transition, entrench gas and turbocharge climate pollution — that’s why Greenpeace has called for an urgent moratorium until appropriate guardrails are in place.”
ENDS
Media contact: Kate O’Callaghan on 0406 231 892 or kate.ocallaghan@greenpeace.org
Climate Change
Analysis: India’s power-sector emissions flat for two years due to clean-energy surge
A surge in clean energy has kept carbon dioxide (CO2) emissions in check across India’s power sector, with no growth from the first half of 2024 to the same period in 2026.
This guest post is by:
Lauri Myllyvirta, lead analyst at Centre for Research on Energy and Clean Air (CREA)
Anubha Aggarwal, India analyst at CREA
This is the first time in more than 50 years that there has been no growth in India’s coal power over a two-year period, even as electricity demand grew overall.
At the same time, both oil and gas consumption have fallen across the nation for two years in a row, helping alleviate the shock of the Hormuz crisis.
Nevertheless, the new six-monthly analysis for Carbon Brief shows that India’s emissions grew by 3.7% year-on-year in the first half of 2026, due to increases from steel, cement and other sectors.
Other key findings for the first half of 2026 include:
- India’s power-sector emissions flatlined at 2024 levels, after a 2.2% decline in the first half of 2025 and a 2.3% rise in the same period this year.
- Clean energy met all of the 7% rise in India’s electricity demand over the two years, adding 63 terawatt hours (TWh), equivalent to the total demand of Switzerland.
- India has added 77 gigawatts (GW) of solar in this two-year period, helping meet 60% of the rise in electricity demand overall.
- While fossil-fuel generation stagnated, generators added 8.5GW of new coal capacity, leading to fewer running hours and increased costs to electricity consumers.
- CO2 emissions from oil and gas fell by 7% year-on-year, extending a reduction that began in 2025, despite higher demand for road transport fuels.
- Steel and cement emissions grew by 8% year-on-year, reaching a 23% share of India’s total CO2 in the first half of 2026.
If the pace of India’s clean-energy expansion is to continue, it will need to upgrade its electricity grid, rapidly build out energy storage and boost the flexibility of coal power.
While clean-energy expansion is covering most or all of India’s power-demand growth, the fossil-fuel industry continues to pursue major capital investments.
This includes large amounts of new coal-power capacity, ambitious plans for the conversion of coal-to-chemicals and efforts to boost domestic coking coal production for the steel sector.
While CO2 output from the power sector is flat, with oil and gas in decline, India’s emissions still went up due to the contribution from industry.
India lags behind its competitors – including most large emerging economies – when it comes to electrifying its industrial sector.
Faster progress would enable clean electricity to substitute for fossil fuels in industry, as well as for power, offering the potential for India to cut its emissions overall.
Flatlining fossils
Last year, India’s CO2 emissions from fossil fuels and cement grew at their slowest pace in two decades, according to previous analysis for Carbon Brief.
This sharp slowdown was due to rapid clean-energy growth and flat oil demand, combined with rising emissions from steel and cement.
The first half of 2026 marks a continuation of these trends.
Most strikingly, the ongoing surge in clean-energy generation means that emissions have flatlined in India’s power sector for two years, as shown in the figure below.
Power-sector CO2 was the same in the first half of 2026 as two years earlier, with a small decline in 2025 having been reversed over the same period this year.
Beyond electricity generation, India’s key emitting sectors continued to see divergent trends in the first half of 2026, as some saw ongoing decline while others reached new heights.
This is shown in the figure below, which compares year-on-year changes in emissions during the first half of 2026 with the same periods in 2025, 2024 and the average for 2021-23.
Specifically, emissions grew by 2.3% in the power sector, reversing last year’s decline, while demand for gas and oil products fell for another year.
The biggest increases were for steel and cement, where emissions growth accelerated to 8% year-on-year in the first half of 2026, well above the recent trend.

Clean-energy growth matches power demand
The period from the first half of 2024 to the first half of 2026 saw the largest increase in non-fossil power generation on record in India.
This enabled fossil-fuel consumption and CO2 emissions from the sector to stay flat, even as electricity consumption increased.
Indeed, this is the first time in more than 50 years that there has been no growth in coal power over a two-year period, even as electricity demand grew overall, as shown below.

Over this two-year period, India’s total power generation increased by 7%, some 63TWh, equal to the total consumption of Singapore or Switzerland.
The additional power requirement of 63TWh was met entirely by clean energy. Solar grew by 44TWh, alongside growth from wind (13TWh), nuclear (7TWh) and hydro (8TWh).
Together, clean-energy sources added 70TWh over two years, more than the net increase in demand.
(For comparison, China’s nuclear, wind and solar output increased by 485TWh in 2025.)
The figure below shows that new investments are more than sufficient to maintain this trend, as added power generation from new clean power capacity has stayed above average demand growth for the past 18 months.

Over the past two years, India added 77GW of new solar capacity, 11GW of wind, 5GW of hydro and 0.6GW of nuclear capacity.
Solar power continues to dominate clean-energy growth, but, collectively, the other non-fossil sources still contributed 40% of the overall increase in generation.
One factor in electricity demand growth in 2026 is the El Niño, which delayed the monsoon and intensified heatwaves, driving up cooling demand.
India is accelerating investment in energy storage, which will support further growth in clean power. The National Electricity Plan projected a requirement of 82 gigawatt-hours (GWh) of energy storage capacity by 2026-27 and 411GWh by 2031-32.
As of May 2026, the government has issued tenders for around 272GWh of energy storage capacity, including 142GWh of pumped hydro and 133GWh of battery storage systems. Current capacity is 7.5GWh of battery storage and around 60GWh of pumped hydro.
Which states led the clean-power shift?
The fall in power generation from fossil fuels from the first half of 2024 to the same period in 2026 was concentrated in a few states.
Gujarat saw both the largest reduction in fossil-fuel generation and the largest expansion in clean power, as shown in the figure below.

After Gujarat, the largest increases in clean-power generation were seen in Rajasthan and Tamil Nadu, which also saw reductions in power generation from fossil fuels.
Several other states saw declines in fossil-fuel generation due to higher net imports, rather than local clean power. These included Madhya Pradesh, West Bengal and Punjab.
Karnataka and Andhra Pradesh also succeeded in increasing clean-power generation faster than power demand, thereby contributing to keeping fossil fuel-based power generation stable nationwide across the two-year period. However, they exported much of the increase and consequently saw local increases in power generation from fossil fuels.
The two states with the largest increases in power demand, Maharashtra and Telangana, managed to almost match the rise with growth in clean-power generation.
Fall in oil and gas consumption continues
India’s oil consumption continued to fall during the first half of 2026, dropping 1.3% year-on-year, a slight acceleration from the 0.7% reduction in the same period last year.
While diesel and petrol consumption continued to grow, oil consumption was pulled down overall by declines in liquefied petroleum gas (LPG), petcoke (a solid derivative of oil used in the cement industry) and industrial feedstocks. Growth of aviation fuel use eased.
Diesel consumption growth accelerated from 1.8% to 4.1% in the first half of the year, supported by higher freight movement and increased agricultural demand, as the delayed monsoon led to greater use of diesel-powered irrigation.
Petrol consumption returned to growth, increasing 6.9% year-on-year after zero growth in the same period in 2025, reflecting sustained growth in passenger and two-wheeler mobility.
A significant increase in ethanol blending shaved a full percentage point off the growth of petrol consumption. India achieved its 20% ethanol blending target five years ahead of schedule in 2025-26. (Ethanol blending has faced public opposition.)
Electric vehicle (EV) adoption in India is also gaining momentum, with EVs adopted in a widening range of categories.
In Delhi, an EV policy was launched to accelerate electrification of the vehicle fleet, with a particular focus on two-wheelers, three-wheelers (auto rickshaws), commercial vehicles and high-mileage segments, alongside expanded charging infrastructure. Higher EV adoption rates will moderate the growth in emissions from petrol consumption in India.
In contrast, aviation fuel demand growth slowed down from 5% to 2%. The slowdown coincided with the strait of Hormuz and wider crisis, which disrupted international aviation through temporary airspace closures and flight cancellations to several Middle Eastern destinations. Elevated aviation fuel prices also increased airline operating costs, contributing to lower fuel demand.
LPG consumption contracted by 7%, after 5.7% growth in the same period last year, amid disruptions in global LPG markets following the Hormuz crisis.
Petcoke consumption fell 9.9%, more than reversing a 9.3% increase in the same period last year. Rising petcoke prices encouraged cement manufacturers to switch to coal.
Consumption of other petroleum products continued to drop, although the pace of decline moderated from 14% in 2025 to 9% in 2026.
Industrial feedstock use was affected by shortages and price increases.
Naphtha demand contracted as import prices nearly doubled and domestic prices increased by around 60%, prompting petrochemical manufacturers to reduce operating rates and suppress demand for imported naphtha.
Bitumen consumption remained subdued due to slower road construction, driven by persistent land acquisition challenges and higher bitumen costs.
Meanwhile, higher light diesel oil (LDO) prices and shortage of LPG led some industrial consumers to switch back to furnace oil in boilers and heaters, despite the higher air pollutant emissions. Supply of fuel oil to industry increased for the same reason.
Rapid emission growth from heavy industry continues
Steel and cement output in India grew by 8% and 9%, respectively, year-on-year in the first half of 2026, despite rising input prices and weakening profitability.
The growth in steel and cement was supported in part by increased investment in India’s real estate sector, especially in the second quarter. Steel consumption growth outpaced production, implying that inventories built up last year were tapped.
Despite domestic demand growth, profit margins of Indian steel and cement manufacturers remained under pressure for much of the period due to elevated raw material costs – particularly imported coking coal – and higher freight costs stemming from the Hormuz crisis.
The pressure on prices could dampen growth. Cement prices are expected to rise to levels last seen in the 2021-22 financial year, when Russia’s decision to cut back gas exports to Europe drove a sharp increase in fossil-fuel prices.
Outside the steel, cement and power sectors, coal-consumption growth accelerated to 14% in the first half of 2026, up from 3% last year, as the LPG shortage prompted a shift to coal.
Gas shortages resulted in some additional burning of coal for cooking in March and April. The government officially authorised the hospitality industry to use coal, refuse-derived fuel pellets, biomass and kerosene for one month.
The ceramic and tile industry also requested that the government allow the use of coal gasifiers amid the gas shortage. State governments including Delhi NCR, Rajasthan, Tamil Nadu, Gujarat and Maharashtra also allowed industries to temporarily use alternative fuels, including coal.
India’s industrial energy use is dominated by fossil fuels, particularly coal. Indian industry has the second-lowest electrification rate in the G20, as shown in the figure below. The share of electricity in total energy consumption in the sector also lags the world average, in terms of both current levels and the rate of increase.

The current low rates of electricity use in Indian industry imply that there is major potential for electrification, using technologies and processes already in place in other countries.
New investments in coal
While the clean-power expansion is starting to meet most or all of India’s electricity demand growth, there are still large investment plans across the coal supply chain.
Some 43GW of coal-power capacity was under construction at the end of June. Additional coal-power capacity is seen as necessary to meet increasing peak loads, even as solar power and energy storage are already playing a role in covering daytime and evening peak demand, respectively. The expansion of energy storage will increase this contribution.
Outside the power sector, India has major ambitions to produce chemical-industry products, such as fertiliser and plastic feedstock, from coal through coal gasification, in pursuit of energy security.
The government is targeting a capacity to process 100m tonnes of coal per year in the next four years, despite the technology for coal gasification still being nascent in India. At present, the only operational use of coal gasification is at Jindal Steel Limited, which is reportedly using syngas in its steel-making process.
Meanwhile, India plans to reduce its average CO2 emissions per tonne of steel by 25% by 2025-26, mainly by reducing the share of coal-based steelmaking.
At the same time, the government is aiming to increase the use of domestic coking coal, which it notified in January this year as a “critical and strategic mineral”. Coal miners and steel companies are reportedly planning to establish additional washeries for coking coal to make it suitable for blending with imported coal for use in steel production.
India is also looking to invest in new coal mines in the near future.
These continued investments in coal gasification, domestic coking coal and new coal mining capacity could lock in coal use across industry for several decades.
Outlook for India’s emissions
Over the two-year period from the first half of 2024 to the same period in 2026, India has achieved its largest clean-energy expansion on record.
As a result, power-demand growth has been met entirely by clean electricity and CO2 emissions in the sector have flatlined.
This expansion of clean energy also allowed a reduction in fossil-fuel imports for power generation, with the use of imported coal falling 38% and the use of gas by 35%, supporting the energy security aims of the government and reducing exposure to the Hormuz shock.
In order to keep the clean-energy growth going, India would need to overcome multiple obstacles, including expansion of the electricity transmission network, improvements in grid flexibility to accommodate variable renewables and the timely completion of new projects.
For example, renewable power projects totalling 5.3GW missed completion deadlines and are having to pay penalties to the grid operator in order to retain network access.
Curtailment has emerged as an issue, particularly for projects relying on interstate power transmission, pointing to the need to upgrade the network. (Curtailment refers to electricity generation that is “wasted” because it cannot be accommodated by the power network.)
Another obstacle to be overcome if clean energy is to keep growing will be making coal-power plants more flexible, so they can ramp down during high renewable output.
A flexibility plan for coal-power plants has been delayed by more than a year due to persistent regulatory bottlenecks, contributing to the curtailment of renewable energy.
Expanding energy storage has the potential to ease grid and flexibility constraints, while reducing or eliminating the need for adding thermal-power capacity to meet peak loads.
The Central Electricity Authority has proposed that, after June 2027, all new government-owned solar and wind projects would have “mandatory” two-hour battery storage. (This mirrors a policy that was in place in China until early 2025 and was subsequently scrapped, in favour of more market-based approaches.)
For oil and gas, India’s consumption has been flatlining for the past two years, after half a century of continuous growth that was only briefly interrupted by Covid-19.
This has reduced the impacts of the Hormuz crisis on the country’s trade balance, helping close the gap between supply and consumption. But it has entailed disruptive shifts in many oil-dependent sectors.
For example, high prices and fuel shortages due to the Hormuz crisis led state governments to reverse their orders banning the use of dirtier fuels such as fuel oil, kerosene and coal in industries and commercial establishments.
Meanwhile, EV adoption has also begun to influence oil consumption.
Despite the progress in the power sector and reductions in oil consumption, India’s total emissions went up over the past two years due to a major increase in industrial emissions.
Low levels of electricity use in industry mean that growing industrial output results in increasing direct fossil-fuel use and emissions.
Unless the rate of industrial electrification picks up, increases in heavy industry output will continue to translate into increases in fossil-fuel consumption and CO2 emissions.
About the data
This analysis is based on official monthly data for fuel consumption, industrial production and power generation from different ministries and government institutes.
Coal-power emissions are estimated by combining plant-level coal consumption from the Central Electricity Authority’s (CEA) monthly coal reports with data on the calorific value and emission factors of coal used at different power plants from the CEA’s CO2 baseline database.
For each station and month, total coal consumption is split into domestic and imported coal using the imported share of coal receipts over a trailing two-month window, found to best reproduce the actual split in data available for 2023.
Consumption is converted to CO2 using each plant’s station-specific gross calorific value from the CEA database and IPCC emission factors for domestic coal, imported coal and lignite. The national-average calorific value is used for recently added plants, for which data is not available in the baseline database.
Coal use at steel and cement plants, as well as process emissions from cement production, are estimated using production indices from the index of eight core industries released monthly by the Office of Economic Adviser, assuming that changes in total fossil-fuel use follow production volumes. These production indices were used to scale fuel use by the sectors in 2022.
To form a basis for using the indices, monthly coal-consumption data for 2022 was constructed for the sectors by combining the annual total coal and petcoke consumption reported in IEA World Energy Balances with monthly production data. This work was set out in a paper by Robbie Andrew, a researcher at Norwegian research institute CICERO, on monthly CO2 emission accounting for India. Monthly petcoke consumption was available from the Petroleum Planning and Analysis Cell, while coal consumption by the cement industry was calculated by subtracting petcoke use from total fossil-fuel use.
Annual cement-process emissions up to 2025 were also taken from Andrew’s work and scaled using the production indices. This approach better approximated changes in energy use and emissions reported in the IEA World Energy Balances, than did the amounts of coal reported to have been dispatched to the sectors, showing that production volumes are the dominant driver of short-term changes in emissions.
For other sectors – including aluminium, auto, chemical and petrochemical, paper and plywood, pharmaceutical, graphite electrode, sugar, textile, mining, traders and others – coal consumption is estimated based on data on despatch of domestic and imported coal to end users from statistical reports and monthly reports by the Ministry of Coal, as consumption data is not available.
Coal consumption by “captive” coal-power plants – those supplying power to industrial sites, not to the public electricity network – was calculated based on capacity changes from Global Energy Monitor, assuming constant utilisation, as utilisation has been very stable year-to-year, as calculated from Central Electricity Authority data.
The difference between coal consumption and dispatch is stock changes, which are estimated by assuming that the changes in the amount of coal stored at end-user facilities mirror those at coal mines, with end-user inventories excluding power, steel and cement assumed to be 70% of those at coal mines, based on comparisons between our data and the IEA World Energy Balances.
Stock changes at mines are estimated as the difference between production at and dispatch from coal mines, as reported by the Ministry of Coal.
Coal consumption is estimated in two ways for sectors beyond power, steel and cement. Consumption of domestic coal in these other sectors is taken from the monthly reports by the Ministry of Coal. Their consumption of imported coal is estimated from the total imports of thermal coal reported by consultancy Kpler, by subtracting demand for imports at coal-power plants. The basis for this assumption is that steel and cement industries use little imported thermal coal, according to Ministry of Coal data.
Product-by-product consumption data for petroleum products, as well as gas use by sector, is from the Petroleum Planning and Analysis Cell of the Ministry of Petroleum and Natural Gas.
As the fuel dispatch and consumption data is reported as physical volumes – such as tonnes or litres – calorific values are taken from IEA’s World Energy Balance and CO2 emission factors from 2006 IPCC Guidelines for National Greenhouse Gas Inventories.
The emissions factor for motor oil or petrol was updated, based on the blending percentage of ethanol each year. The ethanol-blending percentage is as reported by the Ministry of Petroleum and Natural Gas.
Calorific values are assigned separately to different fuel types, including domestic and imported coal, anthracite and coke, as well as to petrol, diesel and several other oil products.
related
Explainer: The CMIP7 emissions scenarios – and how they explore future climate change
UNEP: New country climate plans ‘barely move needle’ on expected warming
Analysis: India’s power-sector CO2 falls for only second time in half a century
World’s electricity supply close to ‘peak emissions’ due to growth of wind and solar
The post Analysis: India’s power-sector emissions flat for two years due to clean-energy surge appeared first on Carbon Brief.
Analysis: India’s power-sector emissions flat for two years due to clean-energy surge
-
Greenhouse Gases2 years ago嘉宾来稿:满足中国增长的用电需求 光伏加储能“比新建煤电更实惠”
-
Climate Change1 year ago
Guest post: Why China is still building new coal – and when it might stop
-
Greenhouse Gases1 year ago
Guest post: Why China is still building new coal – and when it might stop
-
Climate Change2 years ago嘉宾来稿:满足中国增长的用电需求 光伏加储能“比新建煤电更实惠”
-
Renewable Energy11 months agoSending Progressive Philanthropist George Soros to Prison?
-
Climate Change2 years ago
Bill Discounting Climate Change in Florida’s Energy Policy Awaits DeSantis’ Approval
-
Greenhouse Gases1 year ago
嘉宾来稿:探究火山喷发如何影响气候预测
-
Carbon Footprint2 years agoUS SEC’s Climate Disclosure Rules Spur Renewed Interest in Carbon Credits


