

It took Hurricane Helene just three days to travel from the overly warm waters of the Gulf of Mexico to the mountains of North Carolina, causing incredible damage and loss of life. Hurricane Milton also moved fast, intensifying from a Category 1 to a Category 5 hurricane in a single day, before hitting Florida with incredible winds, tornados and flooding. Climate change is propelling these weather events to grow faster and stronger than ever before.
Other climate change impacts are accelerating as well. Consider the record-breaking warm ocean temperatures of the past year, which has caused the largest coral bleaching event on record, habitat loss and species migration. Many scientists thought these high ocean temperatures would be years away, but the realities of climate change are not a distant threat. The speed at which they have arrived must drive us to act.
Stay current
Enter your email and never miss an update
Addressing climate change is a top priority for Ocean Conservancy now more than ever. If we are to protect the ocean, its marine ecosystems and the people who depend on them, we must address climate change at its root: the burning of fossil fuels for energy. But this cannot happen without clean-energy solutions, such as offshore wind and other marine renewables, that can replace them.
That is why Ocean Conservancy is leading a comprehensive effort to shift the ocean to a source of 100% responsible clean energy generation by 2050. By stopping harmful offshore drilling of oil and gas and harnessing the natural powers of the ocean for clean energy, the ocean has the power to be a climate solution instead of just a victim.
Aiming for 2050 may seem far off, but it’s precisely this kind of forward thinking we need to be successful.
Energy development is a multi-decade process. Decisions we make today—positive or negative—will be locked in for generations. When new offshore oil wells are drilled, they can continue pumping oil for 30 years or more. In August 2024, Chevron began operating a new deepwater project in the Gulf of Mexico that could pump oil into the 2050s. Additional deepwater Gulf projects that could have similarly long lifespans are being developed by BP, Shell and others. And new lease sales could push offshore oil drilling into 2080’s.
Now is the time we need to stop new offshore oil and gas leasing and drilling and start holding operators accountable for cleaning up the messes they have already made. Simultaneously, there is much work we need to do from now through 2050 to nurture the responsible development of clean ocean-based energy replacements for dirty fossil fuels. It will take smart planning and coordinated strategies to ensure offshore wind is developed responsibly, preventing and minimizing impacts to marine life and other ocean users. Working together, responsible offshore wind can help power our lives and communities, without the risk and harm that fossil fuels have caused to our ocean for a century.
Consider these distinct differences between fossil fuels and clean-ocean renewables like offshore wind:
Offshore wind does not produce the harmful emissions that warm our planet. If you compare the emissions created from offshore wind over its lifetime to how much energy it produces, offshore wind is significantly better for the planet than oil and gas. Wind energy produces roughly only 11 grams of carbon dioxide per kilowatt-hour (g CO2/kWh) of electricity generated. In contrast, emissions from natural gas produce roughly 465 (g CO2/kWh)—more than 40 times higher. Fewer emissions equal less carbon warming our climate and cleaner air for people and wildlife.
Offshore wind is American energy, providing energy security to communities. Fossil fuels (such as natural gas, oil and coal) are global commodities that are imported and exported. This means global events and market shocks can significantly affect supply chains and costs. Some states, like California, Maine, Maryland and others, import sizable amounts of the fossil fuels they use to produce electricity. Other communities (including villages in Alaska and Small Island Developing States in the Pacific) that are not connected to broader power grids are forced to import nearly all the fuels, like diesel, needed to produce electricity. Offshore wind and other renewable energy sources offer alternatives for these communities to build energy independence and resiliency to keep the lights on at a stable price.
Offshore wind does not come with the risks we have experienced from offshore oil drilling. It’s no secret that offshore drilling is risky business—with inevitable oil spills causing irreparable harm to our ocean environment and nearby communities. Over the past 50 years, at least 44 major oil spills have occurred offshore, each dumping more than 10,000 barrels (420,000 gallons), as well as thousands of minor spills affecting U.S. waters. Additionally, offshore drilling produces routine pollution every day in the form of discharges into the water and emissions into the air through flaring and other processes. This pollution adds up. Even when oil production stops, the impacts continue: Offshore oil operators have discarded more than 18,000 miles of disused pipeline on the ocean floor and have missed cleanup deadlines, leaving thousands of wells and hundreds of oil platforms in the ocean unmonitored.
The time is now to plan, coordinate and act to shift the ocean to a powerhouse of clean, responsible energy for the generations to come. If we harness the power of the ocean, we can rein in climate change and meet our world’s energy needs. Together we can change course.
You can join forces with us at Ocean Conservancy by taking action to phase out dangerous fossil fuels and support clean energy.
The post Drilling Into the Differences Between Offshore Oil Drilling and Offshore Wind appeared first on Ocean Conservancy.
Drilling Into the Differences Between Offshore Oil Drilling and Offshore Wind

Ocean Acidification
Dr Heidarzadeh’s TV interview with SkyNews on the massive M7.7 Panama earthquake on 9 October 2026
Dr Heidarzadeh’s TV interview with SkyNews on the massive M7.7 Panama earthquake on 9 October 2026. Click here for the full story.

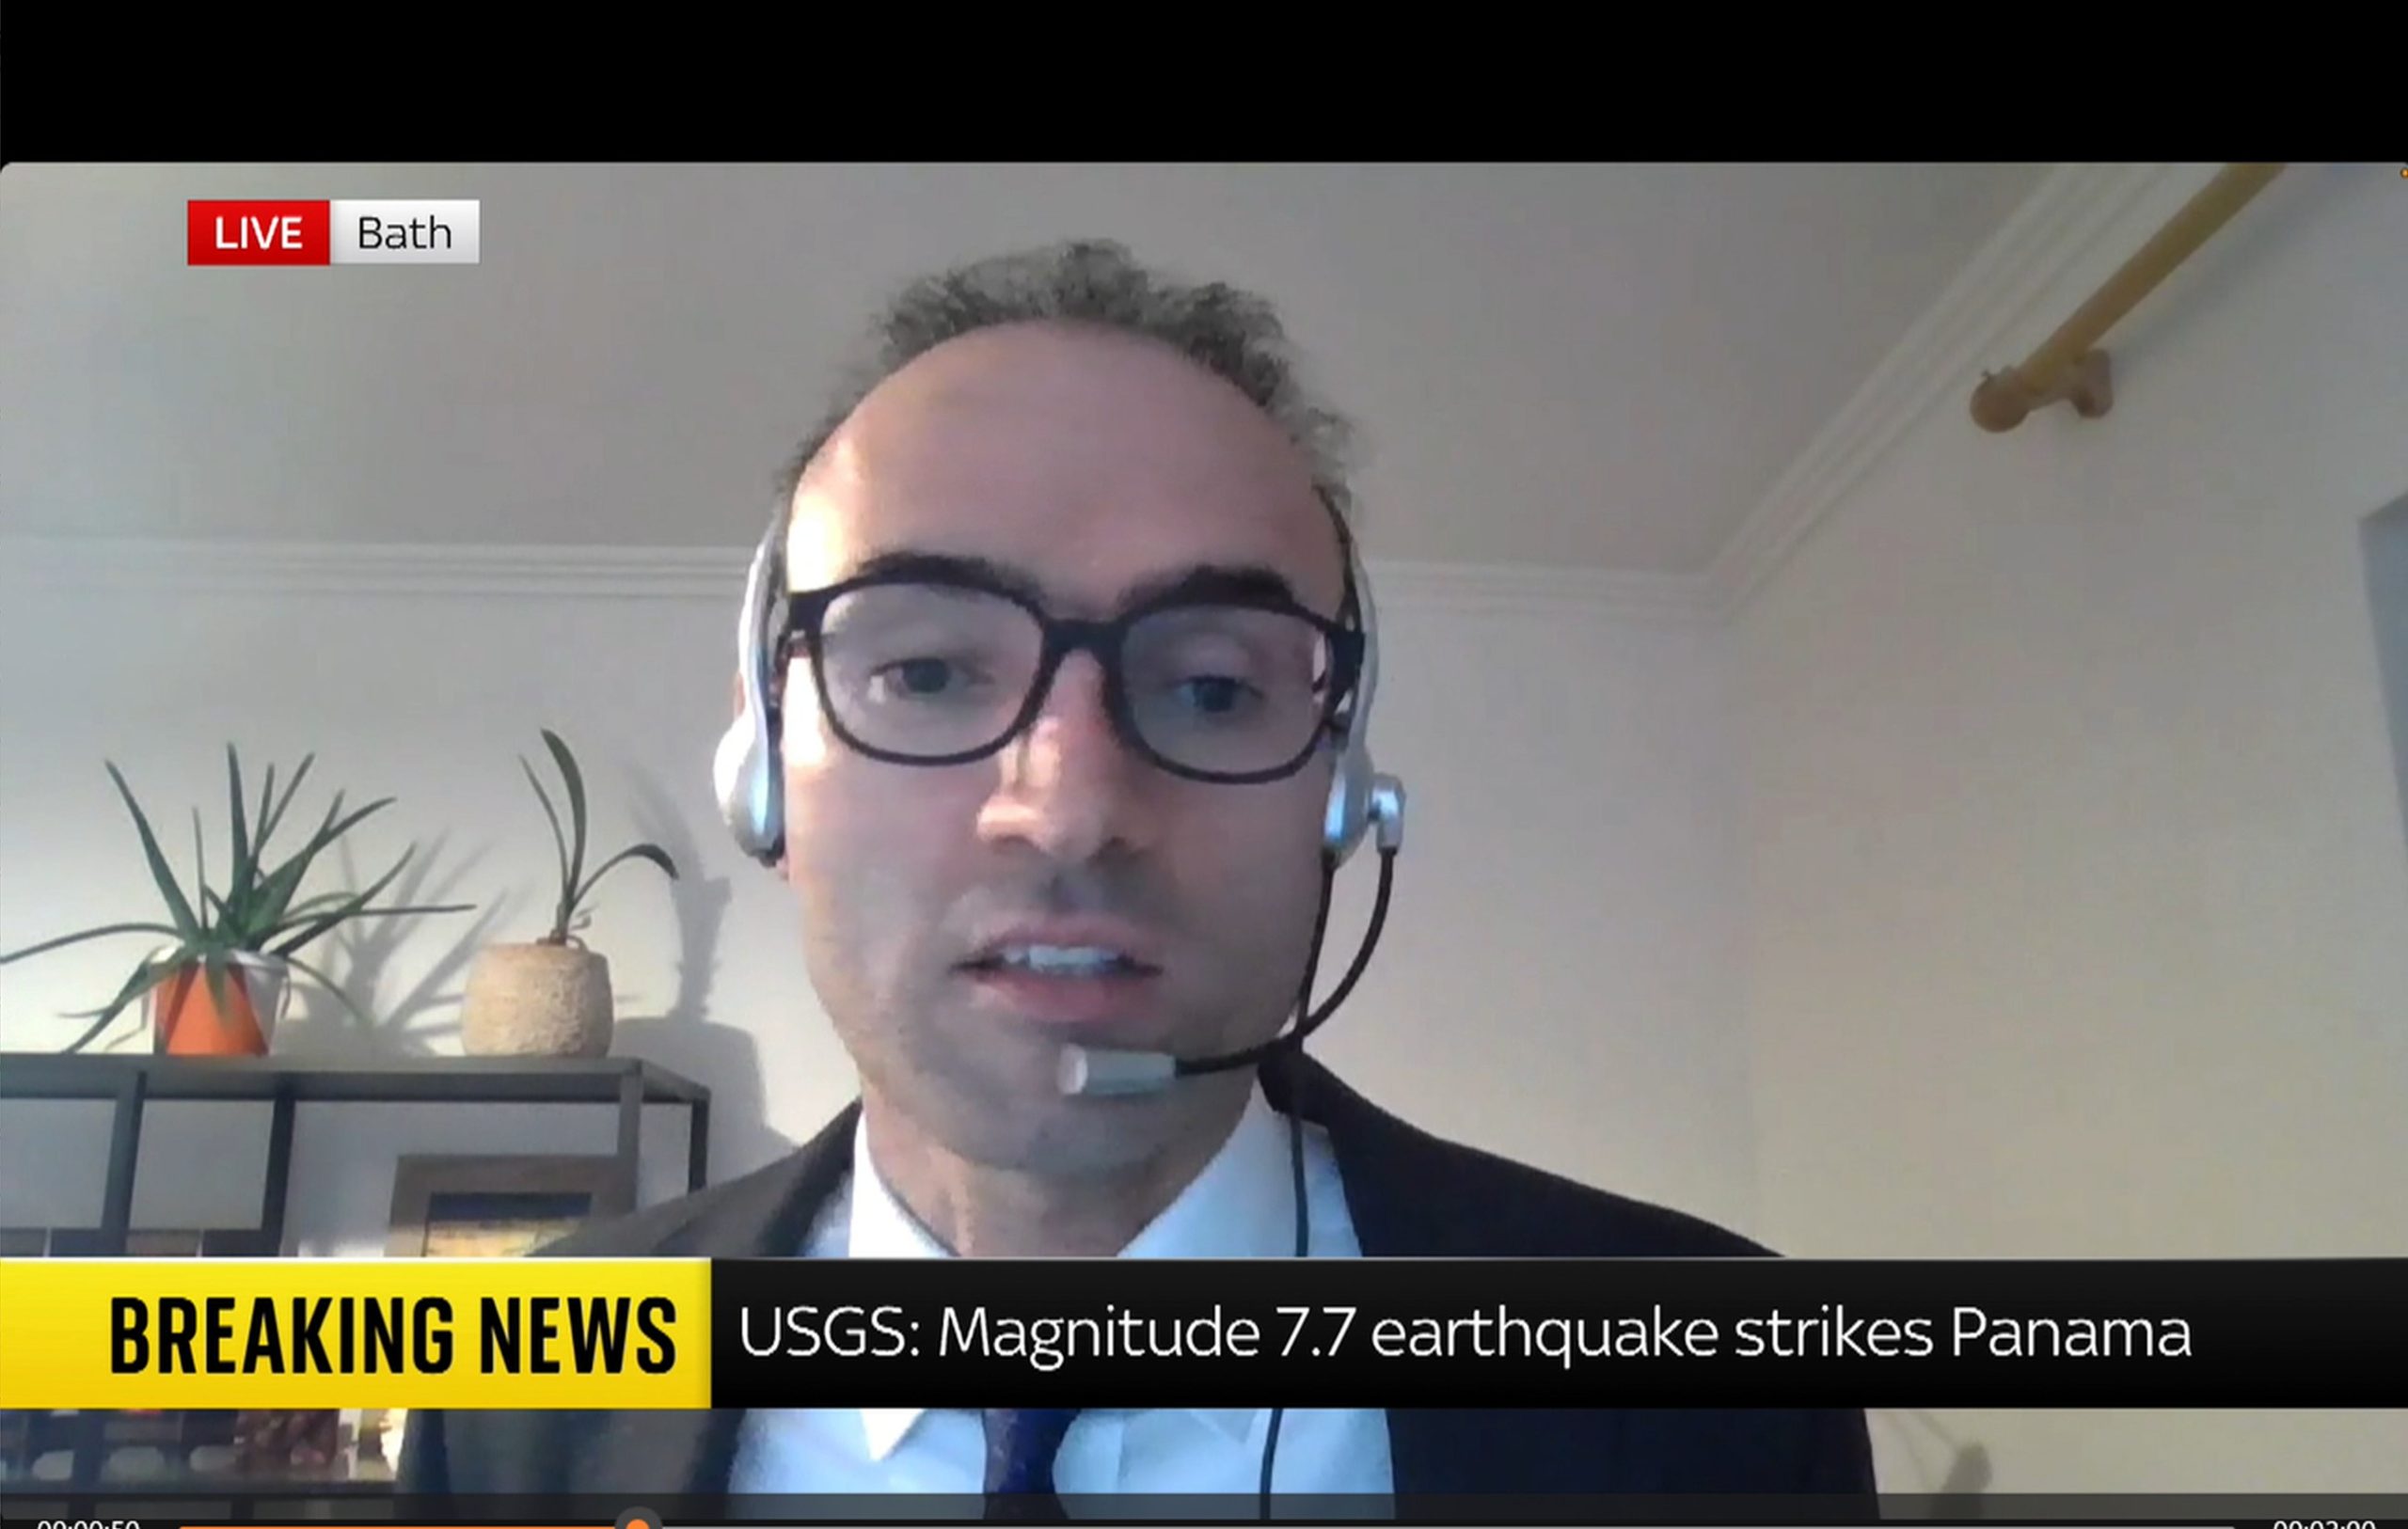
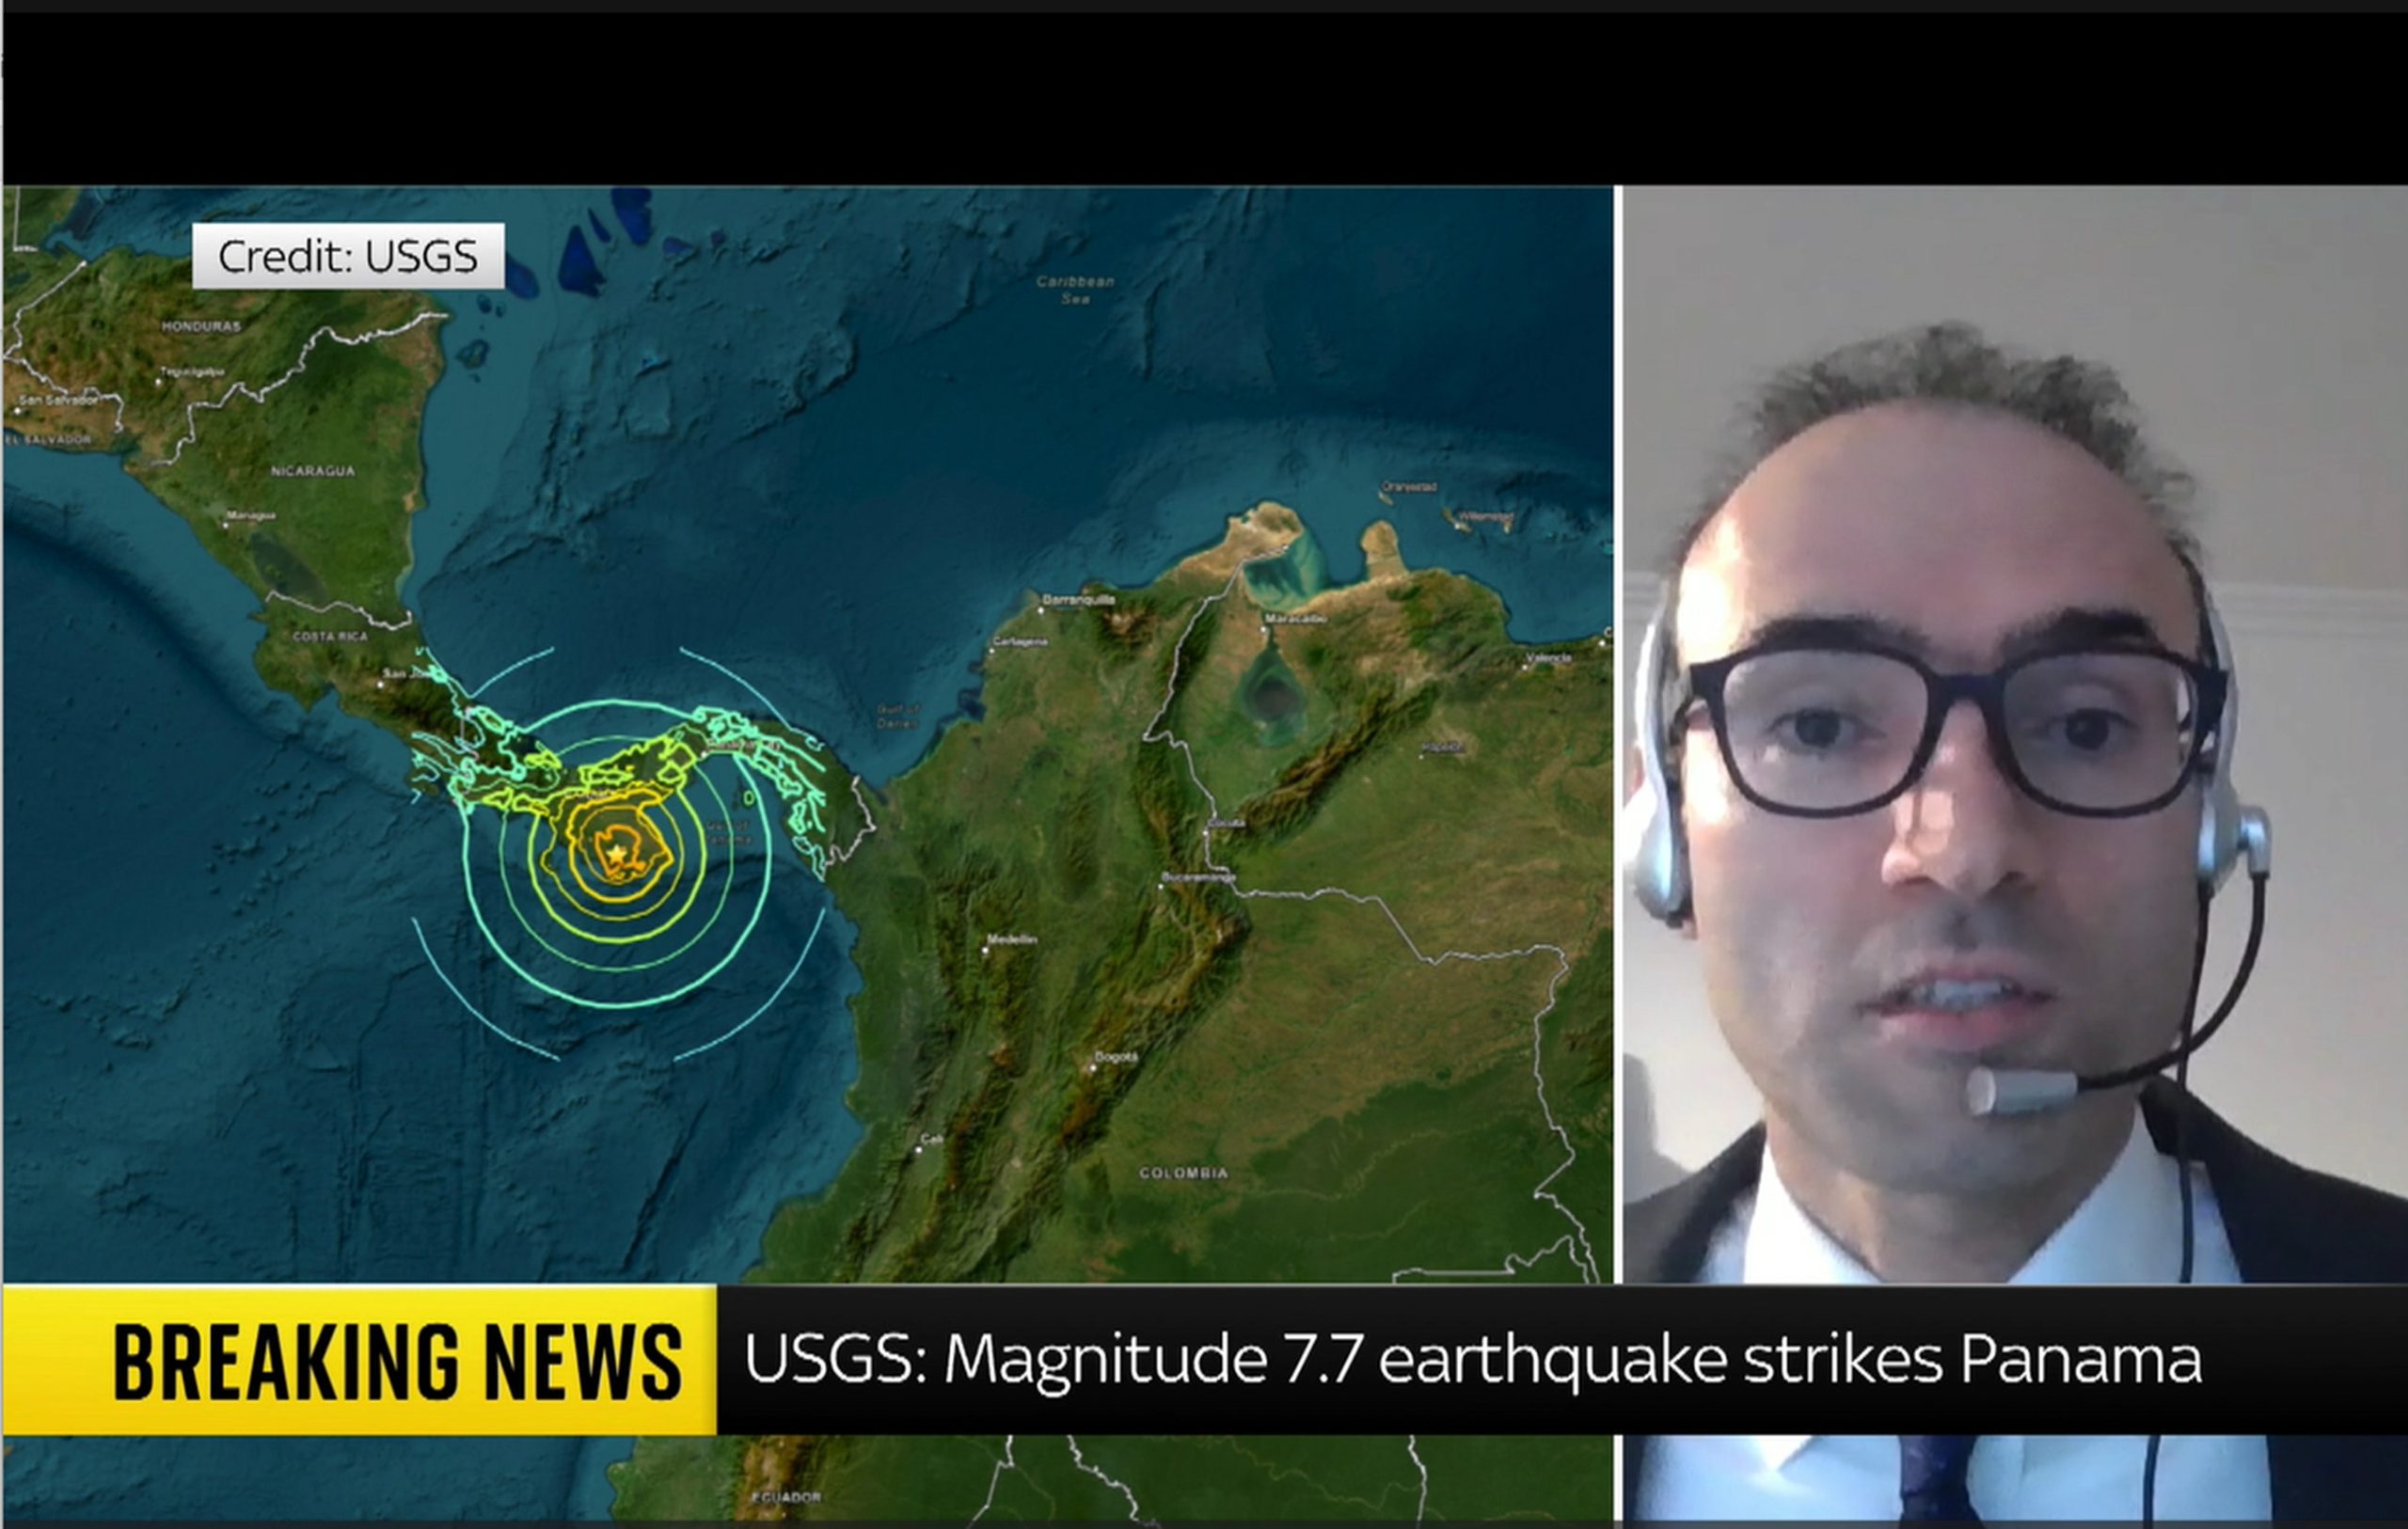
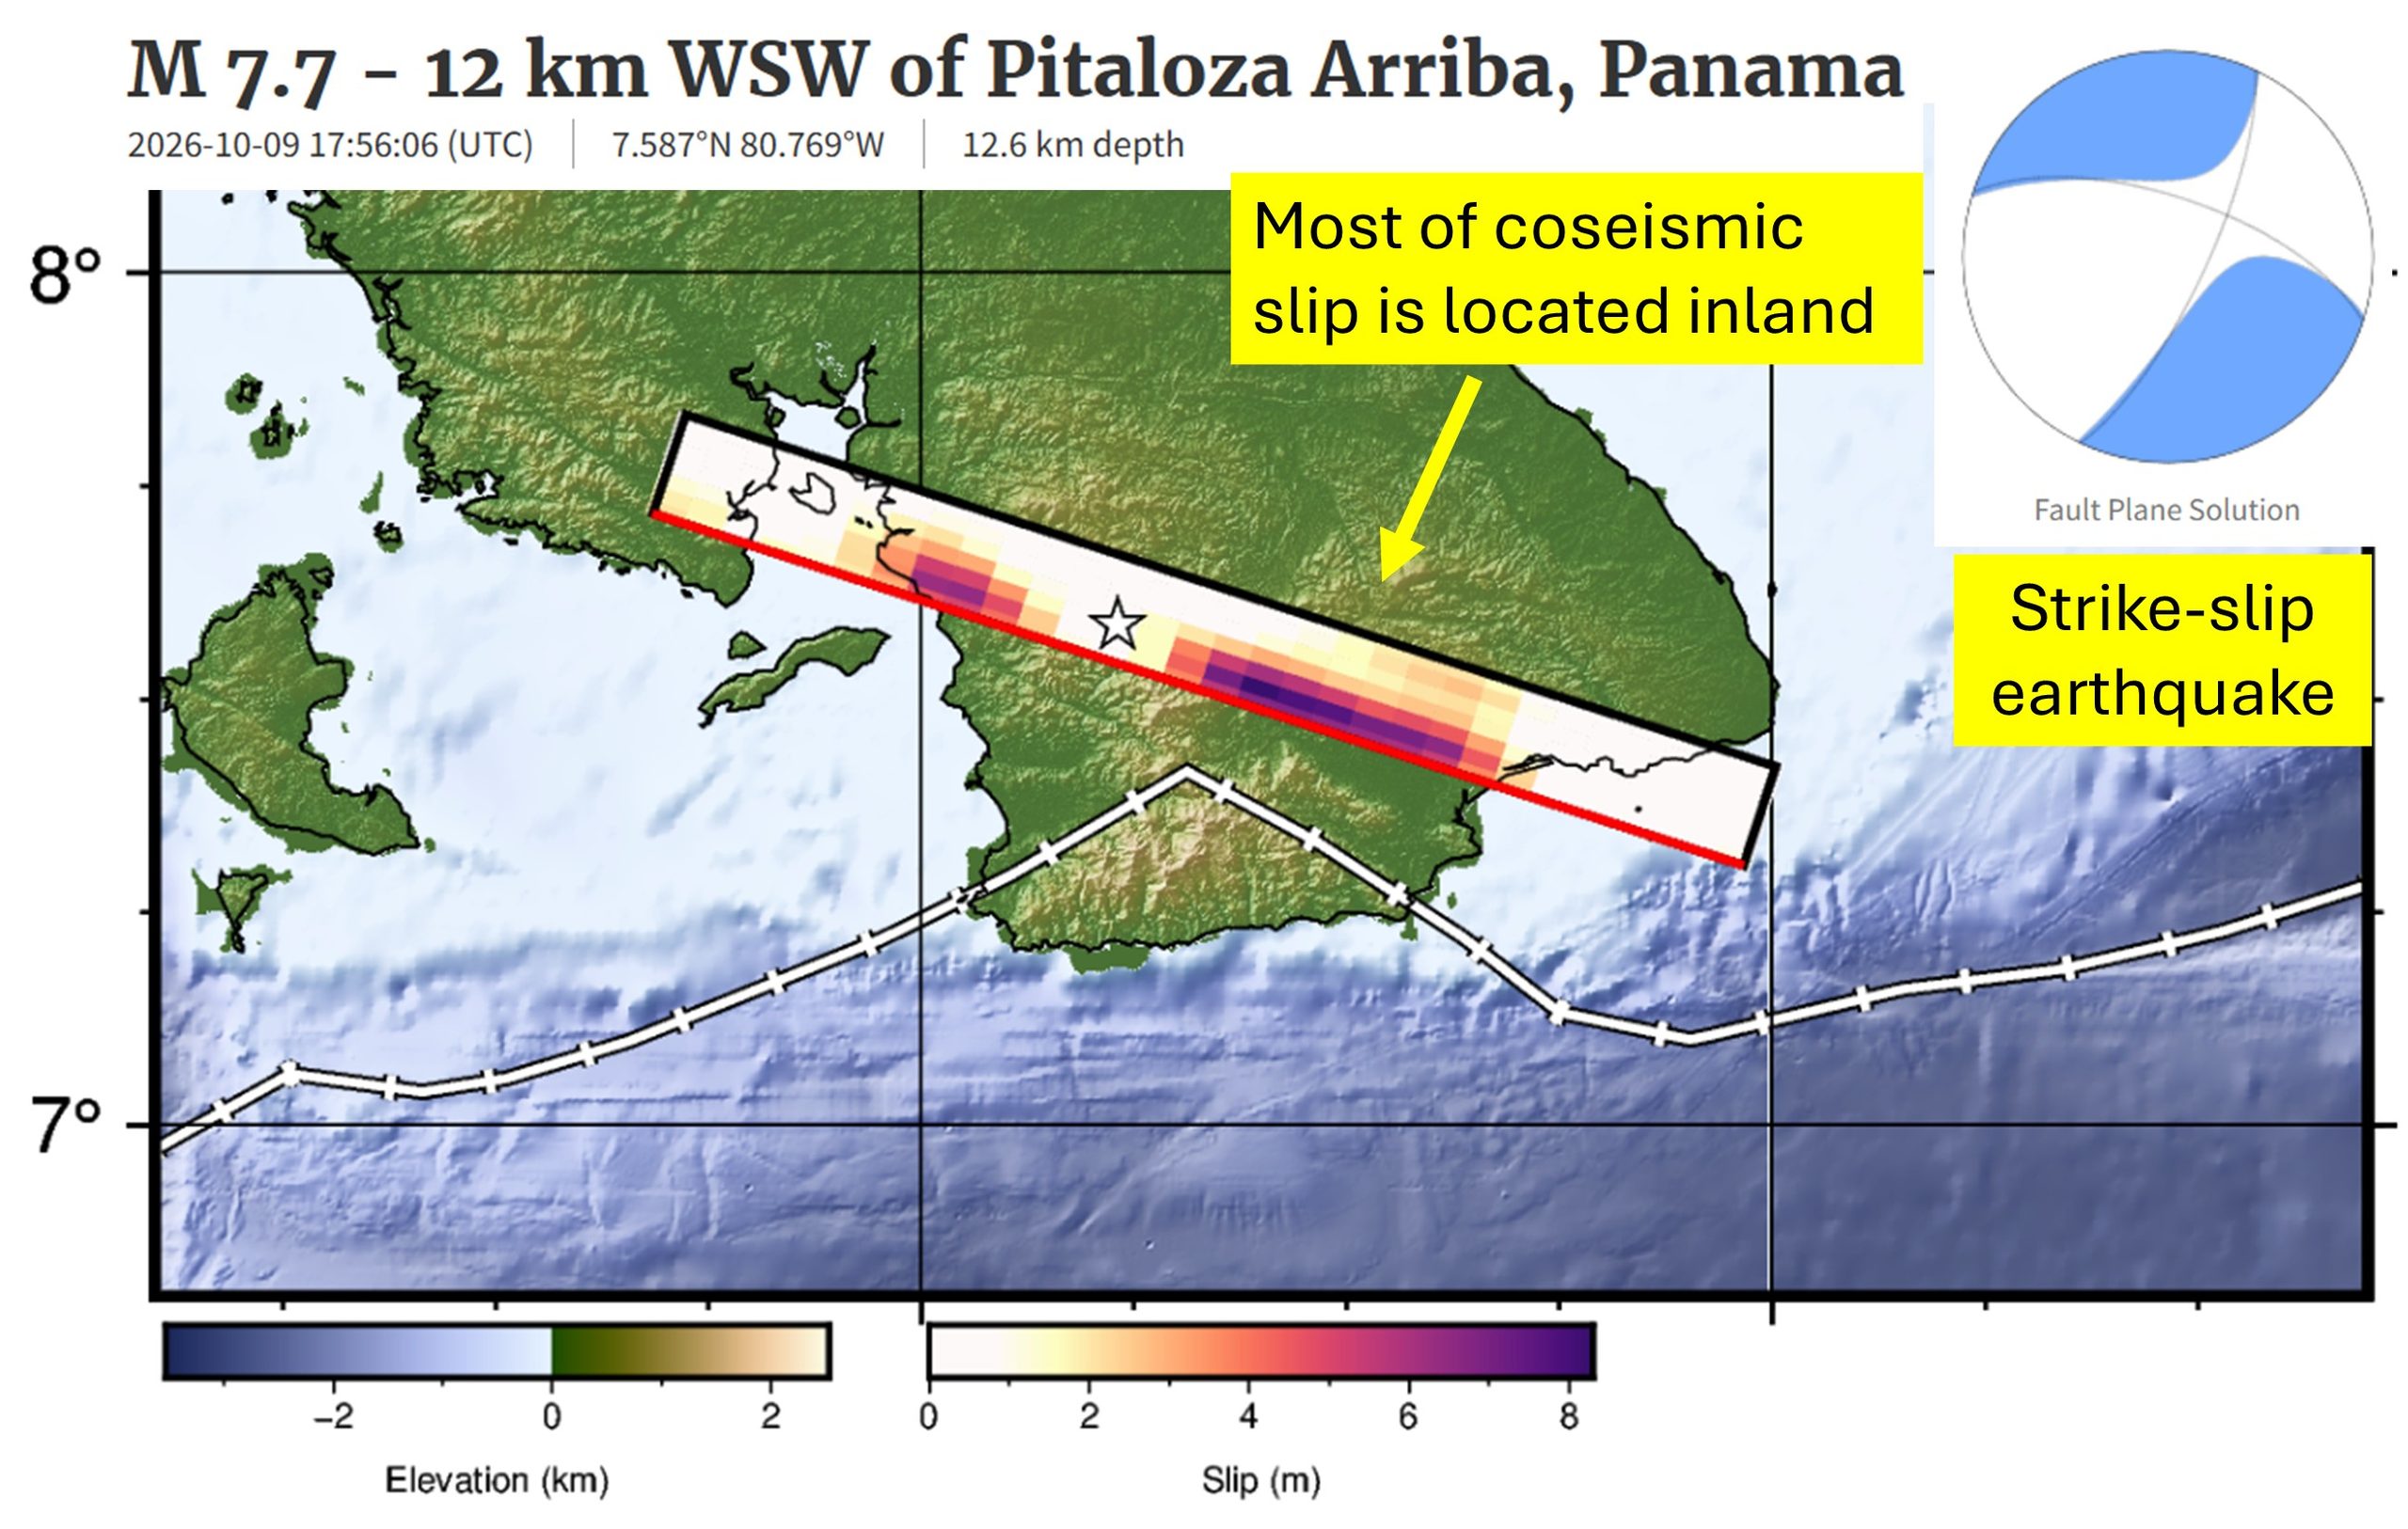
Dr Heidarzadeh’s TV interview with SkyNews on the massive M7.7 Panama earthquake on 9 October 2026
Our ocean is an incredibly vast and mysterious place. And there is no place where that is more evident than the deepest ocean area in the world: the legendary Mariana Trench. Located east of the Philippines, the Mariana Trench lies in the Mariana Archipelago in the western portion of the North Pacific. The greater area of the Mariana Trench Marine National Monument is made up of more than 95,000 square miles of ocean. Beneath these waters lie incredibly complex aggregations of submerged islands and volcanoes … and of course, an astoundingly massive trench.
Dive in with us to have your biggest questions answered about the famed Mariana Trench.
How deep is the Mariana Trench?
The deepest part of the Mariana Trench, known as Challenger Deep, is almost 36,000 feet below the ocean’s surface. For context, Mount Everest is about 29,000 feet above sea level, so the Mariana Trench is about 7,000 feet deeper than Mount Everest is tall. For one more comparison, the RMS Titanic lies at a depth of about 12,500 feet below sea level. The Challenger Deep is in waters nearly three times deeper than this ship’s final resting place.
Due to its enormous size, the Mariana Trench has at times been affectionately nicknamed the Grand Canyon of the ocean. This is certainly a picturesque image, but don’t let the mammoth size of this U.S. national terrestrial park fool you into thinking the Mariana Trench matches its size. The trench’s footprint is estimated to be 120 times larger than the Grand Canyon’s, and to reach the bottom of Challenger Deep, you’d need to descend through almost six Grand Canyons stacked on top of each other before you’d reach the seafloor.
Oh … and did we mention it’s five times wider than it is deep? It’s about 43 miles wide!
What is Challenger Deep, and how long would it take to reach it?
Challenger Deep is the deepest point of the Mariana Trench. Fewer than 30 people have ever journeyed to this area. The trek below the surface is long, dark and time-consuming, and it’s not an expedition considered lightly by scientists and explorers.
The first people to descend into the depths of this area in 1960 were oceanographers Jacques Piccard and Don Walsh, and it took them close to five hours to reach Challenger Deep. Since then, more advanced submersibles have been created, but it still takes two to four hours for modern vessels to reach such depths. For example, explorer and filmmaker James Cameron reached the seafloor in a little more than 2.5 hours in the first documented solo submarine dive to the area, and it took oceanographer Dr. Dawn Wright about four hours in 2022. It is crucial that these submersibles descend slowly and steadily beneath the surface, as the immense water pressure compounds with every mile a submersible descends. Speaking of pressure …
Get Ocean Updates in Your Inbox
Sign up with your email and never miss an update.
What is the water pressure at the bottom of the Mariana Trench?
If you thought the depth of the Mariana Trench was its only jaw-dropping feature, think again. Water pressure is one of the most important factors affecting deep-sea life. In the ocean, pressure increases by one atmosphere for every 33 feet (10 meters) of depth. One atmosphere (a unit of measurement for pressure equivalent to average air pressure at sea level) is equal to about 14.7 pounds per square inch (PSI), which is the approximate standard atmospheric pressure at sea level. If you were to convert atmospheric pressure into weight, one atmosphere is about the weight of a bowling ball. Stay with me, friends.
If a vessel were to dive 2,000 feet below the surface, the pressure would equal that of 60 bowling balls stacked atop every square inch of that submersible. But 60 bowling balls is simply nothing compared to the pressure in the Mariana Trench. The atmospheric pressure at the depths of Challenger Deep is equal to about 16,000 PSI. That pressure is about the same as the weight of an entire full-grown elephant on every square inch of a submersible!
Need a more extreme comparison? If a human were to be placed at the bottom of the Mariana Trench, the pressure would be equal to that of 50 jumbo jets piled on top of a person!
Do any animals live in the Mariana Trench?
The depths of the Mariana Trench come with immense pressure and extreme darkness, but somehow, life finds a way to survive. Organisms that live at an extreme depth, like that of Challenger Deep, have to be highly adapted to low temperatures (typically just above freezing), high pressure and virtually no light at all.
Species found in the depths of the Mariana Trench might look vastly different from animals from other ocean depths because their anatomy has been refined to thrive in harsh conditions. At such great depths, these animals typically depend on chemosynthesis (using nutrient-rich waters being pumped out of hydrothermal vents) or descending detritus (dead matter that has fallen from higher parts of the ocean) for food, such as whale falls. Just a handful of these animals include species of octopuses and squids, sea cucumbers, amphipods, sea jellies, shrimp, sea worms and some wild-looking fish!
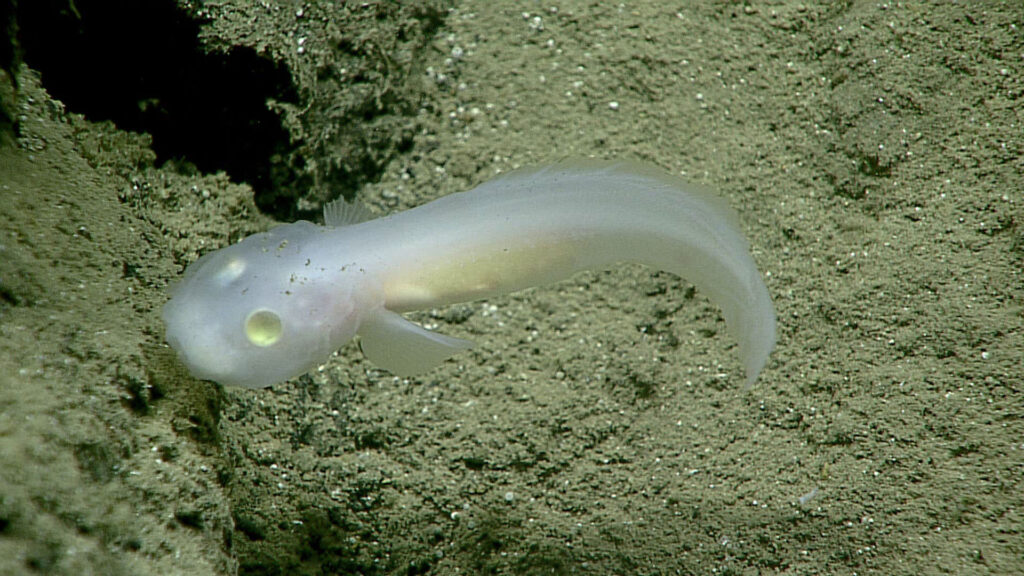
In 2025, more than 7,000 new species were discovered in the Mariana Trench, including the hadal snailfish (Pseudoliparis swirei). This is the deepest-dwelling fish currently known to science. Now, the fish has been dubbed “the Mariana snailfish.”
How was the Mariana Trench formed?
The process by which the Mariana Trench was created is a geologically fascinating one known as subduction. On the Earth’s surface, there are thin plates that cover the planet’s mantle, which is made of molten rock. If two of these plates collide, one pushes down into the Earth’s mantle while the other is pushed over the bottom plate. When this happens, a trench is formed from the drag of the bottom plate. This process can sometimes create incredibly strong earthquakes. The plates that forged the Mariana Trench’s creation are estimated to be up to approximately 180 million years old.
This trench was unknown to scientists until 1875. It was then that a team of explorers on the HMS Challenger measured the depth of the sea by simply lowering a weighted rope into the water. They were baffled when they measured that first portion of the seafloor to be five miles below the surface. And so was born the origin of some of the most daring deep-sea explorations known to mankind to date.
Is the Mariana Trench protected?
The Mariana Trench is in waters off Guam and the Mariana Islands. The region is protected from some human activities under its status as a marine monument. The creation of the Mariana Trench Marine National Monument signified that international, national and local leaders all recognize the importance of protecting this area.
However, just because the region is protected does not mean it’s not vulnerable to modern threats to ocean health. Plastic bags have been spotted in the Mariana Trench during several expeditions, highlighting the far-reaching impact of the marine debris problem. No corner of our ocean is safe from the ever-present threat of plastic pollution. The reality of a changing climate makes the future well-being of wondrous places like the Mariana Trench uncertain. What’s more: More than 70% of the global ocean has yet to be mapped. And what we don’t yet know about, we cannot wisely work to protect.
It’s up to us to work together to defend our ocean, from the sandy shores of our favorite beaches to the deepest, darkest parts of the sea. Together, we can work to protect our ocean as a whole, which ultimately helps protect treasured places like Challenger Deep.
Find out how you can join Ocean Conservancy’s wave of momentum to secure a healthy ocean and a thriving planet, forever and for everyone!
The post The Mysteries of the Mariana Trench appeared first on Ocean Conservancy.