China and India accounted for 87% of the new coal-power capacity put into operation in the first half of 2025, whereas other regions continued to move away from coal.
These developments, highlighting a growing global divide between many countries phasing out coal power and a handful continuing to expand new capacity, are revealed in Global Energy Monitor’s latest Global Coal Plant Tracker results and reported here for the first time.
The results include Ireland becoming the fifth EU country to phase out coal power and Latin America becoming a region with zero active proposals for new coal capacity.
Meanwhile, the results show the US is on track to retire more coal capacity in 2025 than it did under the Biden administration last year, despite the efforts of the Trump White House.
Moreover, rather than follow the US in turning away from clean-energy leadership, other countries have continued their efforts to phase down coal power, with “just energy transition partnerships” (JETPs) advancing in Vietnam, Indonesia and South Africa during 2025 to date.
EU and Latin America pave the way for coal phaseout
The EU and Latin America are emerging as the global leaders in phasing out coal power, according to GEM’s analysis.
On the heels of the UK coal phaseout in 2024, Ireland stopped the use of coal power in June 2025, with nine EU countries expected to follow suit through 2029, including Spain, France and the Netherlands.
In total, all but three EU countries are planning to phase out coal by 2033, as shown in the chart below.
According to the International Energy Agency (IEA), coal power should be virtually phased out in advanced economies by 2030 and the rest of the world by 2040 to keep warming below 1.5C, as the Paris Agreement targets.
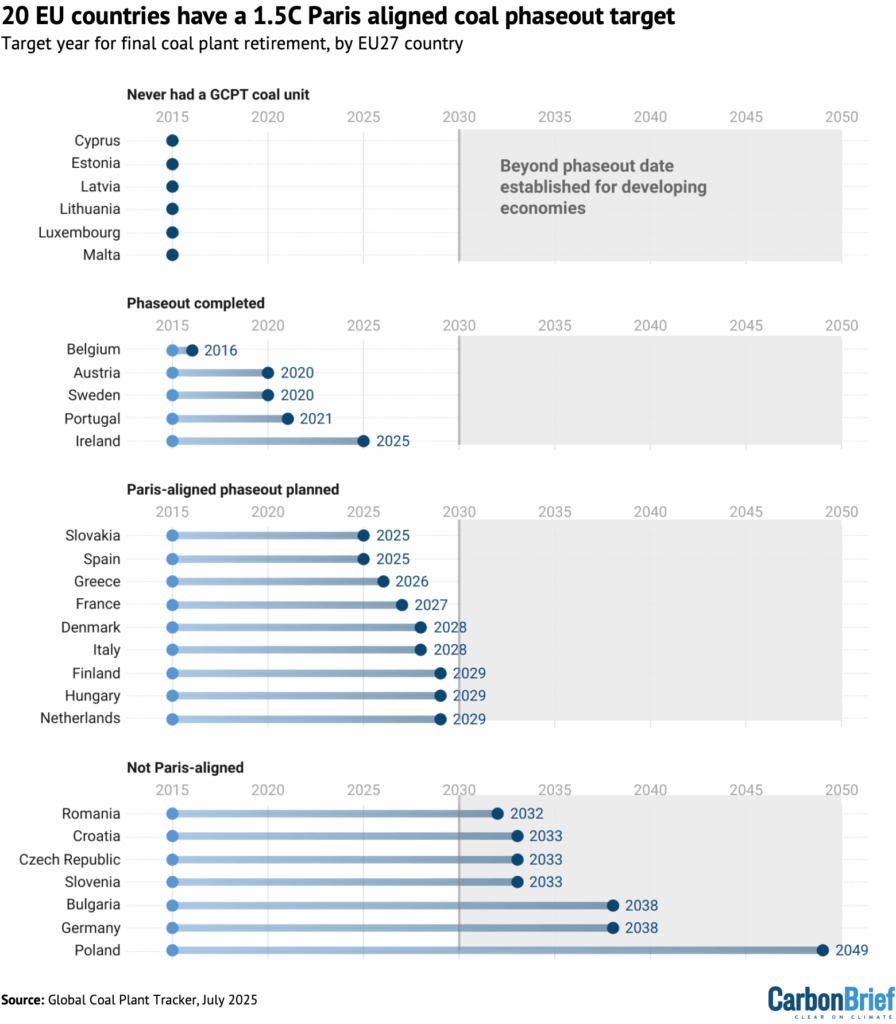
Development has also ceased in the region. No new coal plants have been proposed in the EU since 2018 and no coal plants have entered construction since 2019.
The coal phaseout in the EU and UK has been driven by a combination of country commitments and supporting policies and regulations, including air and carbon pollution limits on power plants, carbon pricing and policy support for clean-energy deployment.
Coal-power capacity retirements in the EU stalled for two years, following gas shortage concerns in the wake of Russia’s invasion of Ukraine, but they have since accelerated.
Coal capacity retired in the first half of 2025 (2.5GW) has already nearly exceeded all of 2023 (2.7GW) – with another 11GW planned for retirement in the EU by the end of the year.
GEM data shows that, in Latin America, the shelving of two coal-plant proposals in Honduras and Brazil in 2025 has left the region with no new coal plants actively proposed, as shown in the chart below – a collapse of the 18 plants totalling 7.3GW of capacity proposed in 2015.
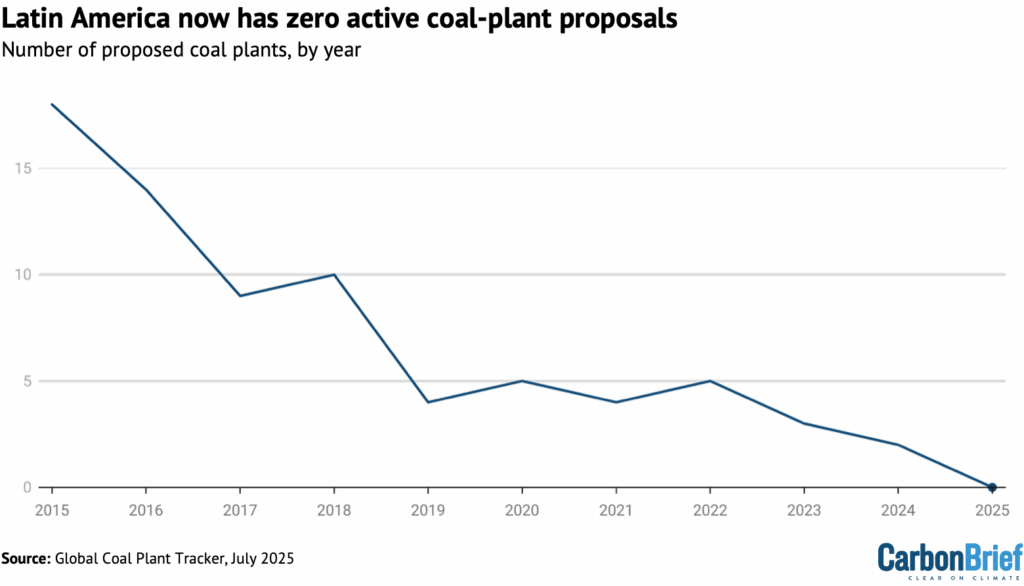
This followed the entry of Honduras into the Powering Past Coal Alliance (PPCA) in May and the lack of new coal plants proposed in Brazil’s 2025 national energy auctions, with a decrease in coal-power generation projected through 2034 in Brazil’s most recent 10-year energy plan.
Latin America is also nearly on track for a coal-power pathway that would be aligned with the 1.5C target of the Paris Agreement. More than 60% (10GW) of its 16.3GW of operating coal-power capacity is scheduled to come offline by 2040.
China and India continue to dominate
China and India dominated coal development in the first half of 2025, as the two countries had more new proposals, construction starts and coal plants commissioned than the rest of the world combined, GEM’s tracker shows.
As the chart below shows, there were 74.7GW and 12.8GW of newly proposed coal projects in China and India, respectively, in the first half of 2025, compared to just 11GW in the rest of the world.
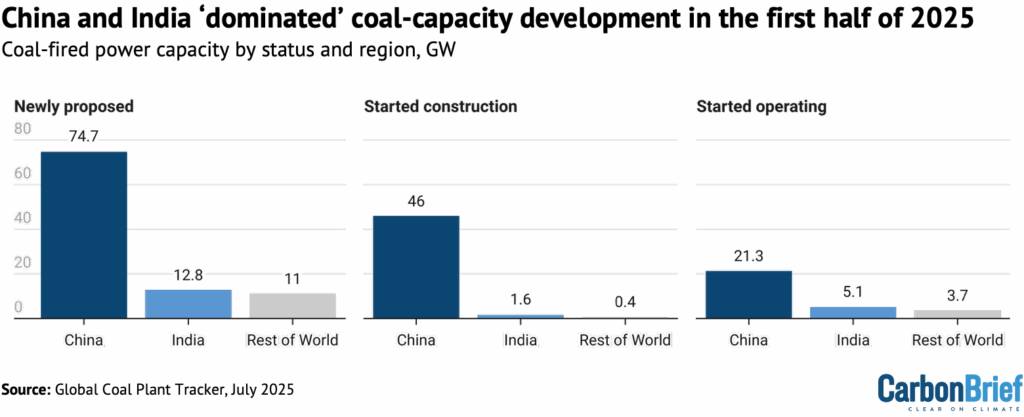
Construction starts and restarts in China also reached 46GW, putting the country on track to match the record levels of 2024, when more than 97GW of coal-power plants began construction.
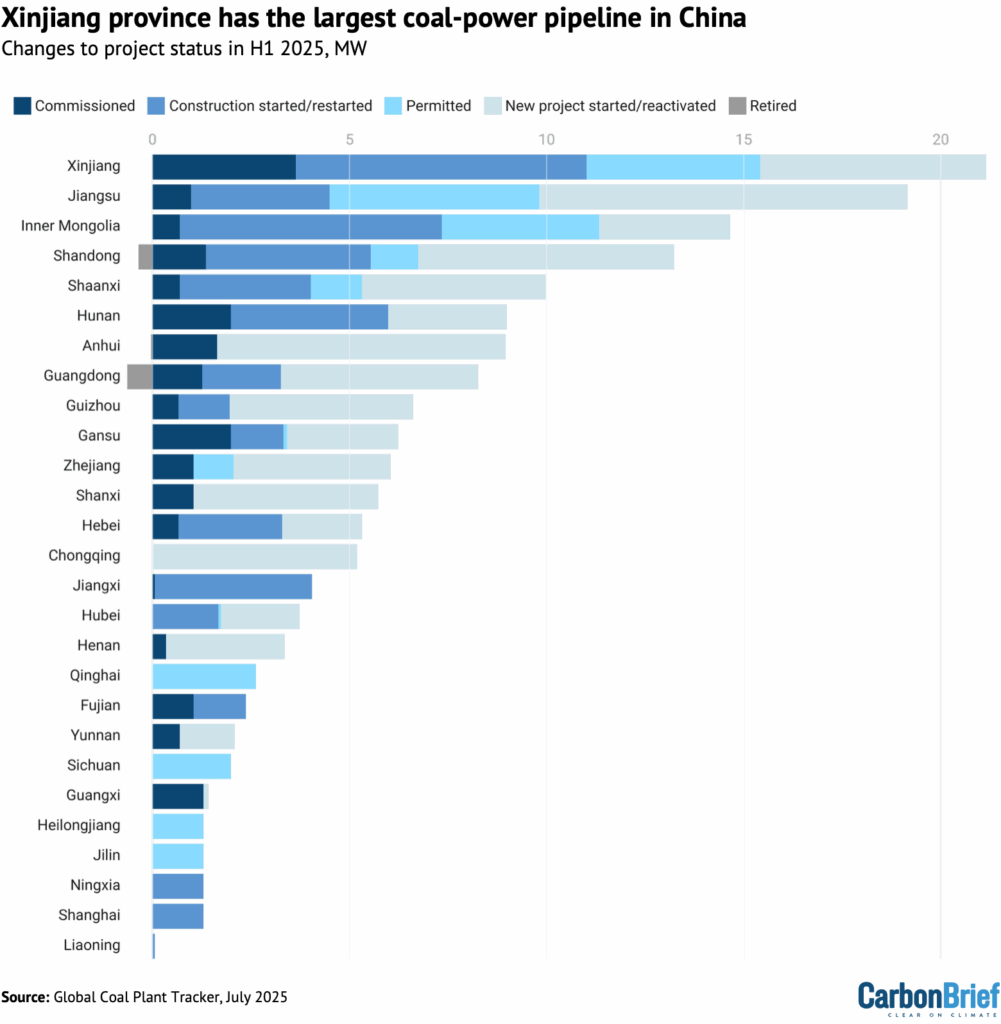
As discussed in GEM’s recent joint report with the Centre for Research on Energy and Clean Air (CREA), major coal-producing provinces, including Xinjiang, Inner Mongolia, Shandong and Shaanxi, are among the provinces commissioning and building the most new coal power, as shown in the chart below.
This expansion is backed by established permitting pathways, strong local power companies and a reliable flow of investment.
Yet, China has also been installing record amounts of clean energy, with more than 500GW of solar and wind power expected to come online in 2025. The increased generation from solar and wind power exceeded the increase in power demand in the first half of 2025, helping drive down China’s CO2 emissions by 1% compared to last year.
As clean energy has gained growing significance in China’s energy mix, more attention is being placed on renewables’ role in energy security and on coal power’s future as a flexible, supporting resource rather than as a primary generator.
Despite this narrative shift, coal remains deeply embedded in China’s power system, with little public discussion of its phasedown or eventual exit.
Coal-plant development is also on the rise in India, GEM’s tracker shows.
Commissioning of new coal plants in the country in H1 2025 (5.1GW) has already exceeded all of last year (4.2GW), as shown in the chart below.
Proposed coal-power capacity in India has also been on the rise, led by a record 38.4GW of coal-plant proposals in 2024 – driving up proposed coal capacity to over 92GW as of July 2025.
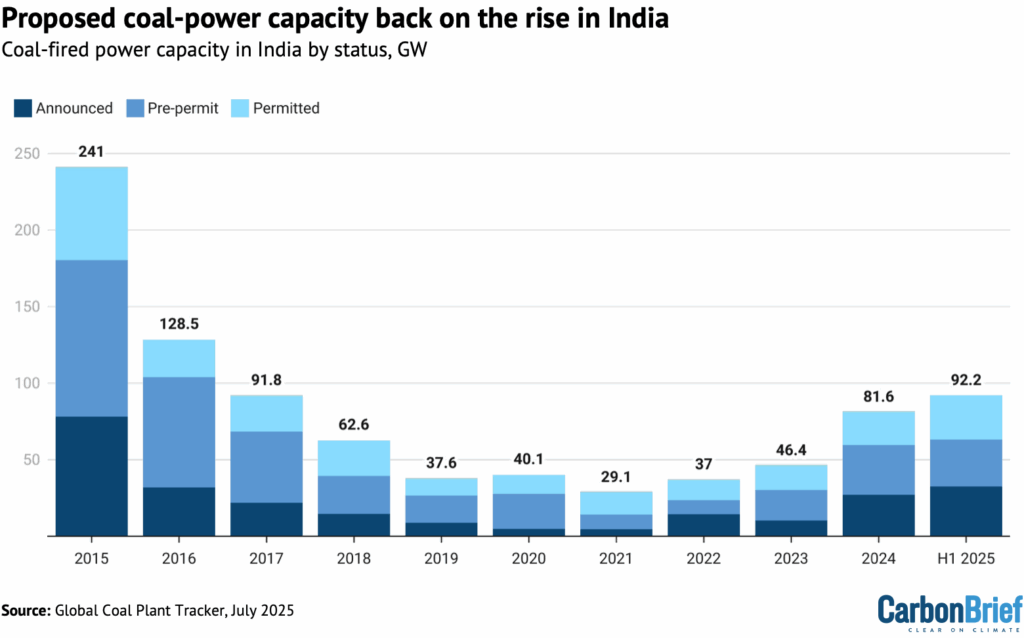
Retirements also remained sluggish in India, with 0.8GW retired in H1 2025 and just 0.2GW retired in 2024 and 2023, according to GEM’s tracker.
The decline follows 2023 guidance by India’s Central Electricity Authority (CEA) advising power utilities not to retire any thermal power capacity until 2030. In 2025, the country’s environment ministry again delayed long-pending sulfur dioxide regulations on coal plants.
Yet India also added more than 28GW of wind and solar power in 2025, a nearly 50% increase over the previous year. Despite the growth, the Indian government has stated that it is planning a coal expansion, with coal use not projected to peak until 2040, according to India’s Ministry of Coal.
In both China and India, coal retains its policy support, with clean energy framed, not as a replacement, but as a supplement – reinforcing a dual-track energy strategy that postpones difficult decisions on coal phaseout.
The US goes big on ageing coal plants
Like China and India, the US under President Donald Trump is also supporting coal power. Unlike China and India, however, the US has reversed course on clean energy in the first half of 2025.
During his tenure, former US president Joe Biden reached an agreement with other G7 nations to phase out coal power by 2035, offered incentives for clean energy under the Inflation Reduction Act (IRA) and moved to finalise pending power plant regulations – effectively helping replace the nation’s ageing coal plants with lower-cost solar and wind power while boosting domestic cleantech manufacturing.
The Trump administration has moved to derail Biden’s agenda by phasing out the clean energy tax credits, repealing coal plant regulations and slowing or halting solar and wind power permitting and financing.
It has also been using “emergency powers” to keep coal plants online, racking up $29m in costs to extend the life of Michigan’s Campbell plant through the summer – costs the utility is seeking to pass on to ratepayers for power the grid operator said was not needed.
Despite the political support for coal, the US remains on track to retire more coal power in 2025 than in 2024, with 3.7GW retired as of July.
Whether this trend continues in an increasingly uncertain environment for clean energy remains to be seen, as plant closures are often part of long-term plans and economic considerations, usually extensively negotiated with state regulators and based on broader considerations than just current federal policy.
In all, US utilities are slated to close nearly 100GW of coal capacity by 2035, as shown in the chart below. By then, the average age of a US coal plant will be 55 years.
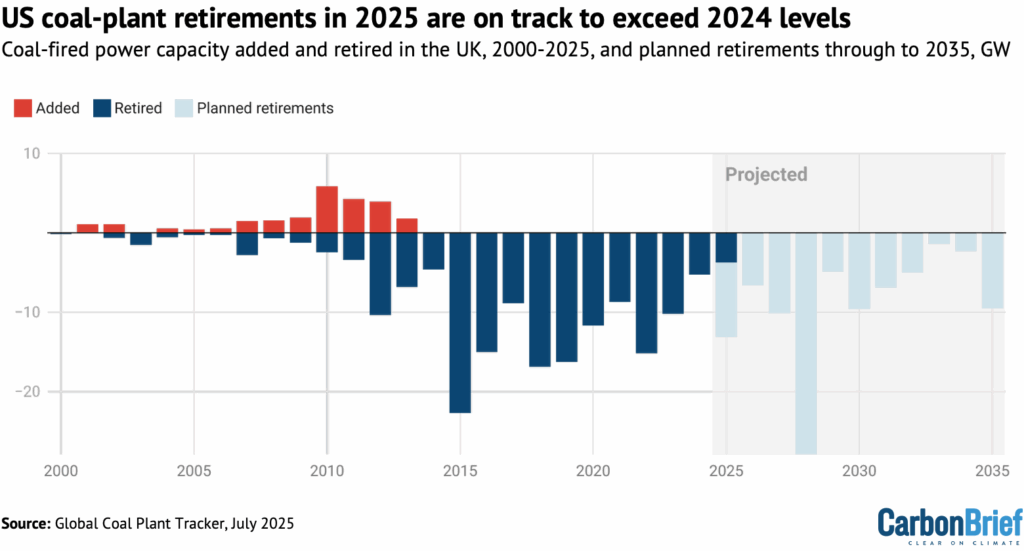
The US also saw a new coal plant proposal in H1 2025, bringing the total to three proposals according to GEM’s tracker, the most of any OECD country. All three plan to incorporate carbon capture and storage, although none have the necessary permits for construction.
Just energy transition partnerships advance despite hurdles
Despite delayed documentation, ongoing negotiations and the withdrawal of the US from International Partner Group participation, JETP agreements in Vietnam, Indonesia and South Africa are all continuing to progress.
In Vietnam, three clean-energy investment projects have officially penned financing agreements as of July 2025, getting the country one step closer to mobilising JETP capital.
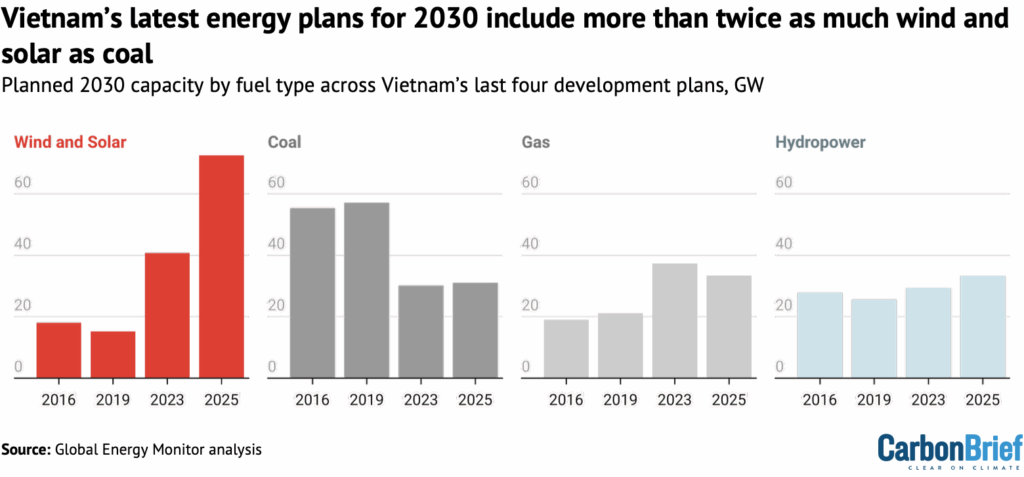
Just a few months prior, Vietnam released an adjustment to its latest power development plan, which featured substantial increases in projected wind and solar capacity and a modest increase in projected hydropower capacity.
However, the plan also includes a 1GW increase in projected coal power by 2030, as shown in the chart below.
The new figure for peak coal, 31.1GW, coincides with the interest from state-owned utility EVN to revive a coal plant previously considered to be cancelled.
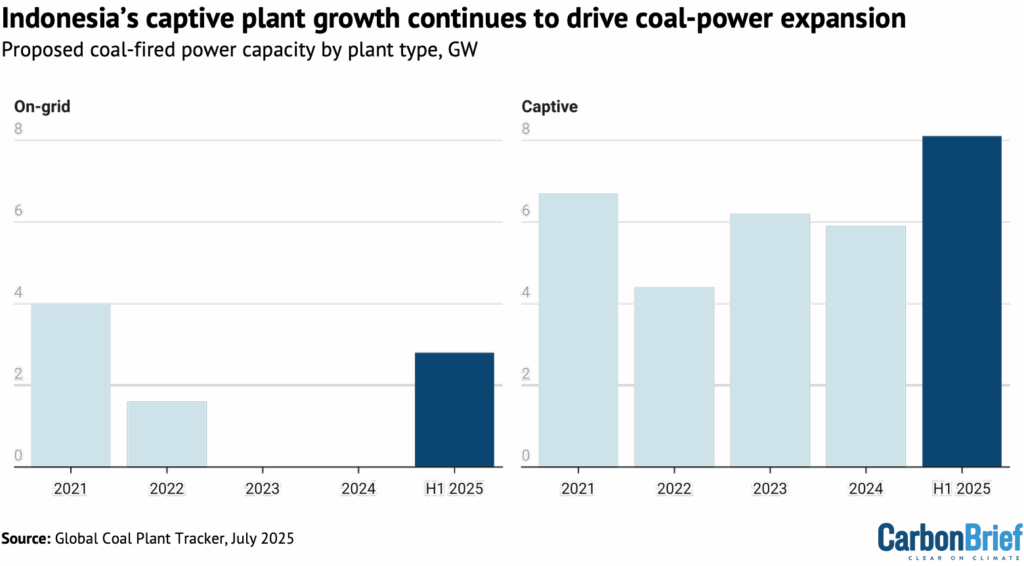
In Indonesia, the release of the latest electricity supply business plan (RUPTL 2025–2034) in May 2025 resulted in a spike in new and revived proposals for on-grid coal capacity. This was alongside the continued growth of off-grid, captive-coal plant proposals to power industrial areas, as GEM’s tracker shows.
Accounting for these captive-coal plants in Indonesia’s JETP documentation has presented a challenge, but Indonesia’s JETP secretariat has reiterated that updates to the country’s JETP comprehensive investment and policy plan are ongoing through the first six months of 2025 to address emissions from captive plants and incorporate efficiency targets.
Disparity remains between the government’s stated renewable energy ambitions and the reality of present advancements at the project level. Presidential regulation 112/2022 targets a 2050 national coal phaseout date in Indonesia and President Prabowo Subianto has more recently made overtures to an even faster 2040 coal phaseout.
Meanwhile, Indonesia’s proposed coal-power capacity grew by 5.1GW in H1 2025, to 17.1GW overall, as shown in the chart below.
In South Africa, the government has also reiterated its commitment to its JETP agreement. While Vietnam and Indonesia have substantial numbers of recently built coal plants and plants in continued development, South Africa operates a fleet of old, unreliable coal plants.
World Bank-linked funding for South Africa’s energy transition was approved in June 2025. While solidifying a climate investment fund, the plan also included the delayed closure of three coal plants that already average more than 50 years of age (Camden, Hendrina and Grootvlei).
All three countries are continuing down the dual paths of simultaneously extending coal’s lifetime and maintaining just energy transition commitments, banking on “all of the above” approaches and, ultimately, causing misalignment with JETP principles.
Yet, the continued progress of their just energy transition programs, despite global political and economic volatility, is a strong indicator that policy and planning priorities could soon align towards the phaseout of coal.

The post Guest post: China and India account for 87% of new coal-power capacity so far in 2025 appeared first on Carbon Brief.
Guest post: China and India account for 87% of new coal-power capacity so far in 2025

Drought and heatwaves occurring together – known as “compound” events – have “surged” across the world since the early 2000s, a new study shows.
Compound drought and heat events (CDHEs) can have devastating effects, creating the ideal conditions for intense wildfires, such as Australia’s “Black Summer” of 2019-20 where bushfires burned 24m hectares and killed 33 people.
The research, published in Science Advances, finds that the increase in CDHEs is predominantly being driven by events that start with a heatwave.
The global area affected by such “heatwave-led” compound events has more than doubled between 1980-2001 and 2002-23, the study says.
The rapid increase in these events over the last 23 years cannot be explained solely by global warming, the authors note.
Since the late 1990s, feedbacks between the land and the atmosphere have become stronger, making heatwaves more likely to trigger drought conditions, they explain.
One of the study authors tells Carbon Brief that societies must pay greater attention to compound events, which can “cause severe impacts on ecosystems, agriculture and society”.
Compound events
CDHEs are extreme weather events where drought and heatwave conditions occur simultaneously – or shortly after each other – in the same region.
These events are often triggered by large-scale weather patterns, such as “blocking” highs, which can produce “prolonged” hot and dry conditions, according to the study.
Prof Sang-Wook Yeh is one of the study authors and a professor at the Ewha Womans University in South Korea. He tells Carbon Brief:
“When heatwaves and droughts occur together, the two hazards reinforce each other through land-atmosphere interactions. This amplifies surface heating and soil moisture deficits, making compound events more intense and damaging than single hazards.”
CDHEs can begin with either a heatwave or a drought.
The sequence of these extremes is important, the study says, as they have different drivers and impacts.
For example, in a CDHE where the heatwave was the precursor, increased direct sunshine causes more moisture loss from soils and plants, leading to a drought.
Conversely, in an event where the drought was the precursor, the lack of soil moisture means that less of the sun’s energy goes into evaporation and more goes into warming the Earth’s surface. This produces favourable conditions for heatwaves.
The study shows that the majority of CDHEs globally start out as a drought.
In recent years, there has been increasing focus on these events due to the devastating impact they have on agriculture, ecosystems and public health.
In Russia in the summer of 2010, a compound drought-heatwave event – and the associated wildfires – caused the death of nearly 55,000 people, the study notes.

The record-breaking Pacific north-west “heat dome” in 2021 triggered extreme drought conditions that caused “significant declines” in wheat yields, as well as in barley, canola and fruit production in British Columbia and Alberta, Canada, says the study.
Increasing events
To assess how CDHEs are changing, the researchers use daily reanalysis data to identify droughts and heatwaves events. (Reanalysis data combines past observations with climate models to create a historical climate record.) Then, using an algorithm, they analyse how these events overlap in both time and space.
The study covers the period from 1980 to 2023 and the world’s land surface, excluding polar regions where CDHEs are rare.
The research finds that the area of land affected by CDHEs has “increased substantially” since the early 2000s.
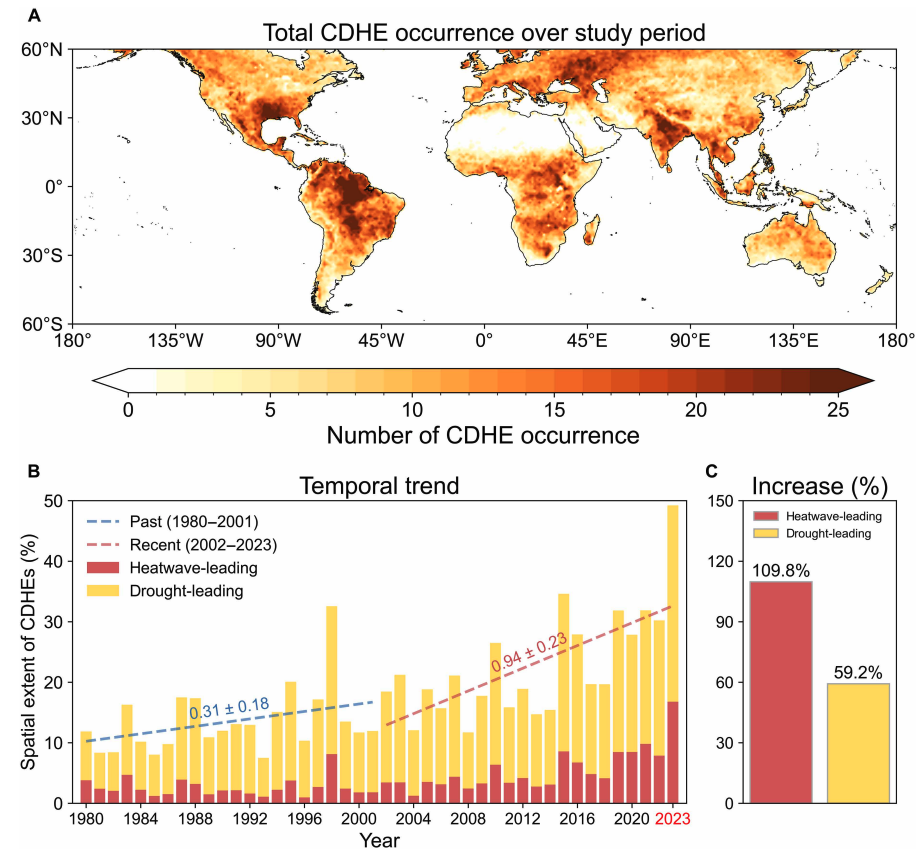
Heatwave-led events have been the main contributor to this increase, the study says, with their spatial extent rising 110% between 1980-2001 and 2002-23, compared to a 59% increase for drought-led events.
The map below shows the global distribution of CDHEs over 1980-2023. The charts show the percentage of the land surface affected by a heatwave-led CDHE (red) or a drought-led CDHE (yellow) in a given year (left) and relative increase in each CDHE type (right).
The study finds that CDHEs have occurred most frequently in northern South America, the southern US, eastern Europe, central Africa and south Asia.
Threshold passed
The authors explain that the increase in heatwave-led CDHEs is related to rising global temperatures, but that this does not tell the whole story.
In the earlier 22-year period of 1980-2001, the study finds that the spatial extent of heatwave-led CDHEs rises by 1.6% per 1C of global temperature rise. For the more-recent period of 2022-23, this increases “nearly eightfold” to 13.1%.
The change suggests that the rapid increase in the heatwave-led CDHEs occurred after the global average temperature “surpasse[d] a certain temperature threshold”, the paper says.
This threshold is an absolute global average temperature of 14.3C, the authors estimate (based on an 11-year average), which the world passed around the year 2000.
Investigating the recent surge in heatwave-leading CDHEs further, the researchers find a “regime shift” in land-atmosphere dynamics “toward a persistently intensified state after the late 1990s”.
In other words, the way that drier soils drive higher surface temperatures, and vice versa, is becoming stronger, resulting in more heatwave-led compound events.
Daily data
The research has some advantages over other previous studies, Yeh says. For instance, the new work uses daily estimations of CDHEs, compared to monthly data used in past research. This is “important for capturing the detailed occurrence” of these events, says Yeh.
He adds that another advantage of their study is that it distinguishes the sequence of droughts and heatwaves, which allows them to “better understand the differences” in the characteristics of CDHEs.
Dr Meryem Tanarhte is a climate scientist at the University Hassan II in Morocco, and Dr Ruth Cerezo Mota is a climatologist and a researcher at the National Autonomous University of Mexico. Both scientists, who were not involved in the study, agree that the daily estimations give a clearer picture of how CDHEs are changing.
Cerezo-Mota adds that another major contribution of the study is its global focus. She tells Carbon Brief that in some regions, such as Mexico and Africa, there is a lack of studies on CDHEs:
“Not because the events do not occur, but perhaps because [these regions] do not have all the data or the expertise to do so.”
However, she notes that the reanalysis data used by the study does have limitations with how it represents rainfall in some parts of the world.
Compound impacts
The study notes that if CDHEs continue to intensify – particularly events where heatwaves are the precursors – they could drive declining crop productivity, increased wildfire frequency and severe public health crises.
These impacts could be “much more rapid and severe as global warming continues”, Yeh tells Carbon Brief.
Tanarhte notes that these events can be forecasted up to 10 days ahead in many regions. Furthermore, she says, the strongest impacts can be prevented “through preparedness and adaptation”, including through “water management for agriculture, heatwave mitigation measures and wildfire mitigation”.
The study recommends reassessing current risk management strategies for these compound events. It also suggests incorporating the sequences of drought and heatwaves into compound event analysis frameworks “to enhance climate risk management”.
Cerezo-Mota says that it is clear that the world needs to be prepared for the increased occurrence of these events. She tells Carbon Brief:
“These [risk assessments and strategies] need to be carried out at the local level to understand the complexities of each region.”