

Die bisherigen Blogeinträge haben die atemberaubende und wunderschöne Arbeit der JellyWeb-Expedition gezeigt: Wir haben über farbenfrohe Kreaturen, hochmoderne Technologien und mutige Physiker allein unter Biolog:innen berichtet. Ja, unsere Projekte auf der Expedition MSM126 sind sehr vielfältig, und neben ihrer aufregenden Natur haben sie noch eine weitere Gemeinsamkeit: Sie alle produzieren tonnenweise Daten. Daten, die verwaltet und gepflegt werden müssen.
Ich will ehrlich sein: In einem Blog über eine Tiefsee-Biologie-Expedition würde ich den Beitrag zum Datenmanagement wahrscheinlich überspringen. Und ich denke, das ist einer der Gründe, warum es Jobs wie den meinen gibt – Wissenschaftler:innen lieben es, Daten zu generieren, aber ihre eigenen Daten zu verwalten? Das ist eine andere Geschichte.
Wenn eine wissenschaftliche Ausfahrt ein Piratenabenteuer wäre, wären die von uns gesammelten Daten der Schatz. Und alle hier an Bord arbeiten hart daran, die Schatzsuche erfolgreich zu gestalten. So bunt wie eine Schatztruhe voller Diamanten, Gold, Münzen und edlen Gewürzen, so vielfältig sind auch die von uns gesammelten Daten. Zum Beispiel sammeln Nahrungsnetz-Ökolog:innen wie Jamileh, Sonia und Florian (siehe Blogeintrag vom 21.02.2024) tausende individueller Organismen mit verschiedenen Netztypen aus unterschiedlichen Tiefen und Gebieten. Jeder einzelne Organismus durchläuft eine spezifische Prozedur, wird mehrmals fotografiert, möglicherweise in mehreren Experimenten verwendet und schließlich in noch mehr Unterproben für Museumssammlungen, Nahrungsnetze, genetische und andere Analysen aufgeteilt.
Es geht also nicht nur um einen Datensatz, sondern um eine Vielzahl von physischen Messungen, organischen Proben und Metadaten. Und wie es die gute wissenschaftliche Praxis verlangt, müssen diese Informationen im Auge behalten und gepflegt werden, um Verwirrung, falsche Datenerfassung oder im schlimmsten Fall Datenverlust zu vermeiden. Um eine Struktur in das bedrohliche Chaos zu bringen, verwenden Wissenschaftler:innen in der Regel standardisierte Protokolle, die alle notwendigen Informationen vor Ort abfragen.
Eine völlig andere Art von Daten sind Bilddaten. Eine wahre Besonderheit von MSM126 war die Vielfalt der optischen Geräteoperationen. Mit kamera- und sensorbestückten Geräten wie dem Meeresboden-Beobachtungssystem XOFOS, dem pelagischen Beobachtungssystem PELAGIOS und dem ROV PHOCA hatten wir drei Plattformen, die Untersuchungen des Meeresbodens und des Freiwassers durchführten – und dabei Terabytes an Bilddaten generierten.
Genauso wie physische Proben, wie gefangene Tiere oder gefiltertes Wasser müssen auch ihre digitalen Äquivalente ordnungsgemäß betreut werden und bestimmte Standards erfüllen, um in verschiedenen Forschungsprojekten verwendet werden zu können. Um nur einen zu nennen (der für alle Arten von Daten gilt), müssen die so genannten FAIR-Prinzipien eingehalten werden. FAIR bedeutet, dass die Daten auffindbar, zugänglich, interoperabel und wiederverwendbar sein sollen. Außerdem müssen alle digitalisierten Daten kopiert werden, um sicherzustellen, dass wir mehrere Backups haben. Man könnte also sagen, dass die eigentliche Arbeit erst beginnt, nachdem eine Probe vom Meeresboden an Bord gebracht wurde.

Eine echte Herausforderung während einer Forschungsfahrt ist nicht nur die Menge an stressiger Arbeit, sondern auch das Auftreten unvorhergesehener Situationen. Die schönsten Protokolle und durchdachtesten Arbeitsabläufe können der rauen Arbeitsrealität auf See zum Opfer fallen. Dann ist es von großem Vorteil, jemanden an Bord zu haben, der den Überblick über die geborgenen Schätze behält. Bei MSM126 hatte ich diese große Ehre. Es war das erste Mal in meinem jungen wissenschaftlichen Leben, dass ich diese Position innehatte, und ich denke, dass ich bis zum Ende der Reise genauso viel über Datenmanagement gelernt habe wie über den Umgang mit schwierigen menschlichen Interaktionen. Denn Datenmanager:innen müssen lästig sein. Als junge Datenmanagerin, die gerade ihr Masterstudium abgeschlossen hatte und ständig ihre älteren Kolleg:innen dazu bringen musste, das zu tun, was sie von ihnen wollte, brauchte ich ein gewisses Maß an Belastbarkeit und Kreativität.
Ich denke, es war ganz praktisch, dass ich eine Art dunkle Vergangenheit habe, denn eigentlich bin ich ausgebildete Meeresbiologin! Das kann durchaus hilfreich sein: Erstens habe ich Hintergrundwissen über eine ganze Reihe von wissenschaftlichen Aktivitäten hier an Bord und kann daher überschauen, was wir beim Umgang mit den Daten beachten müssen. Außerdem ist es sehr hilfreich, wenn man Artennamen in handgeschriebenen Protokollen entziffern muss (sorry, das musste ich einfach erwähnen). Zweitens bekommt man einen Eindruck davon, wie schwierig es ist, für die eigene Station, den Einsatz des Fanggerätes und die anschließende Verteilung der Proben verantwortlich zu sein und natürlich, dass alles dem eigentlichen wissenschaftlichen Ziel dienen muss.
Obwohl eigentlich alle Beteiligten ihre Daten sicher und unversehrt wissen wollen, dachte ich mir, dass ein bisschen Werbung für unsere Datenerfassungsstation nicht schaden könnte. Zum Beispiel mit dem Slogan „Dateneingabe ist so cool und hat mich von meinen Rückenschmerzen geheilt“ oder indem wir einen Monitor mit einem ROV-Livestream neben dem Datenlaptop aufstellen, um die Eingabe von hunderten Zeilen Metadaten in eine riesige Excel-Datei zu erleichtern…

Ich denke, wir alle haben die Bergung der riesigen Menge an Schätzen, die wir während der MSM126 erbeutet haben, gut gemeistert und mir bleibt nur noch zu sagen: Macht eure Backups! Vielen Dank fürs Lesen!
Sophie Valerie Schindler, Datenmanagerin (und heimliche Biologin)
Auge um Auge, Zahl um Zahl – das verborgene Wirken der Datenmanagerin


Intro
At the western tip of Luzon, which is the biggest island of the Philippines, lies the small coastal town of Bolinao. Tourists seldom find their way here as it takes around seven hours to get here by bus from Manila. Still, you can spot foreigners walking around every now and then, but they really stand out among the Filipinos. A reason for their presence is often that they study or work at the Bolinao Marine Laboratory (BML), which belongs to the University of the Philippines (UP). It is one of the seven research institutions participating in the GAME project 2026. Every year, GAME brings together Master’s students from all over the world to experience different cultures and conduct globally replicated experiments in marine ecology.
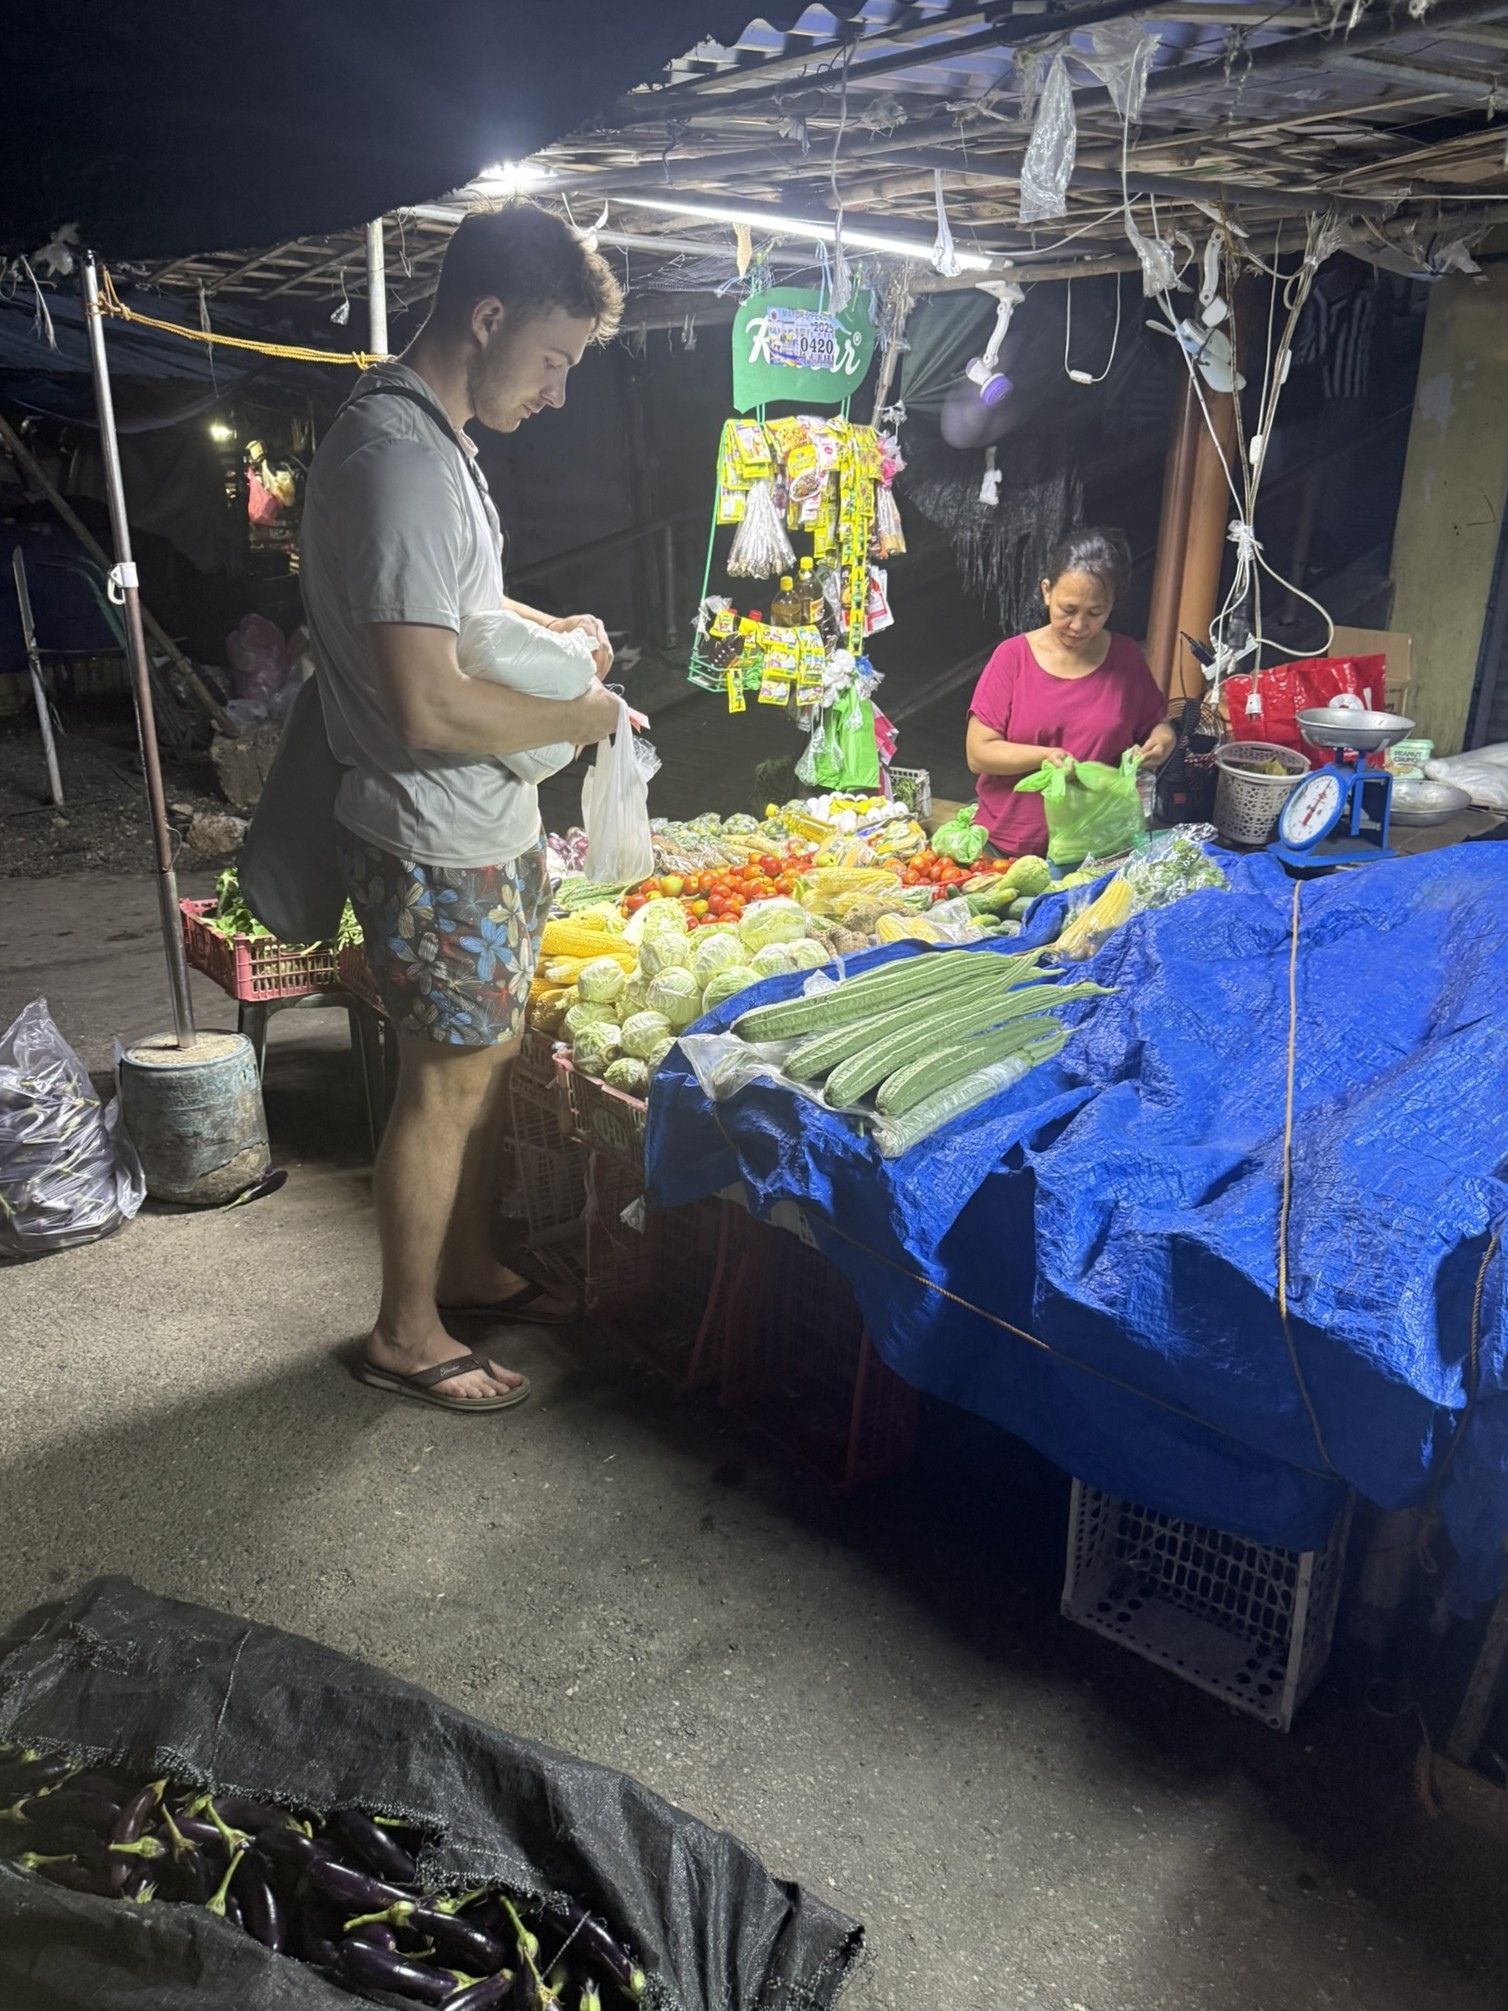
This year’s Team Philippines consists of Jona, a Filipino master student of Marine Biology at the University of the Philippines, and Konstantin, a German student who is enrolled in the Master programme „Ecology and Evolution“ at Freiburg University. As part of GAME 2026, we are currently staying at BML for 6 months to run experiments about the influence of underwater soundscapes on the colonization of marine hardbottoms.
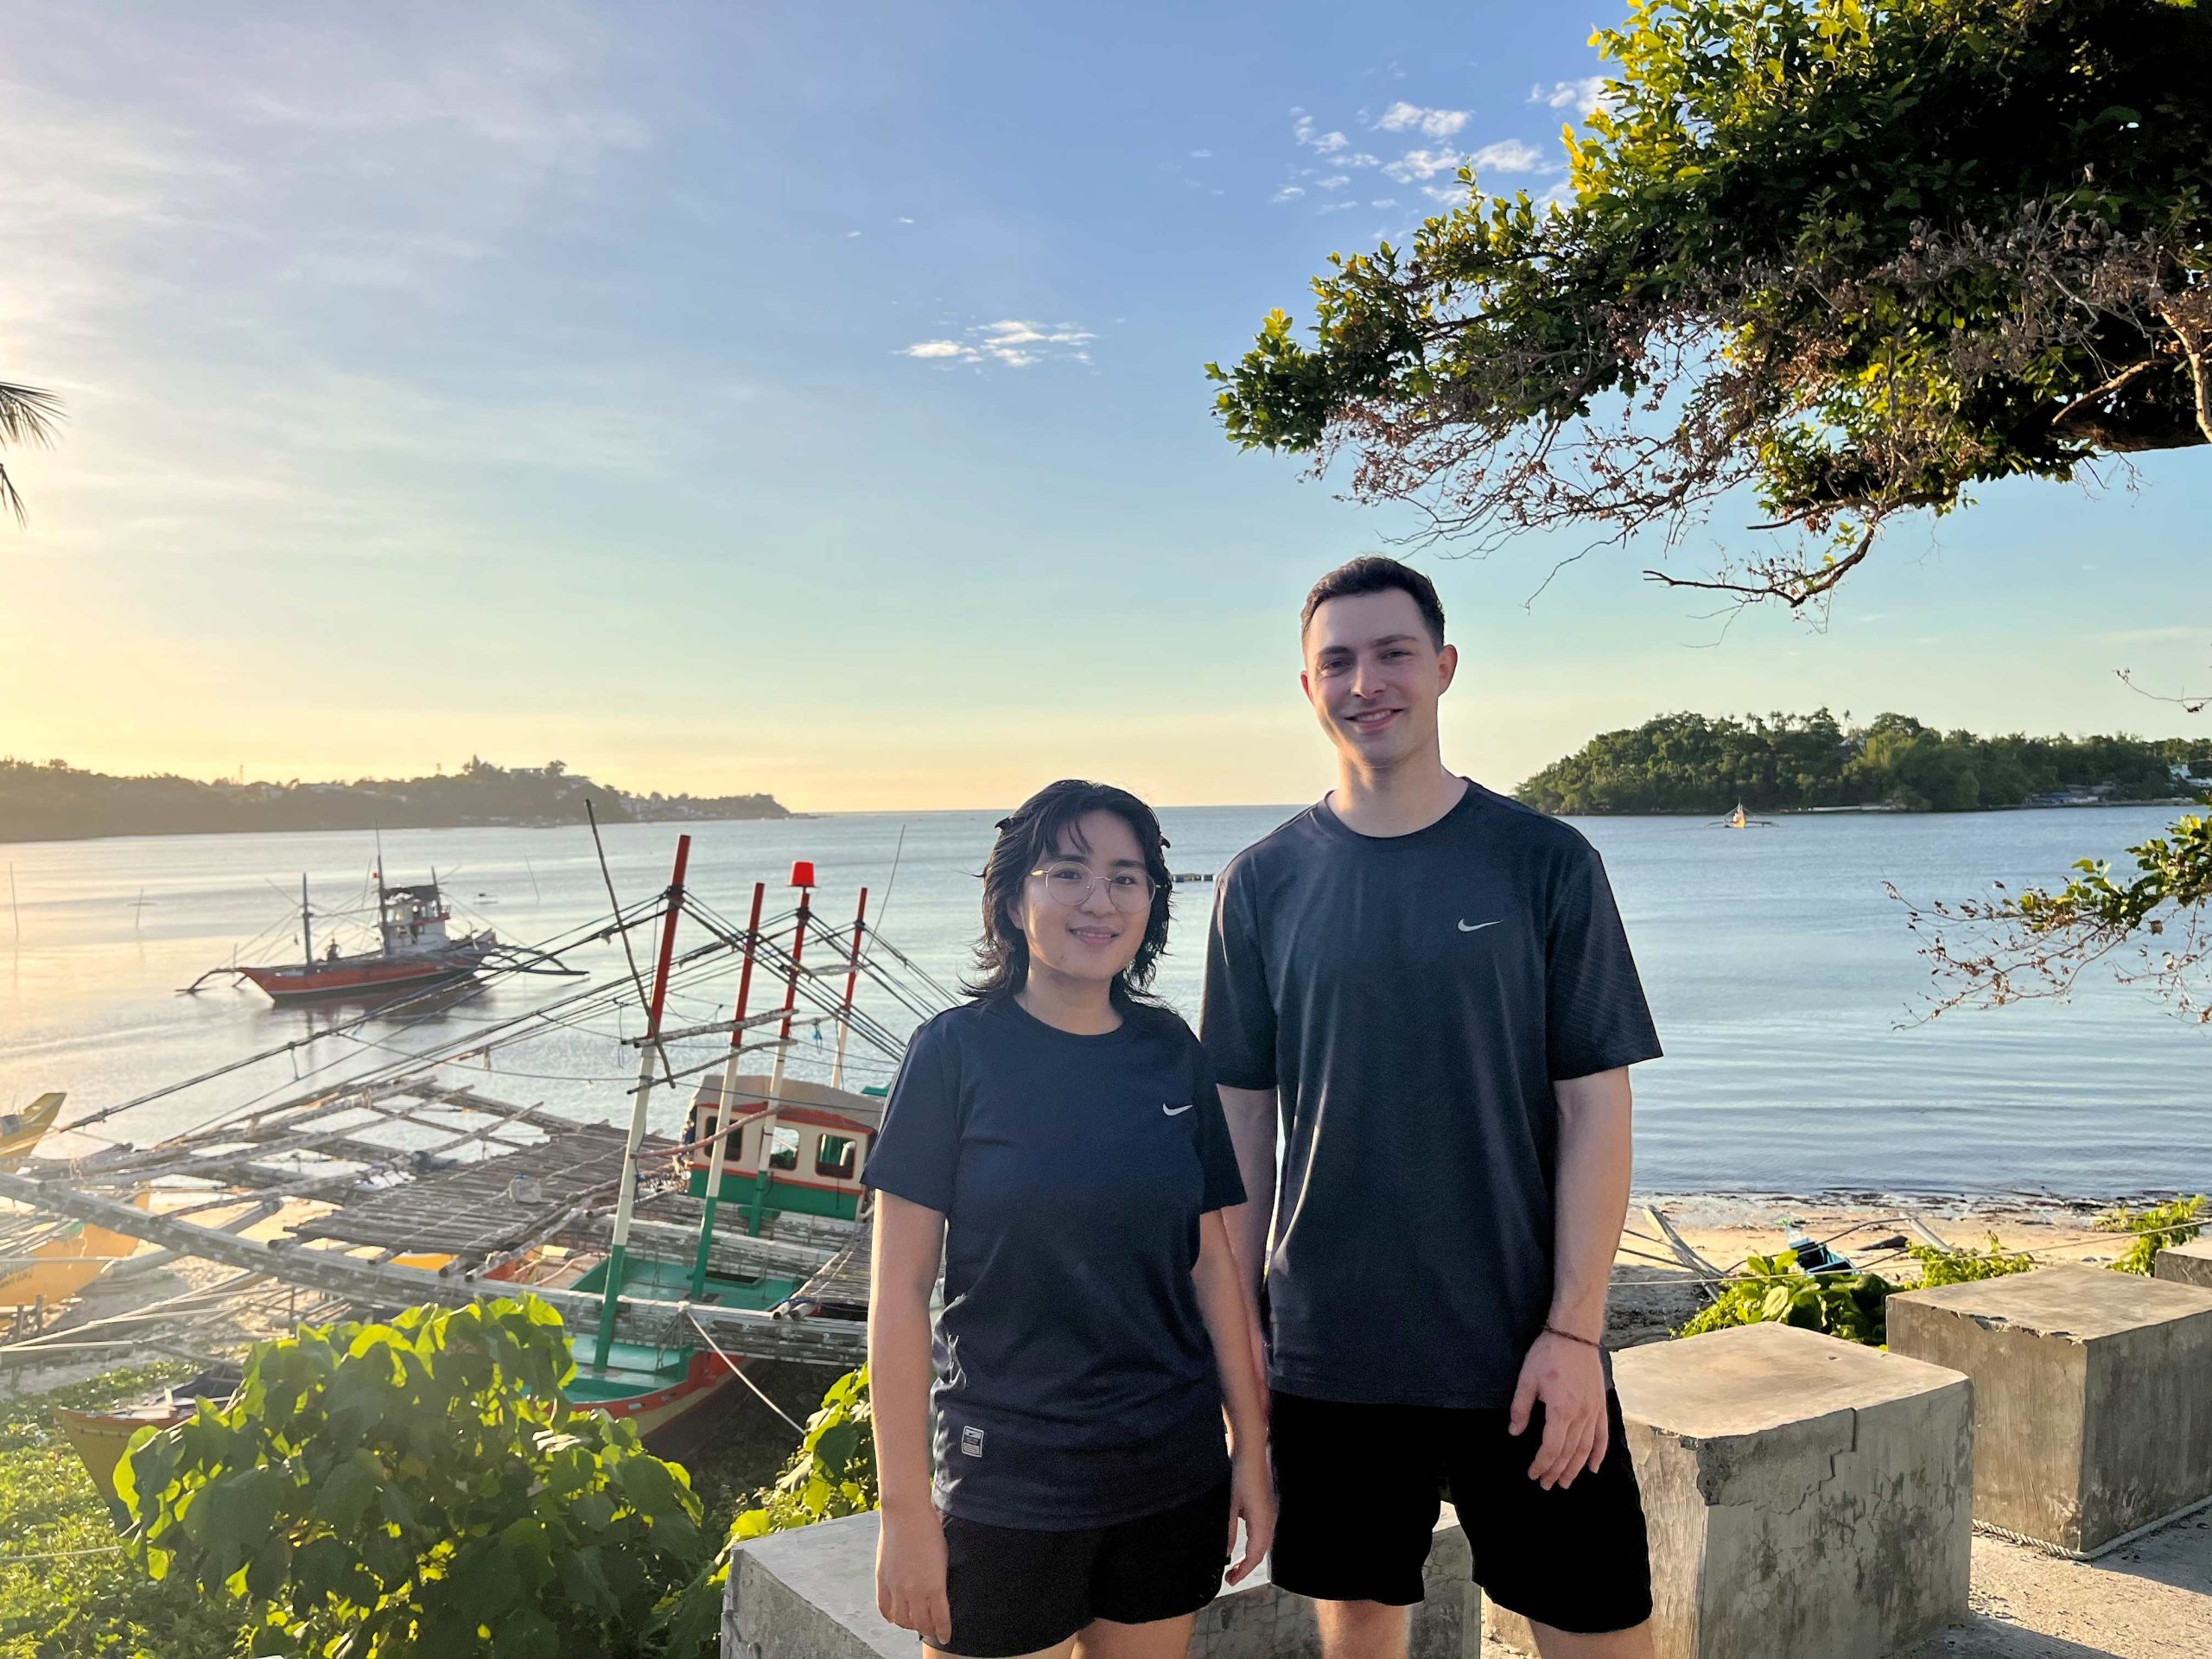
Where are we?
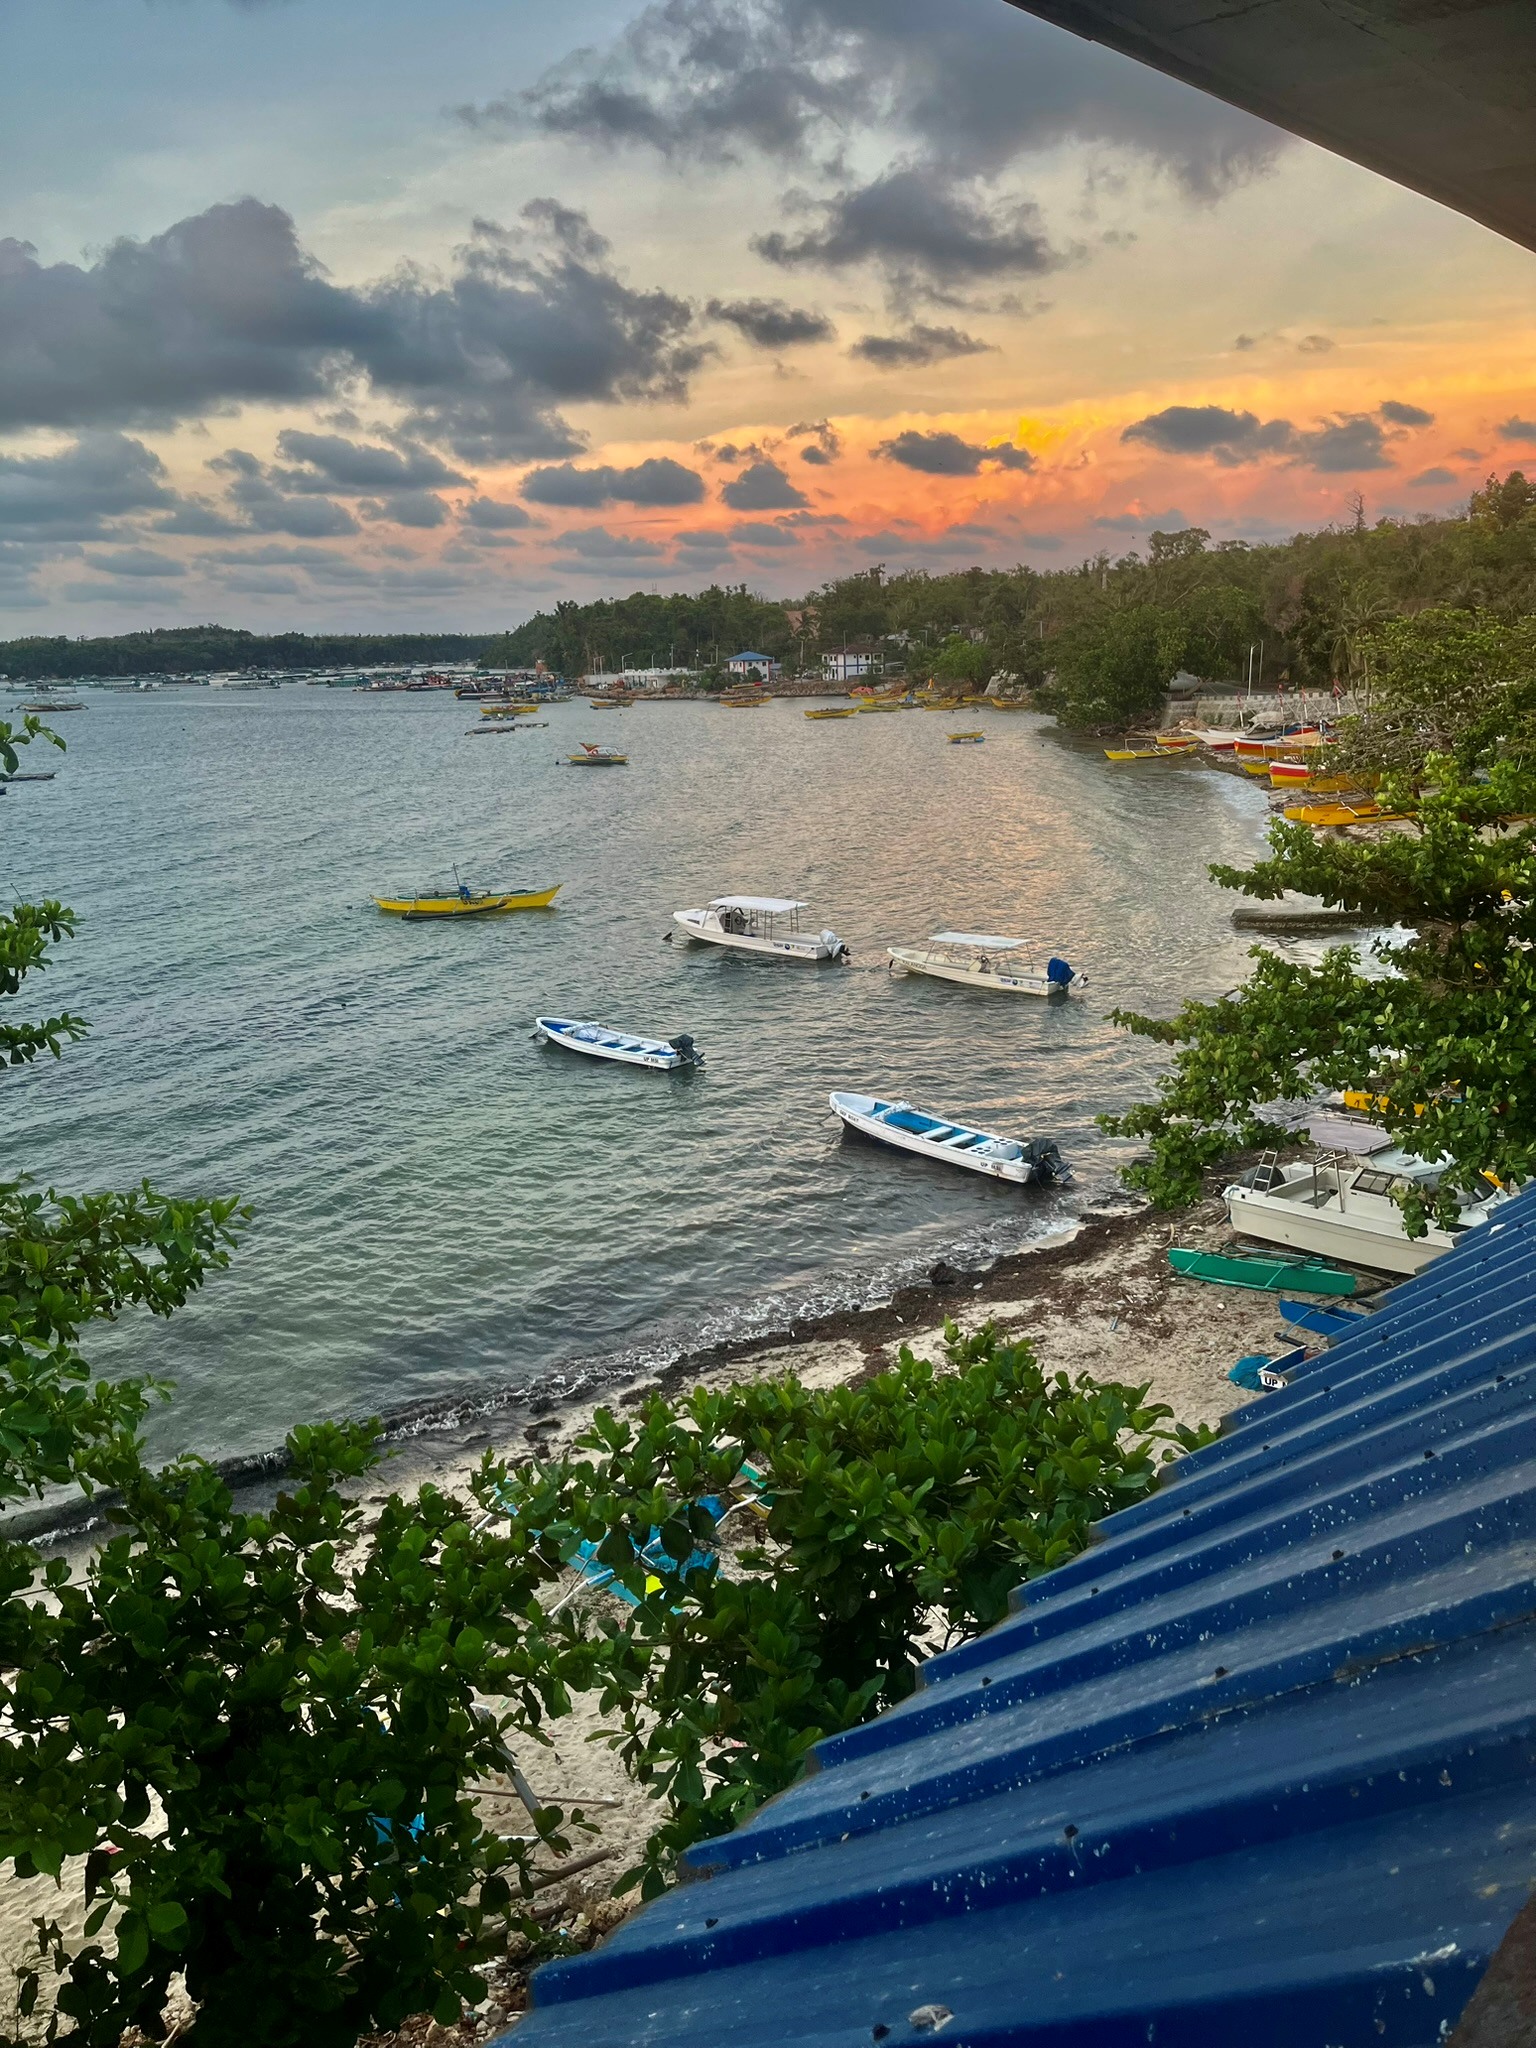
At the BML, we live in a dormitory together with many other students and scientists mostly from the Philippines and a few international interns. At almost any time of the day there is someone in the kitchen to hang out with, eat together, or simply have a chat. It is easy to make friends in this little community. The way to work is just a short walk along a forest path, where we can pick mangos for a snack and spot butterflies, birds, or even wild macaques climbing through the trees. After crossing a street, we reach the institute. But instead of enjoying the cool temperatures of the laboratories, we spend most of our working days outside, doing fieldwork in or near the water.
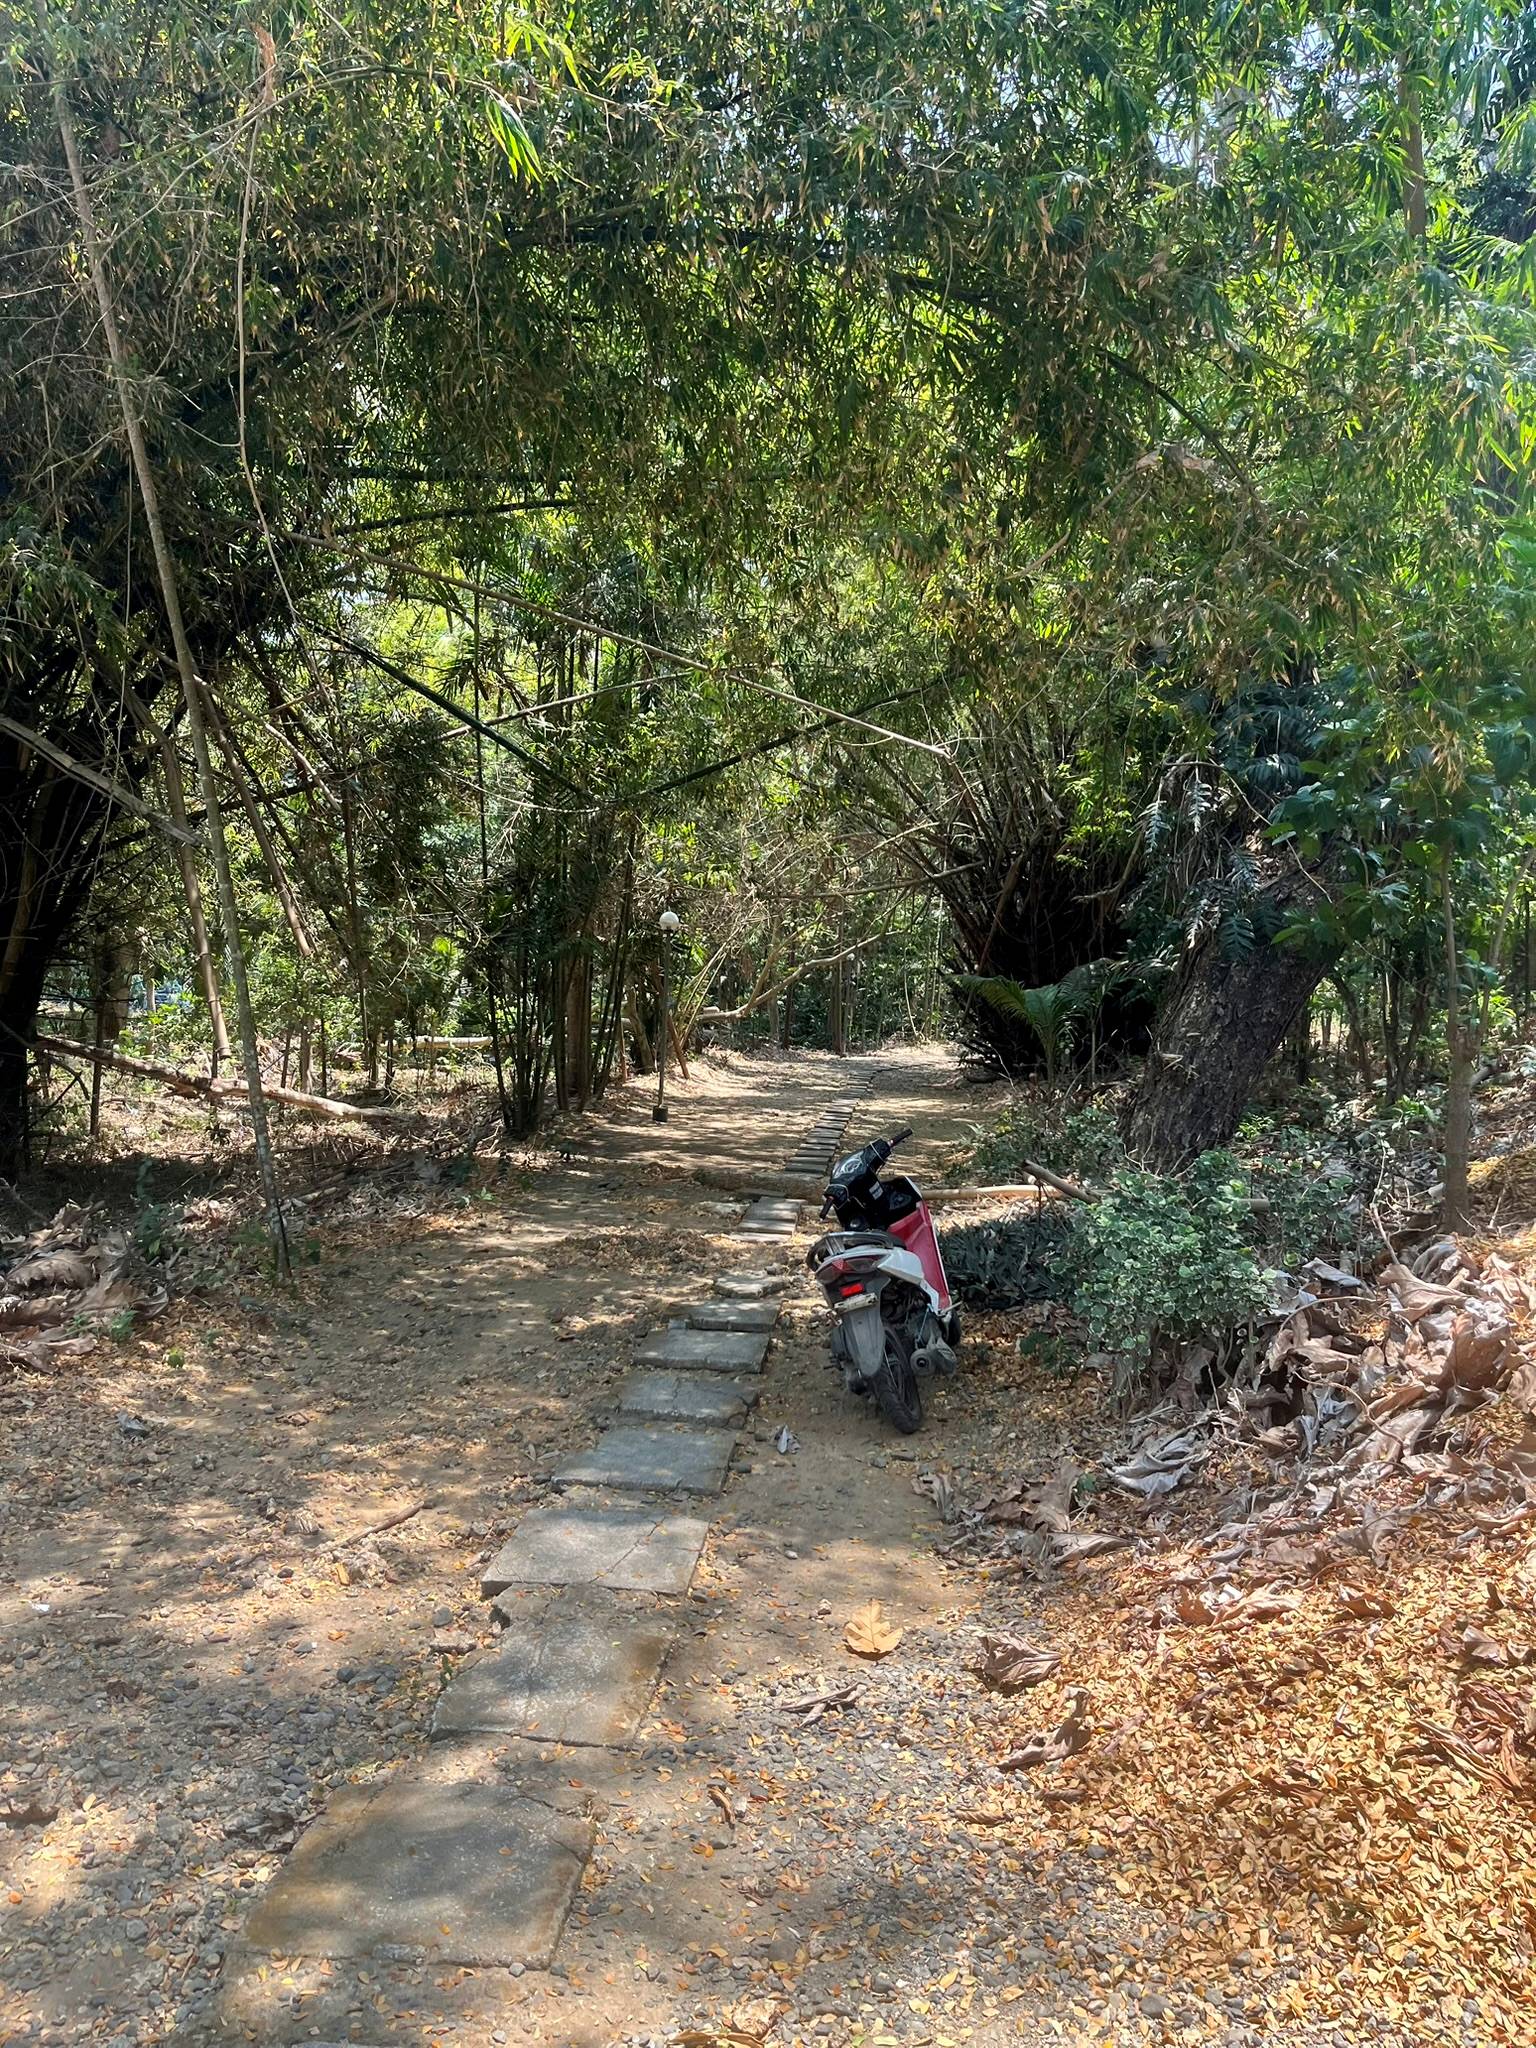
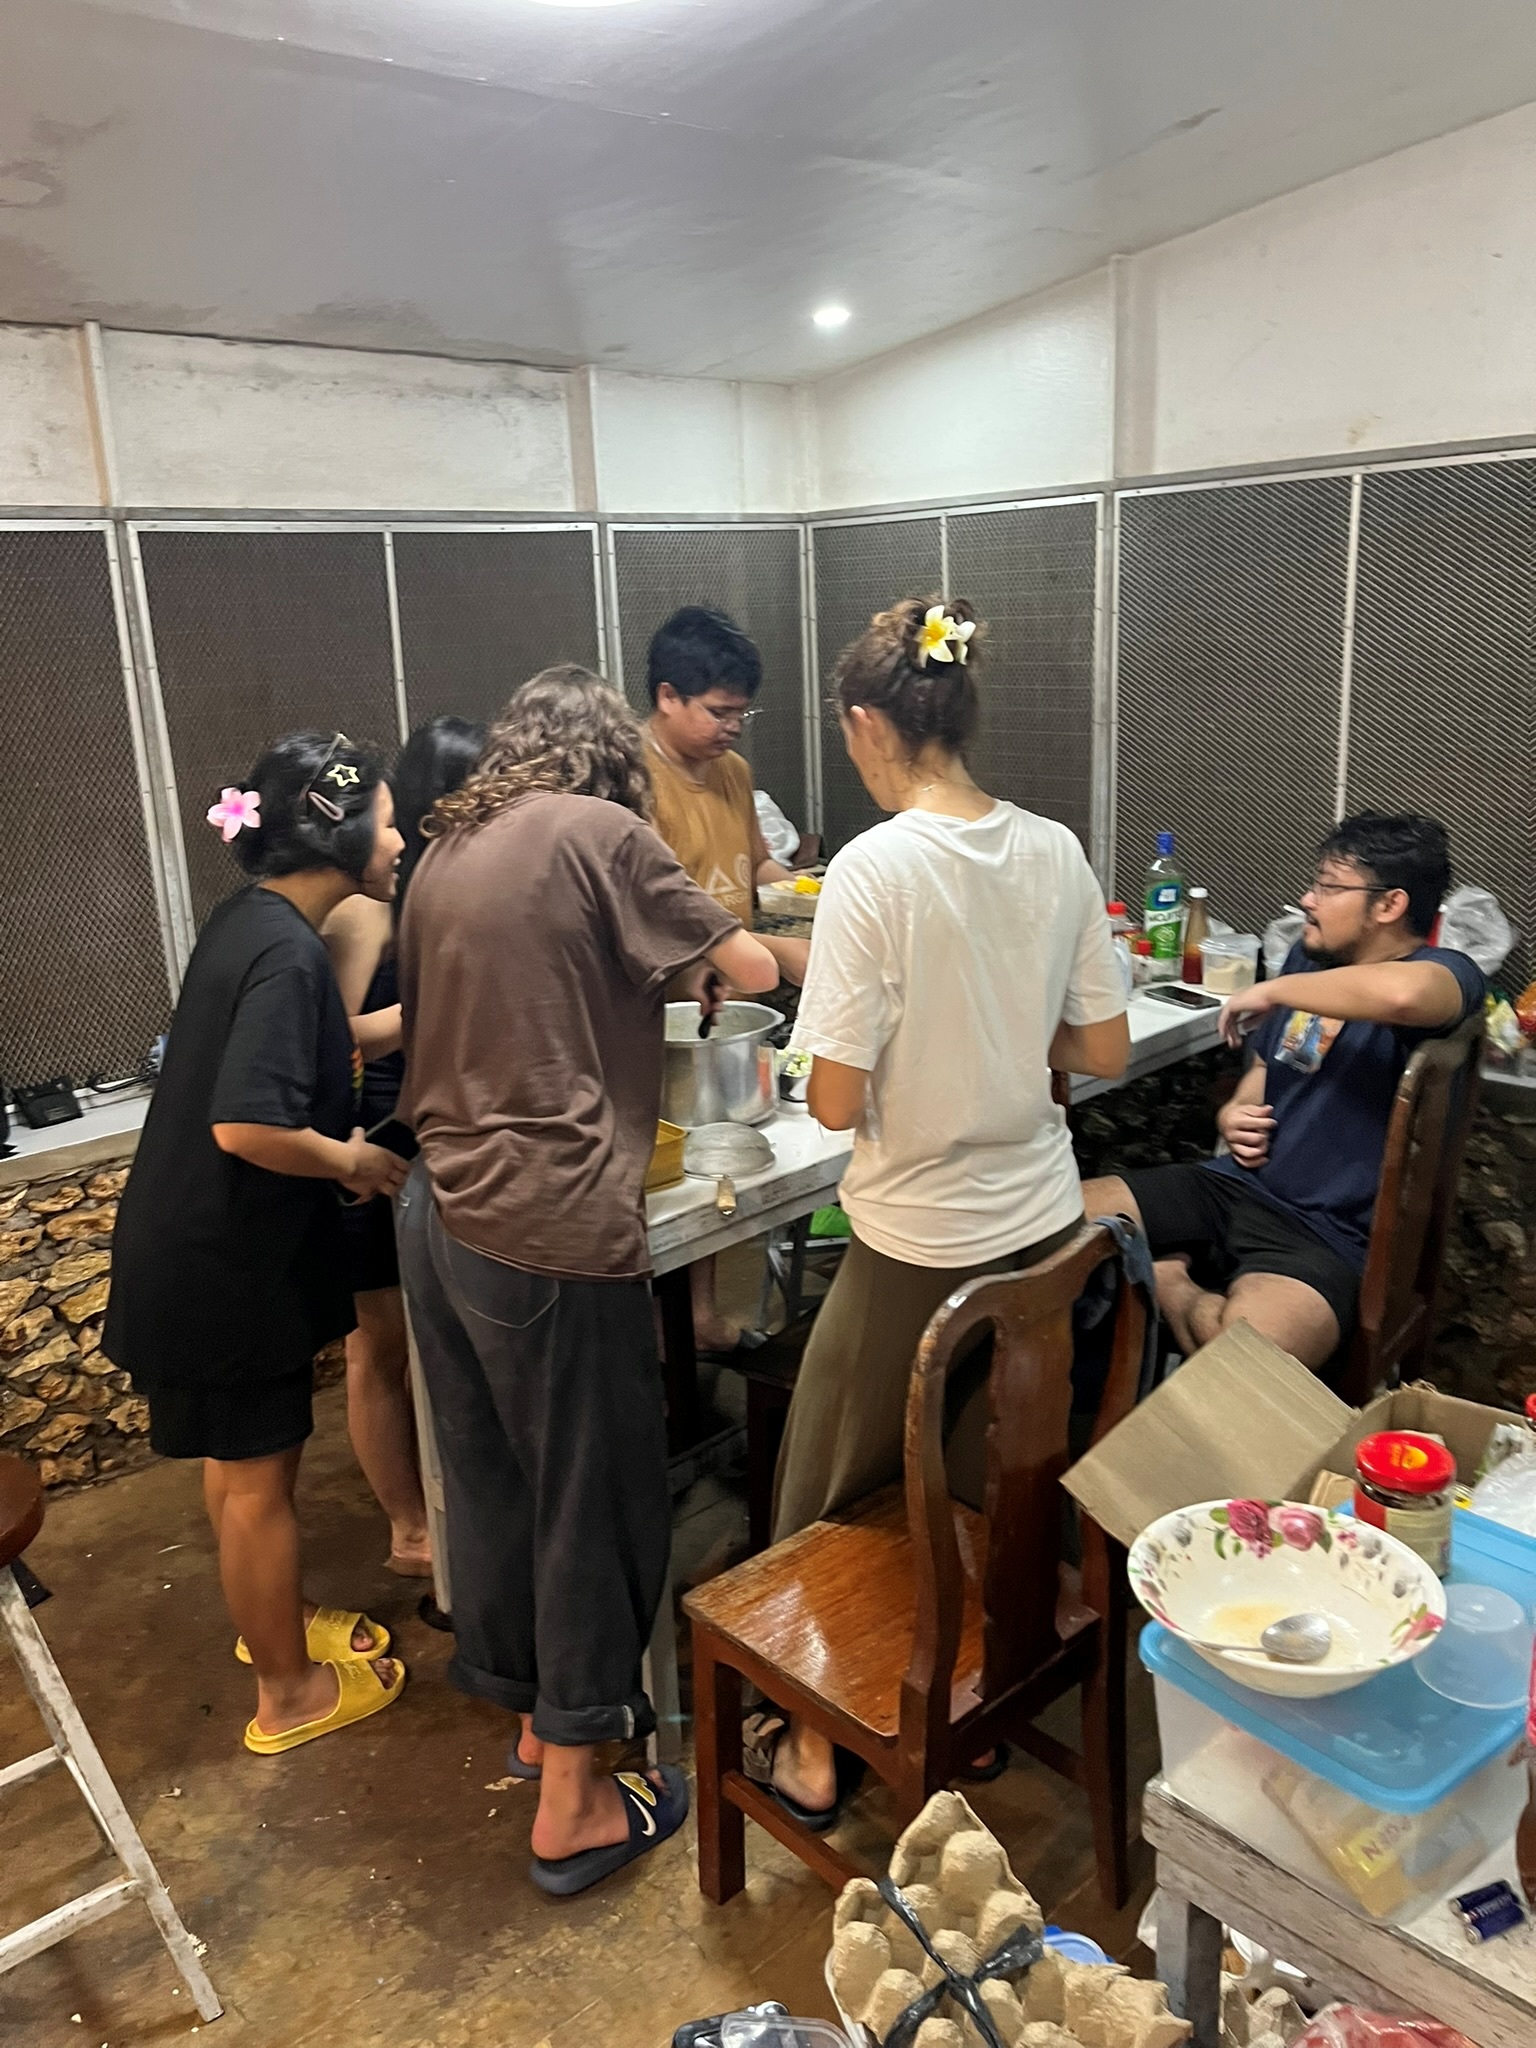
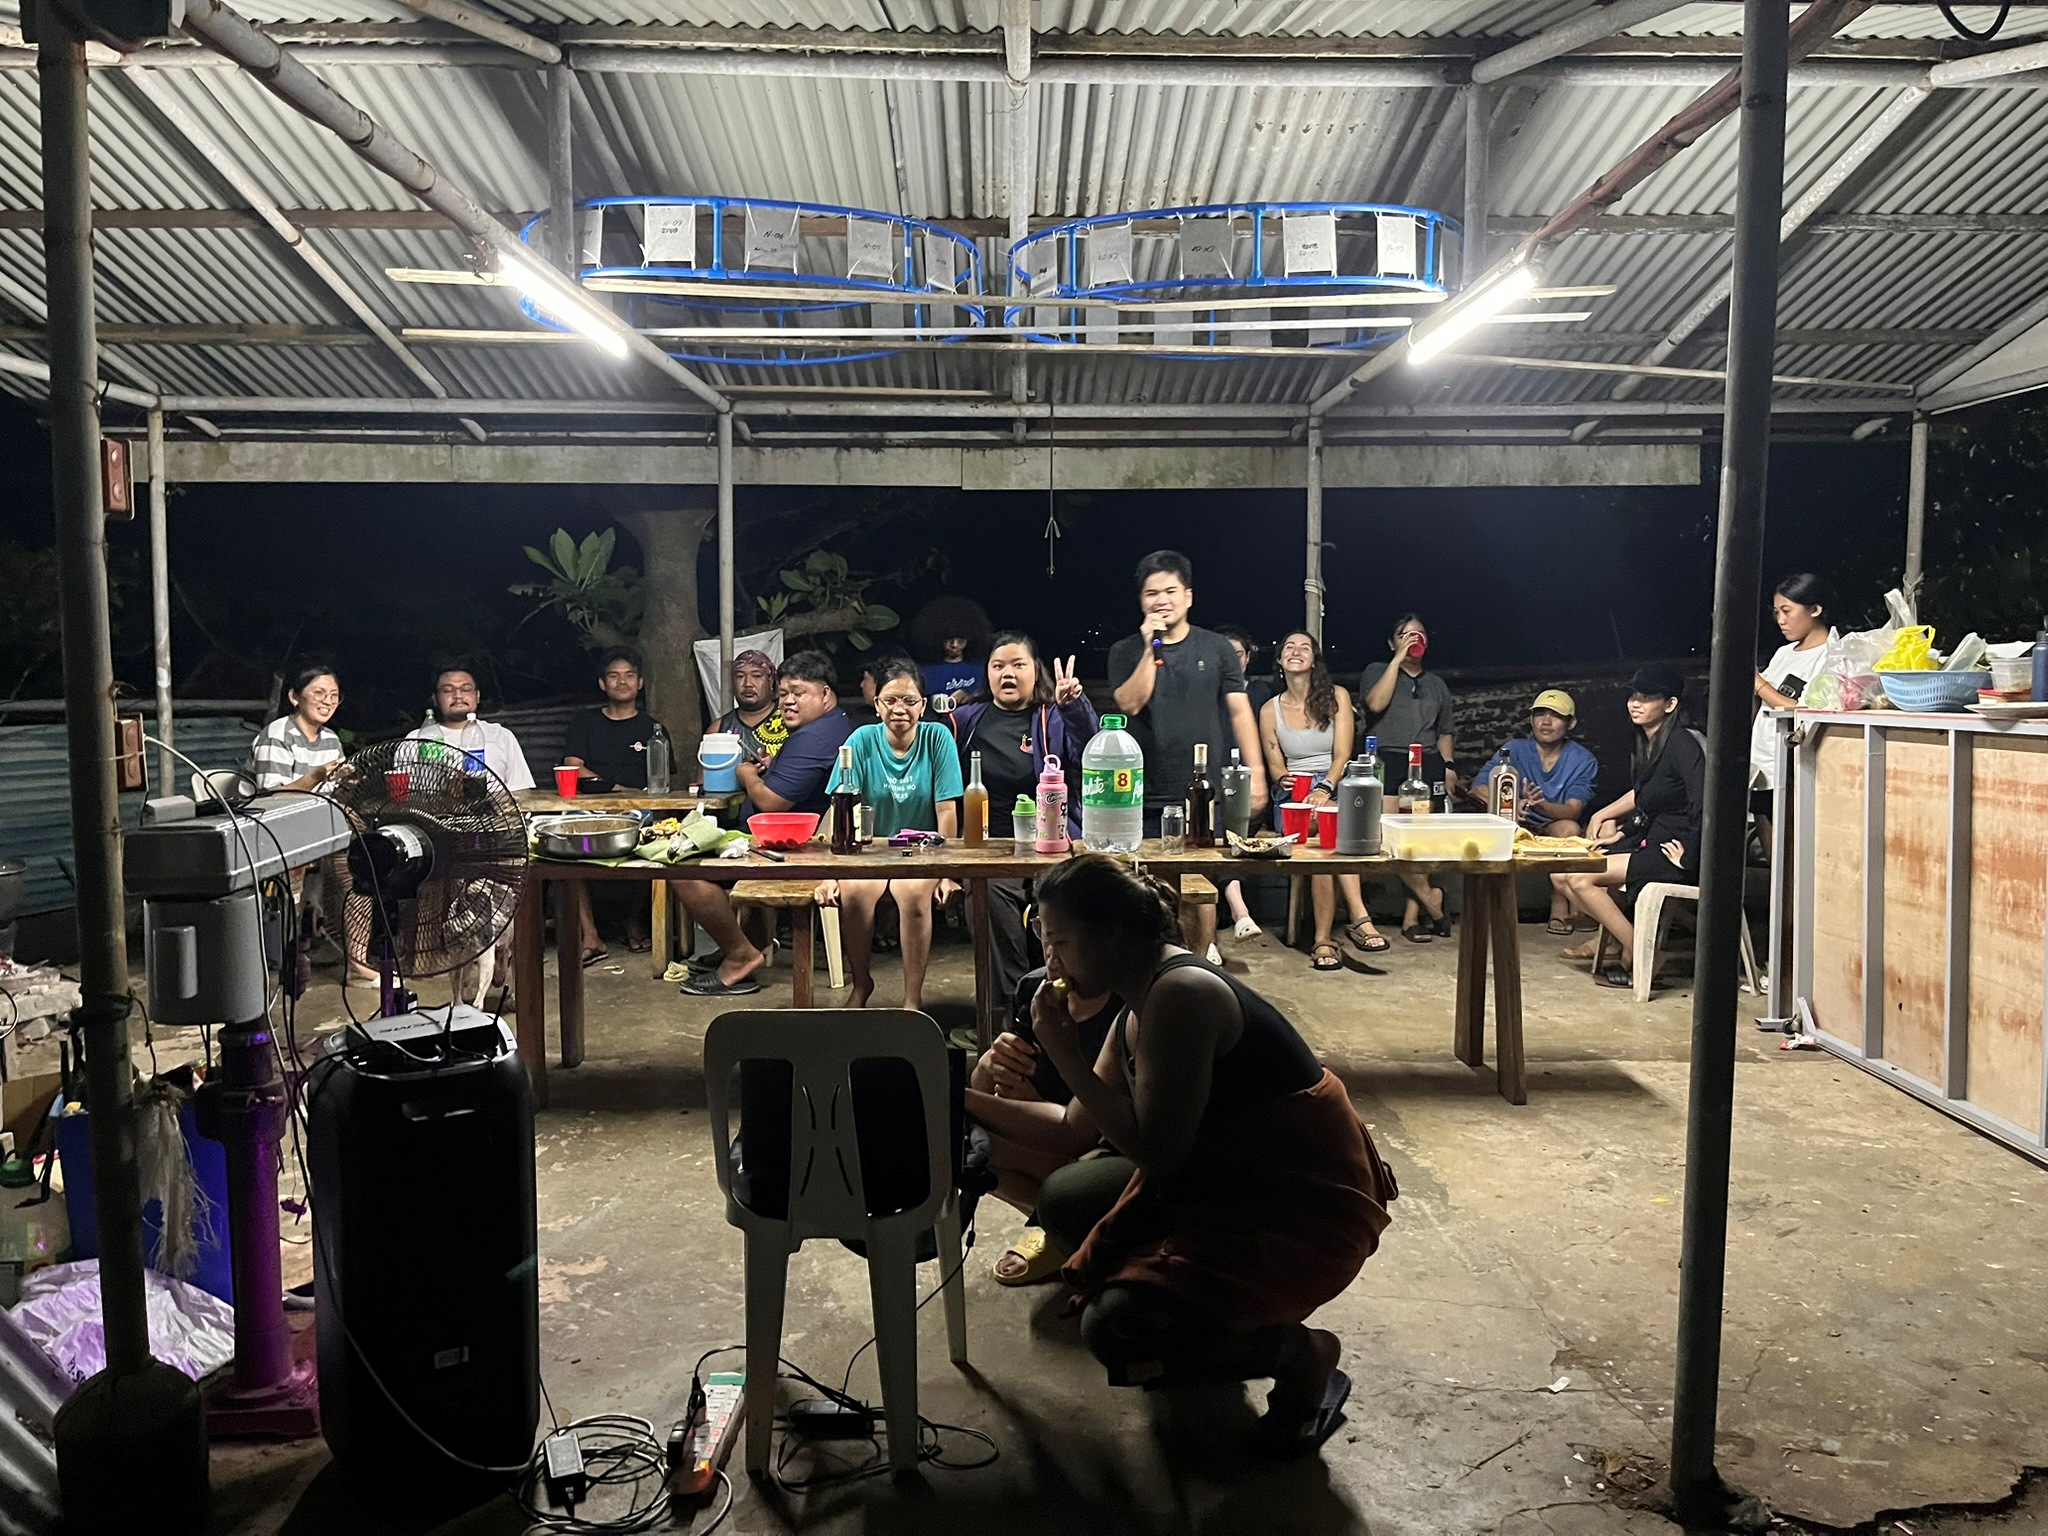
On Fridays, Konstantin experiences real Filipino culture during an almost weekly party at the institute with karaoke and lots of food and drinks. And Jona even brought some German culture to the Philippines by baking German bread for everyone.
What do we do?
Even though Bolinao is a remote place, it can get quite loud. Tricycles and jeepneys pass by, children play basketball in the streets, and karaoke can be heard almost everywhere and at any time. But just a few meters offshore, the soundscape changes. Beneath the surface of the ocean, you enter a world filled with sounds that are not so familiar to humans. When you dive down, alongside the rhythm of your own breathing, you might hear the crackling snaps of shrimp, the grunts of fish, or the rumble of waves rolling overhead. Together, these sounds form a natural underwater symphony which, however, can easily be interrupted by the noise of passing boats.
Marine organisms use sounds to communicate and to gather information about their environment, and there is growing evidence that this also applies to the larvae of sessile invertebrates such as mussels, barnacles and tunicates. During their pelagic life they are presumably able to use sounds for finding their way to suitable habitats, in which the sessile adult life stage can survive and reproduce. But what happens when these natural soundscapes are disturbed by anthropogenic noise? And what is the effect when the soundscape in a degraded reef gets enriched with sounds of a healthy coral reef?
In our experiments, which we just finished a few days ago, we investigated how different underwater soundscapes influence the colonization of hard substrata by the larvae of marine invertebrates. For this, we placed PVC settlement panels in the water and exposed them to playbacks of either boat noise, or amplified recordings from healthy coral reefs. A further group of panels was not exposed to any playbacks. By comparing the communities that establish under these different acoustic conditions, we can determine whether soundscapes affect the settlement of larvae.
Challenges
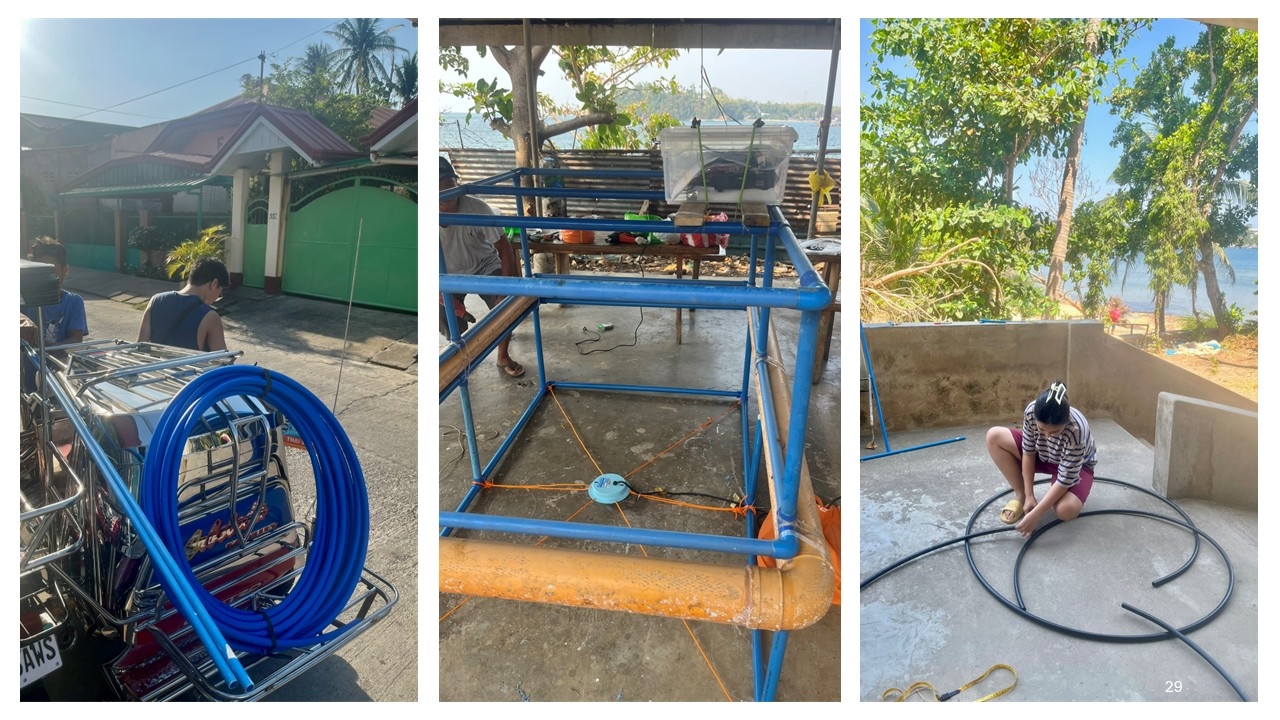
In contrast to the other GAME teams of this year’s project, we don’t have a jetty at BML. So, our first challenge was to build a setup that could carry an MP3 player for the soundscape playbacks, an amplifier, and an underwater speaker, which all need electricity supply, and position it about 30 to 50 meters away from the beach.
We ended up building a floating frame that carries the settlement panels as well as the underwater speaker, and combined it with a waterproof box, which was above the waterline and contained all the sensitive technical equipment. The box was firmly sealed so that it withstood waves and heavy monsoon rains, while its interior remained dry. At the same time, it was protected with a reflective car cover to prevent the technical equipment from overheating, as the box was constantly exposed to the burning tropical sun. To supply the set up with electricity, we – with the help of technicians and divers – rammed long bamboo poles into the seafloor and attached a cable to them that was connected to an electrical outlet on land.
As a consequence of this particular set up, every time we want accessed it, we either went snorkeling or took a boat. Hence, we had to plan our work according to the tides. We also needed to avoid the hottest hours of the day, and sometimes we needed to hurry because a storm was approaching. In the end, you could say that we learned to live in the rhythm of Mother Nature.
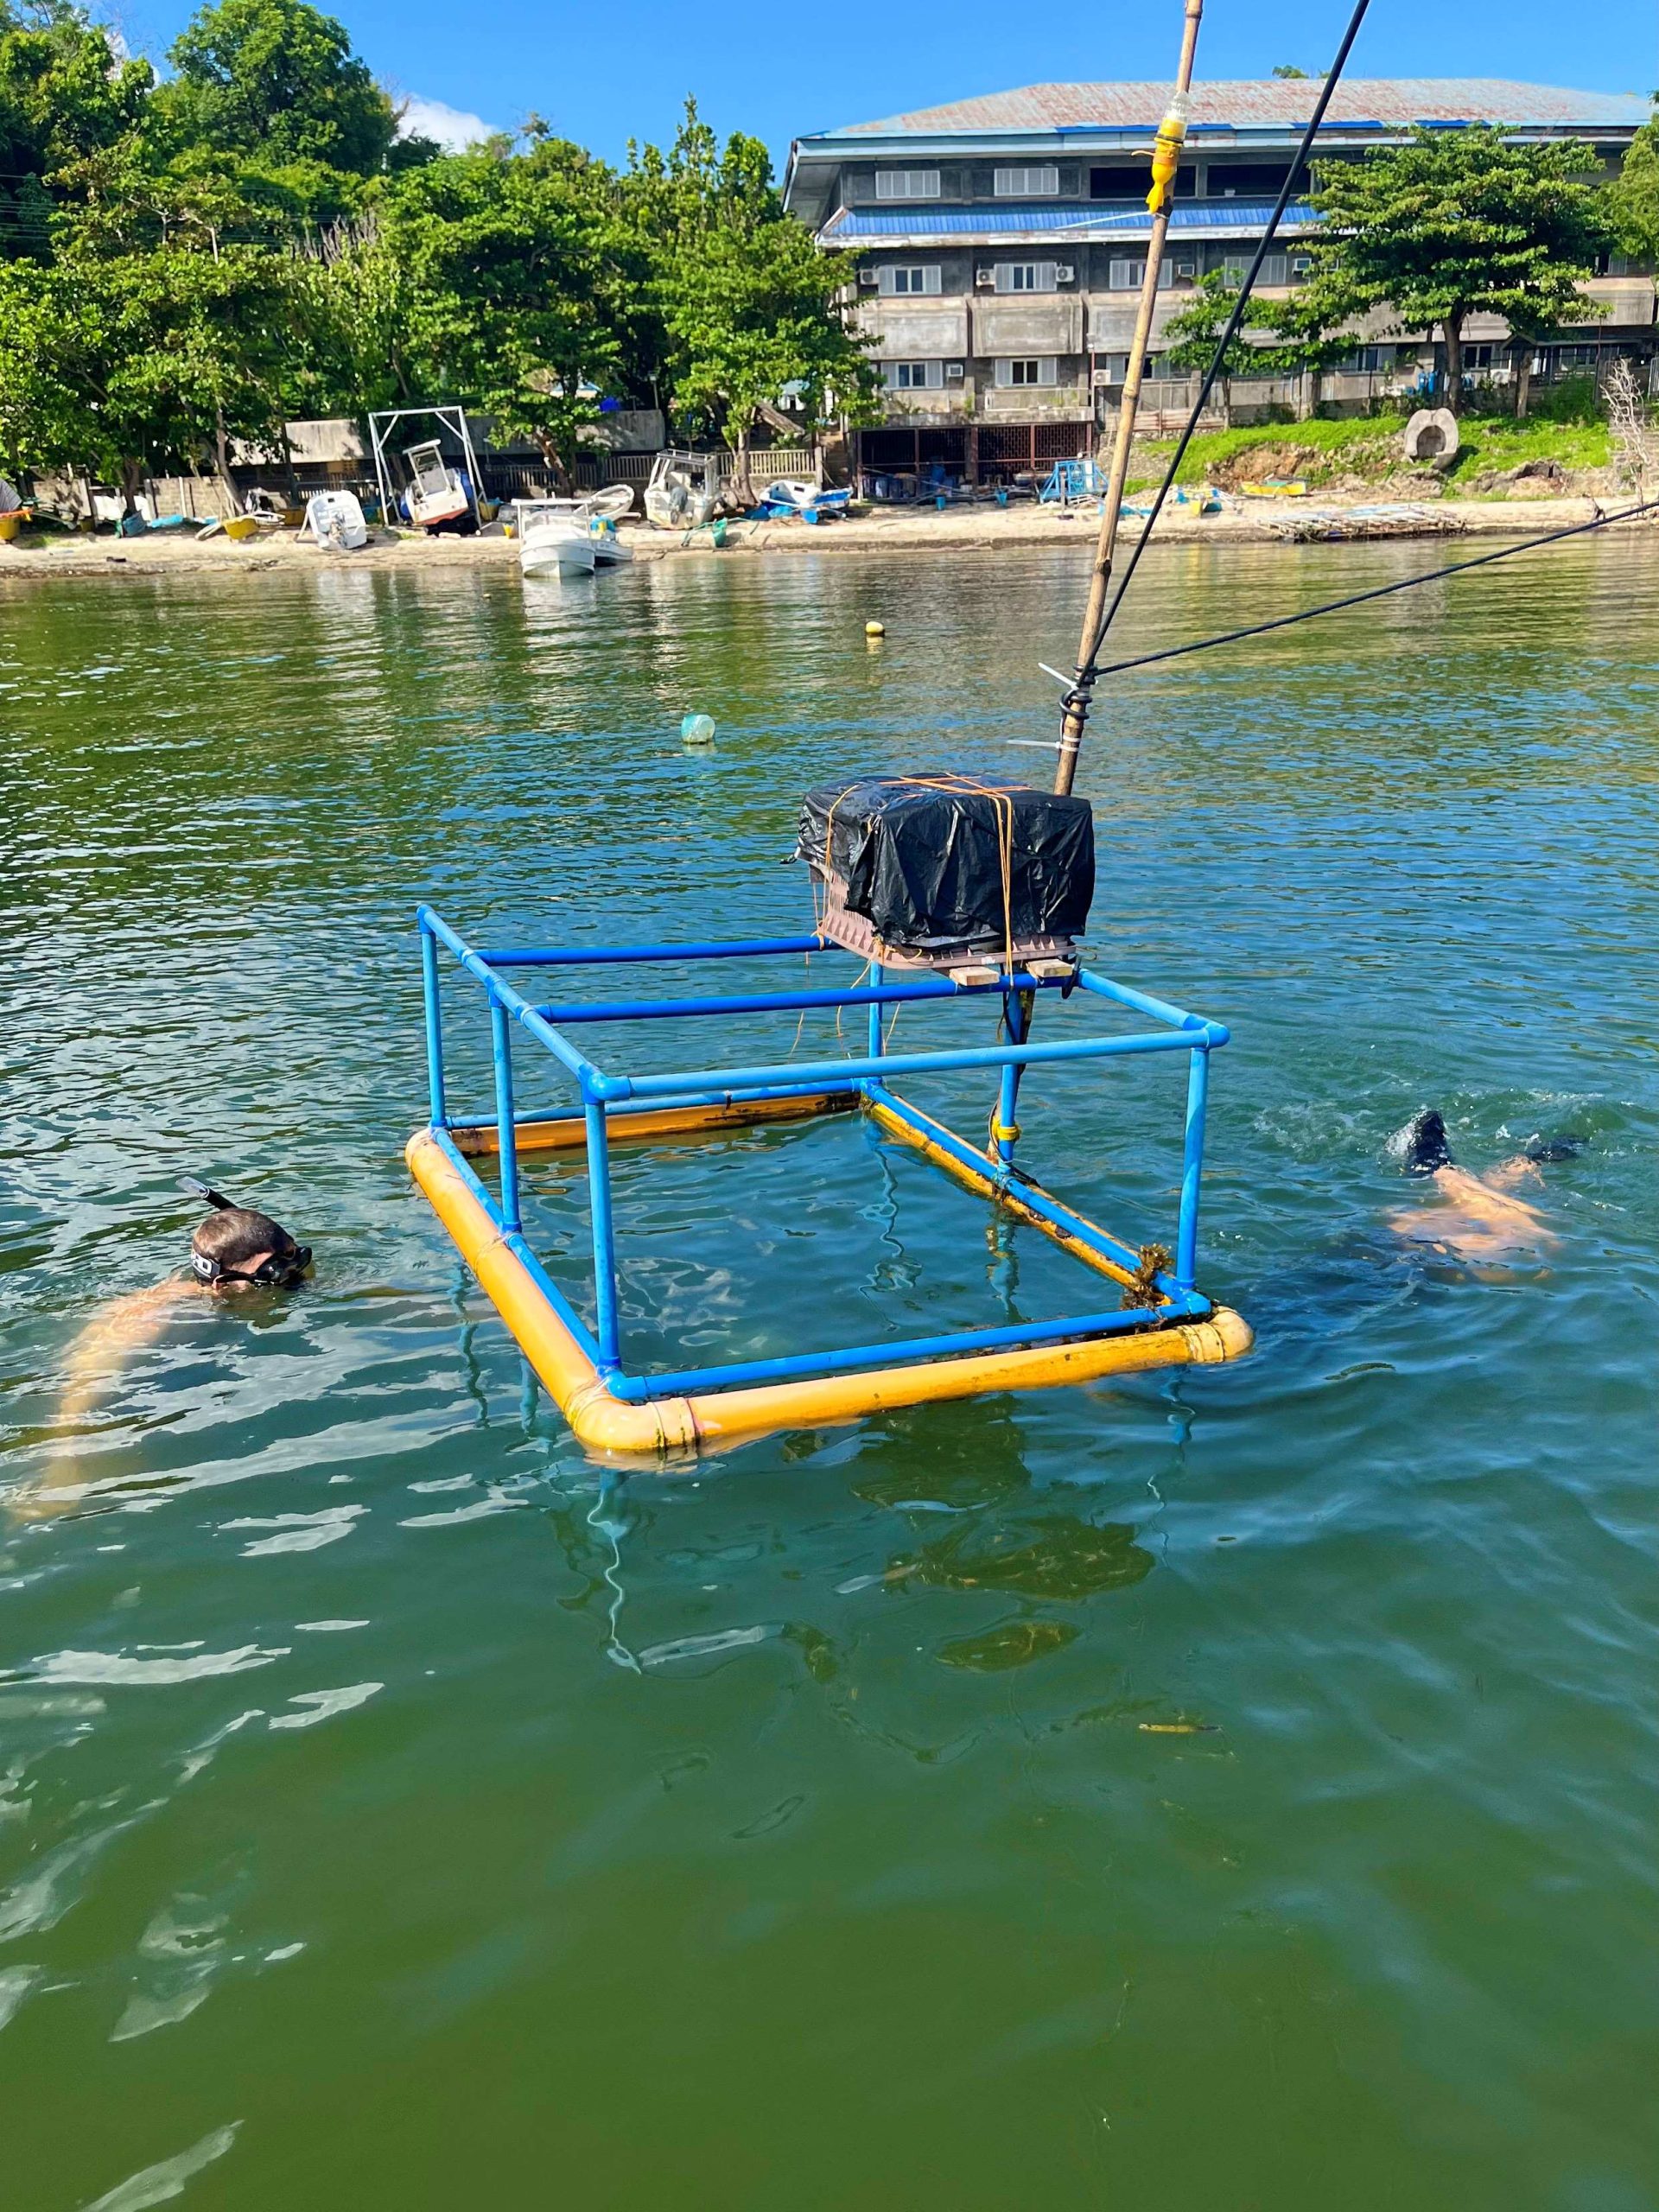
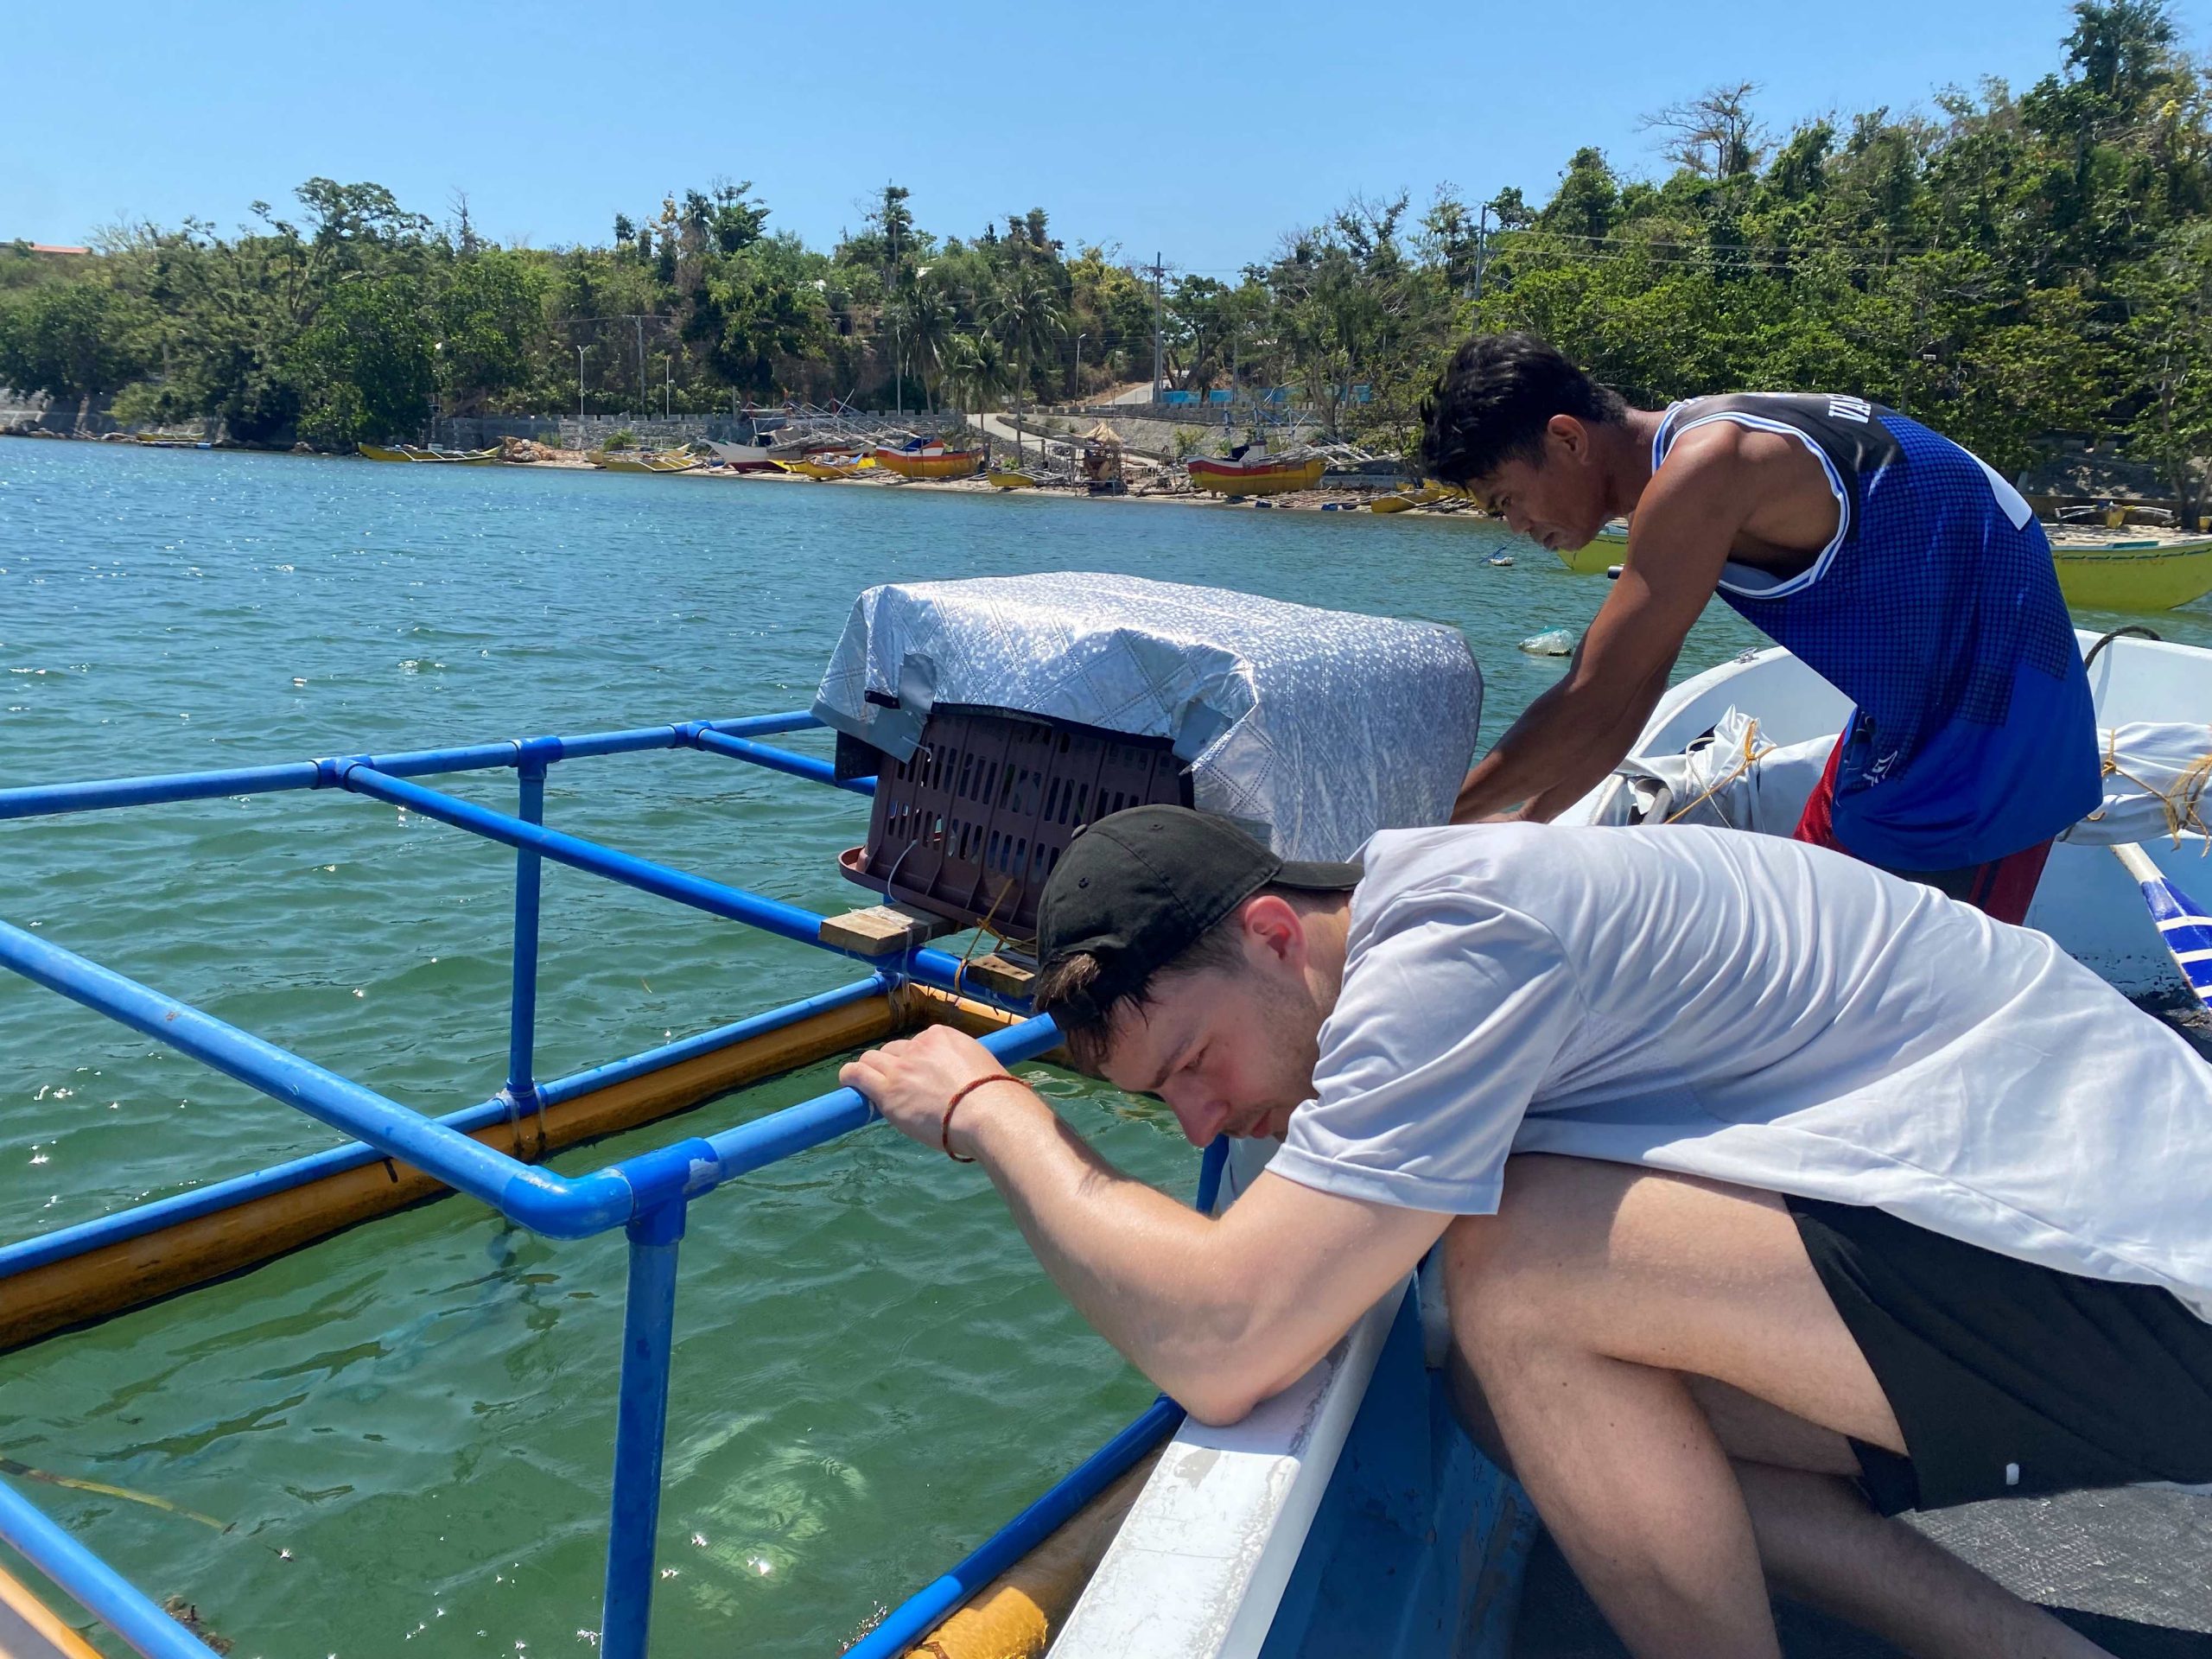
After some test runs, everything was ready and we could finally start the experiments. From that moment on, we regularly inspected the frames to check whether everything was still in place and whether there were any damages or malfunctions. So, we still had to go into the water almost every day. It was beautiful to make a small detour while working to see some nudibranchs, octopus or pufferfish and get to know the local underwater environment better every day. Once a month we took all the settlement panels out of the water to collect data about the abundance of single species and to document the community composition. Already after a few weeks in the water, many barnacles had settled on the panels. At a later stage, they dominated the artificial substrates together with macroalgae and black mussels. Furthermore, we could detect different species of ascidians, polychaetas, and hydrozoans, which, however, only occurred in very low abundances.
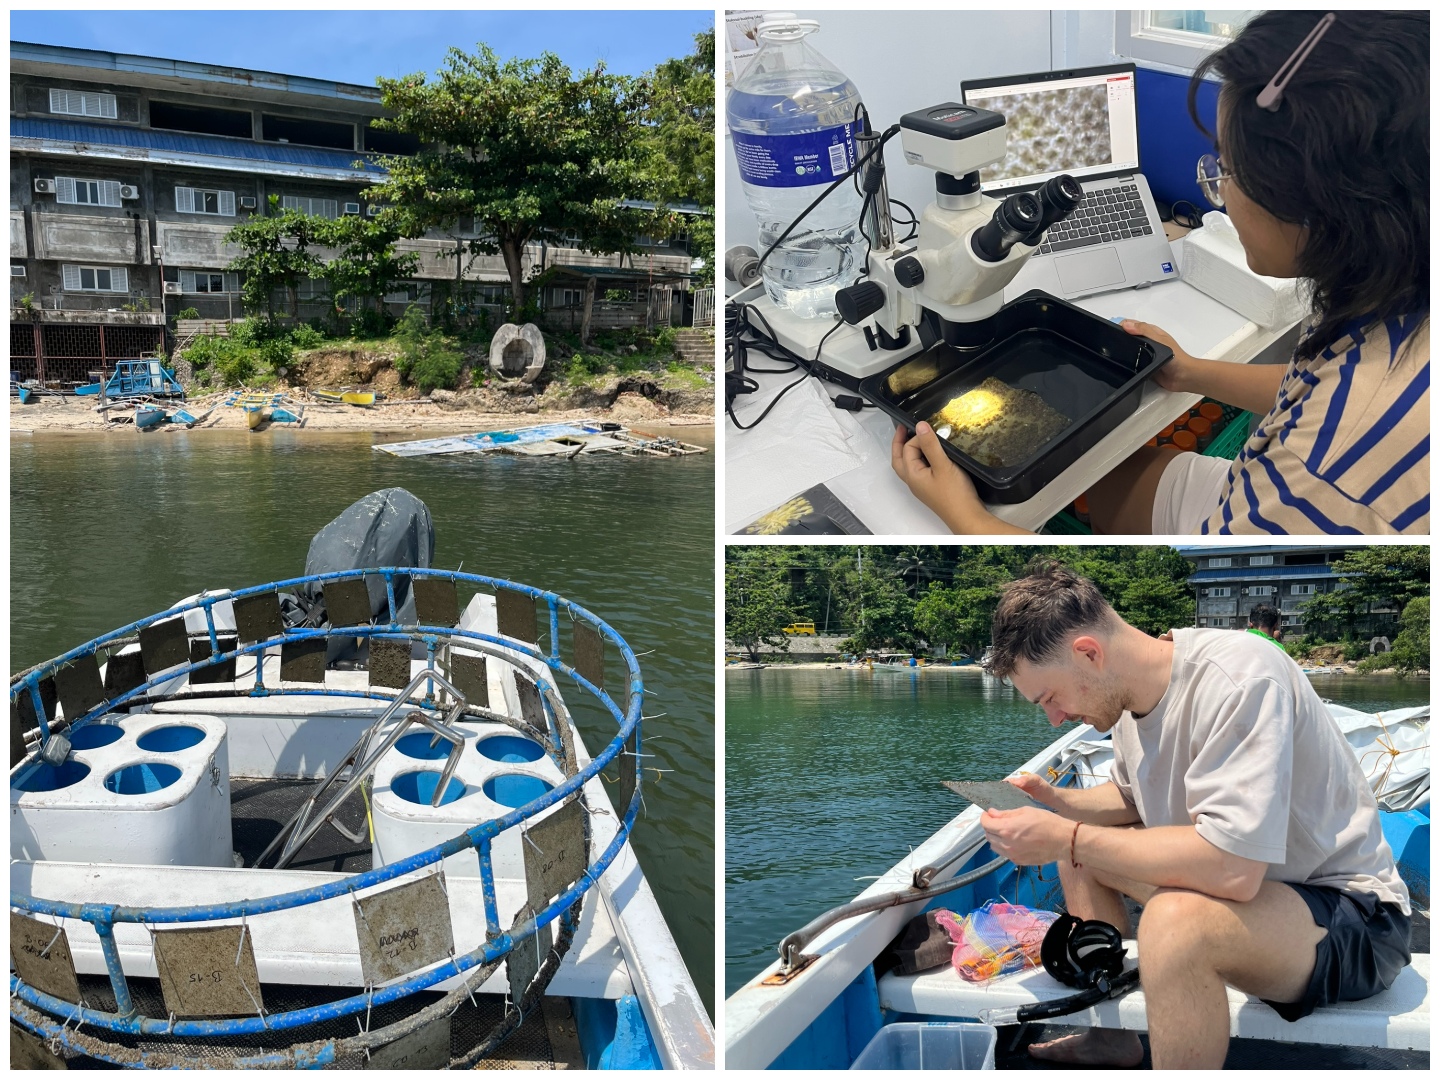
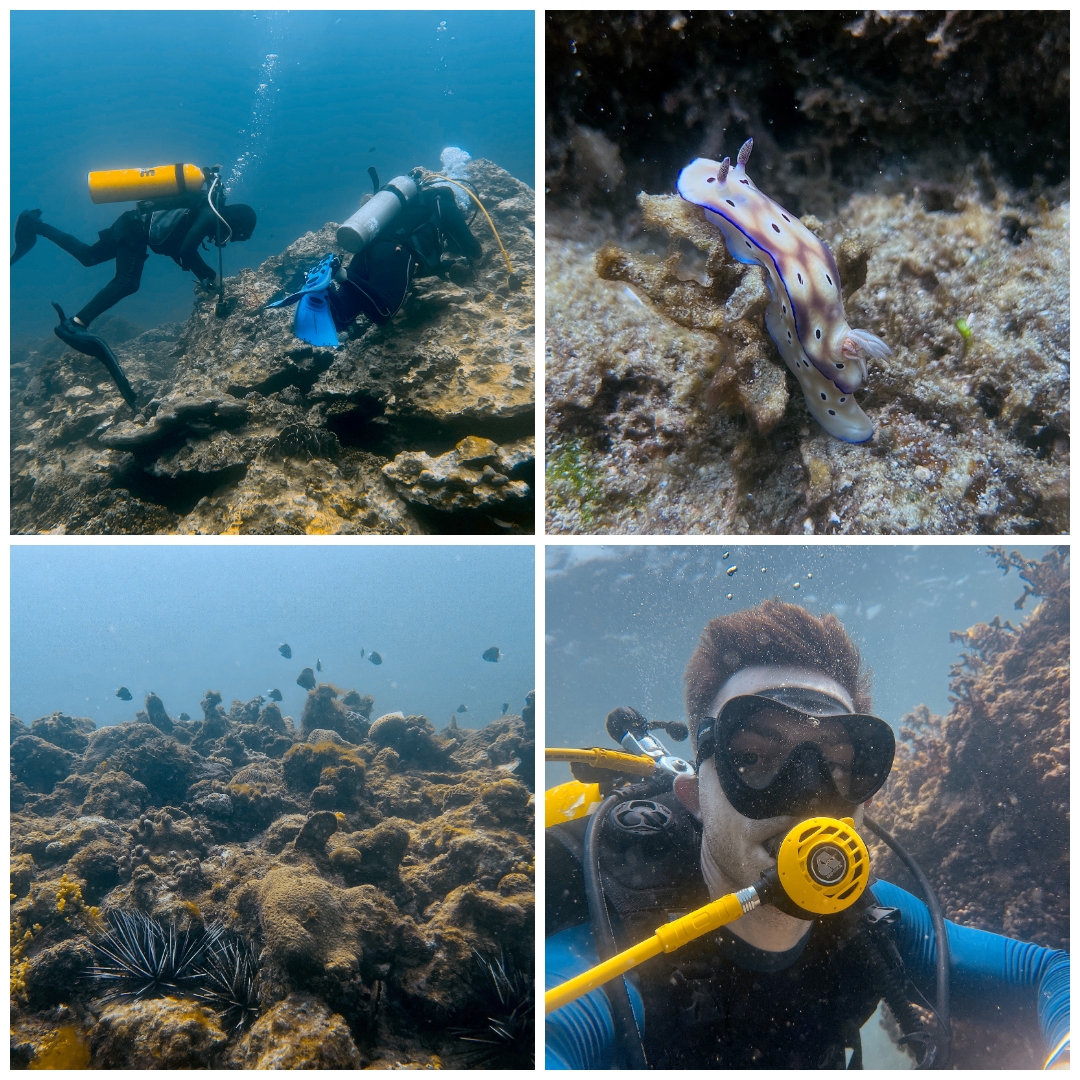
Alongside with the preparations of the experimental set up, every few weeks, Konstantin was able to join the coral research group during their fieldwork and went diving with them. This how we got our recordings of sounds from nearby healthy coral reefs. He deployed underwater microphones (hydrophones) while diving and since this task took only some minutes of the dive, he often still had enough air and time to enjoy the underwater world of the Philippines more closely.
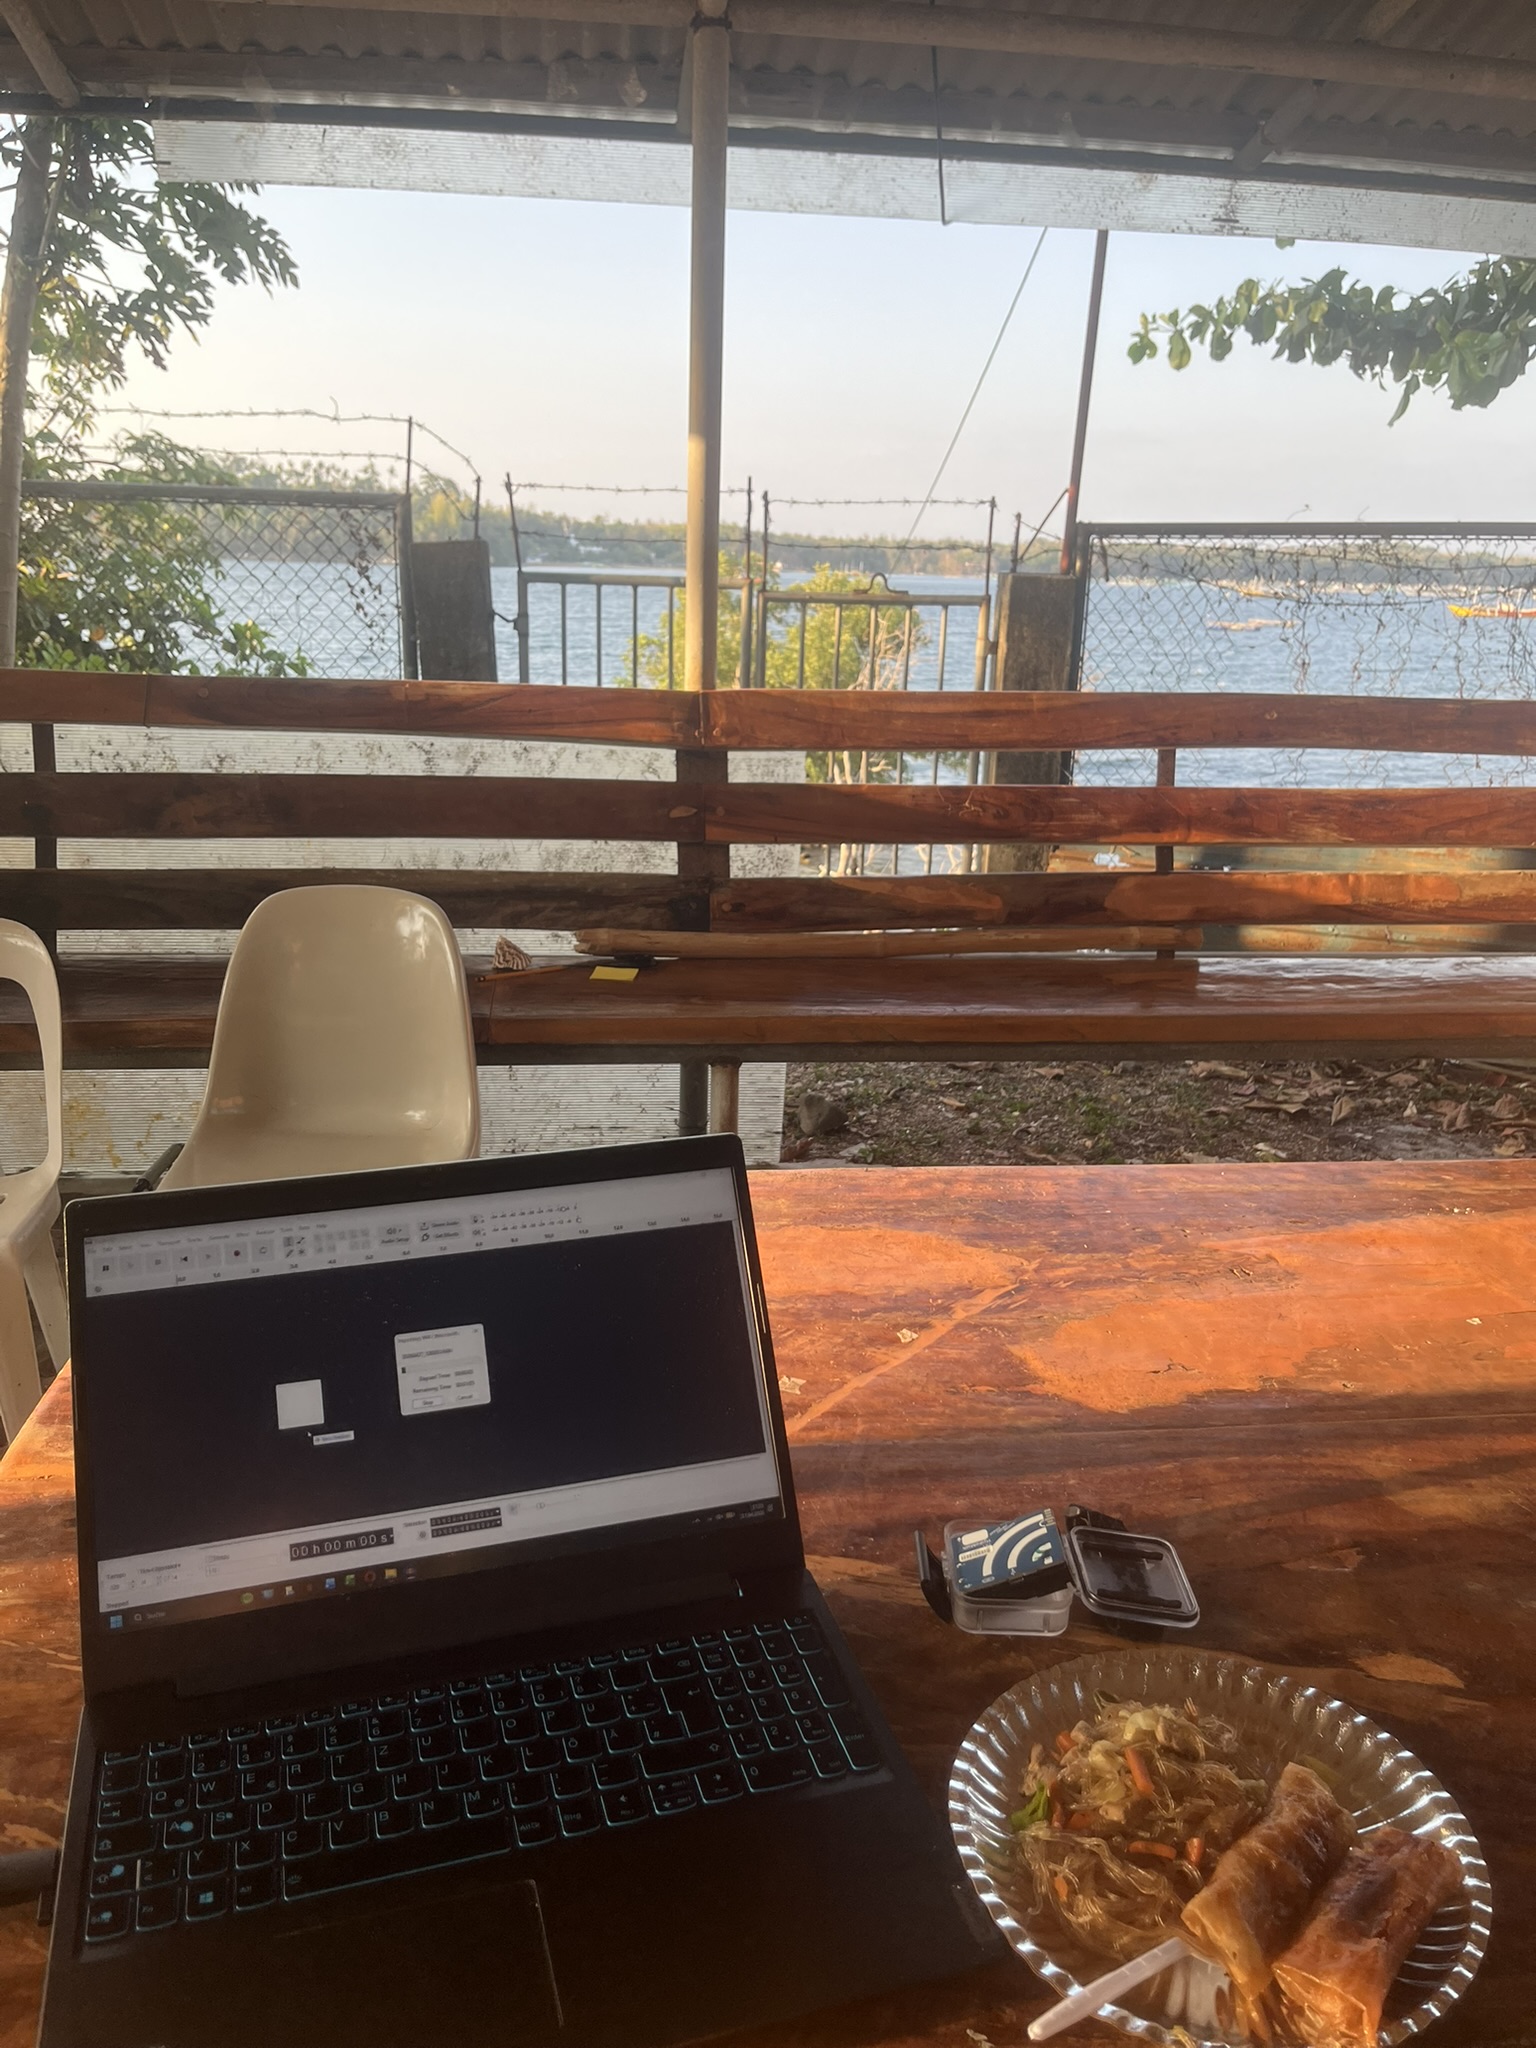
Life in Bolinao
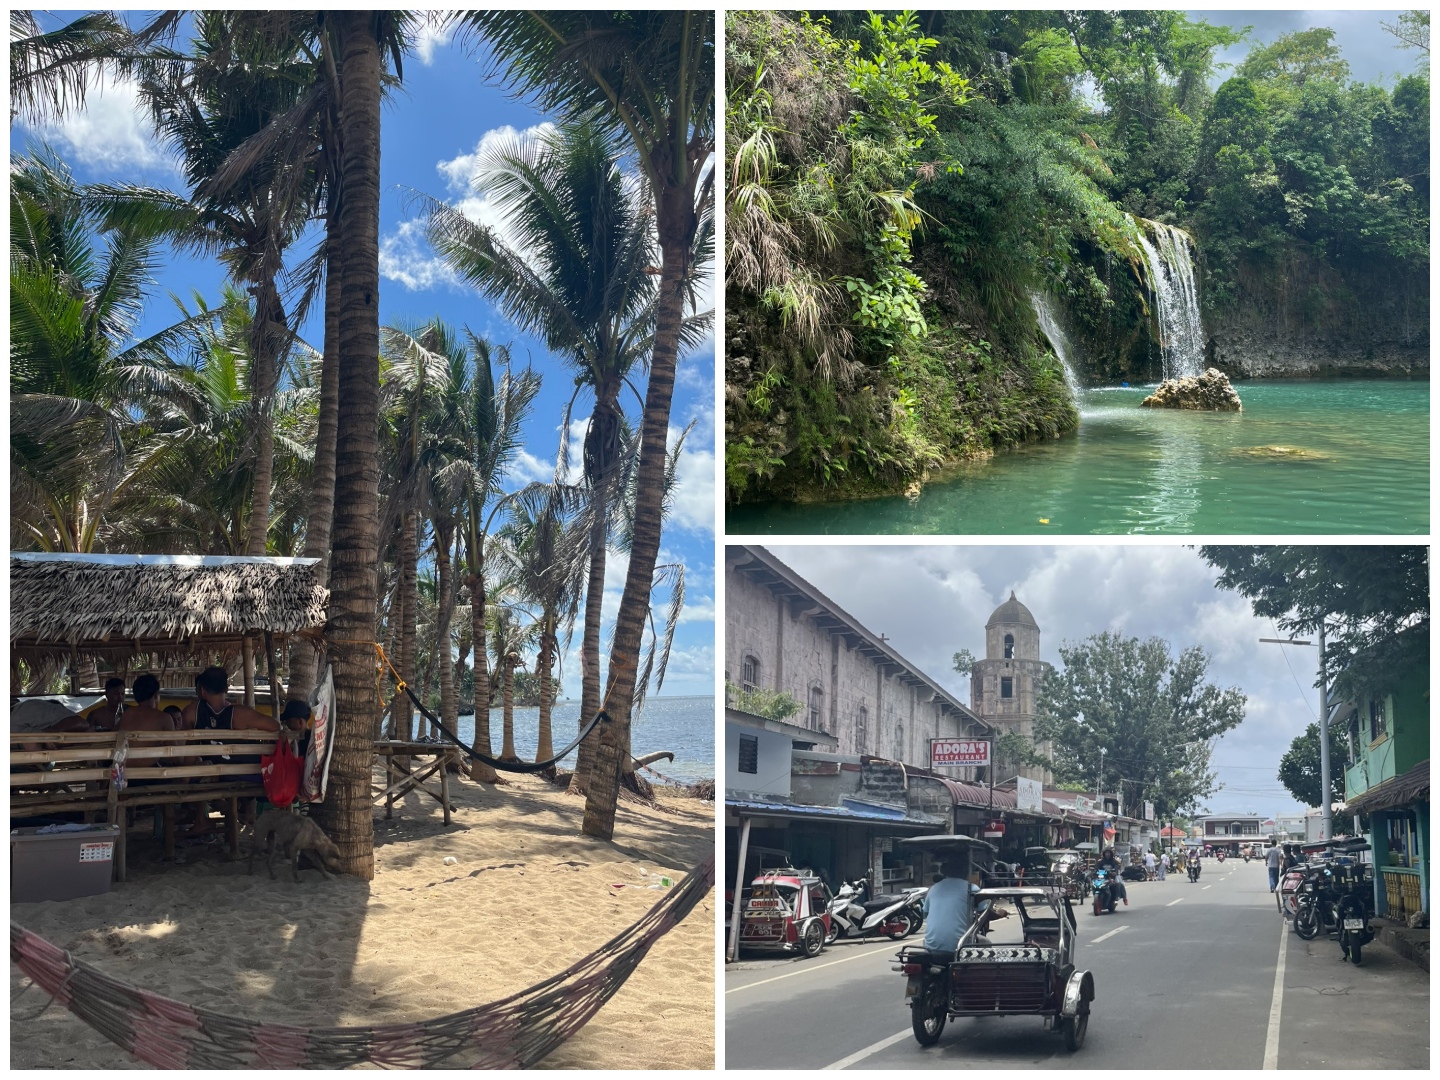
To put it in a nutshell, life here is a mix of relaxing beach vibes, lively markets in the city center and a wonderful community in and around the institute. A foundational value embedded in Filipino communities is Bayanihan, which embodies unity, cooperation, and collective volunteerism, where individuals work together toward a common goal without expecting personal gain or reward. This is something we feel and experience at the institute, as any individual is willing to provide help without asking for anything in return.
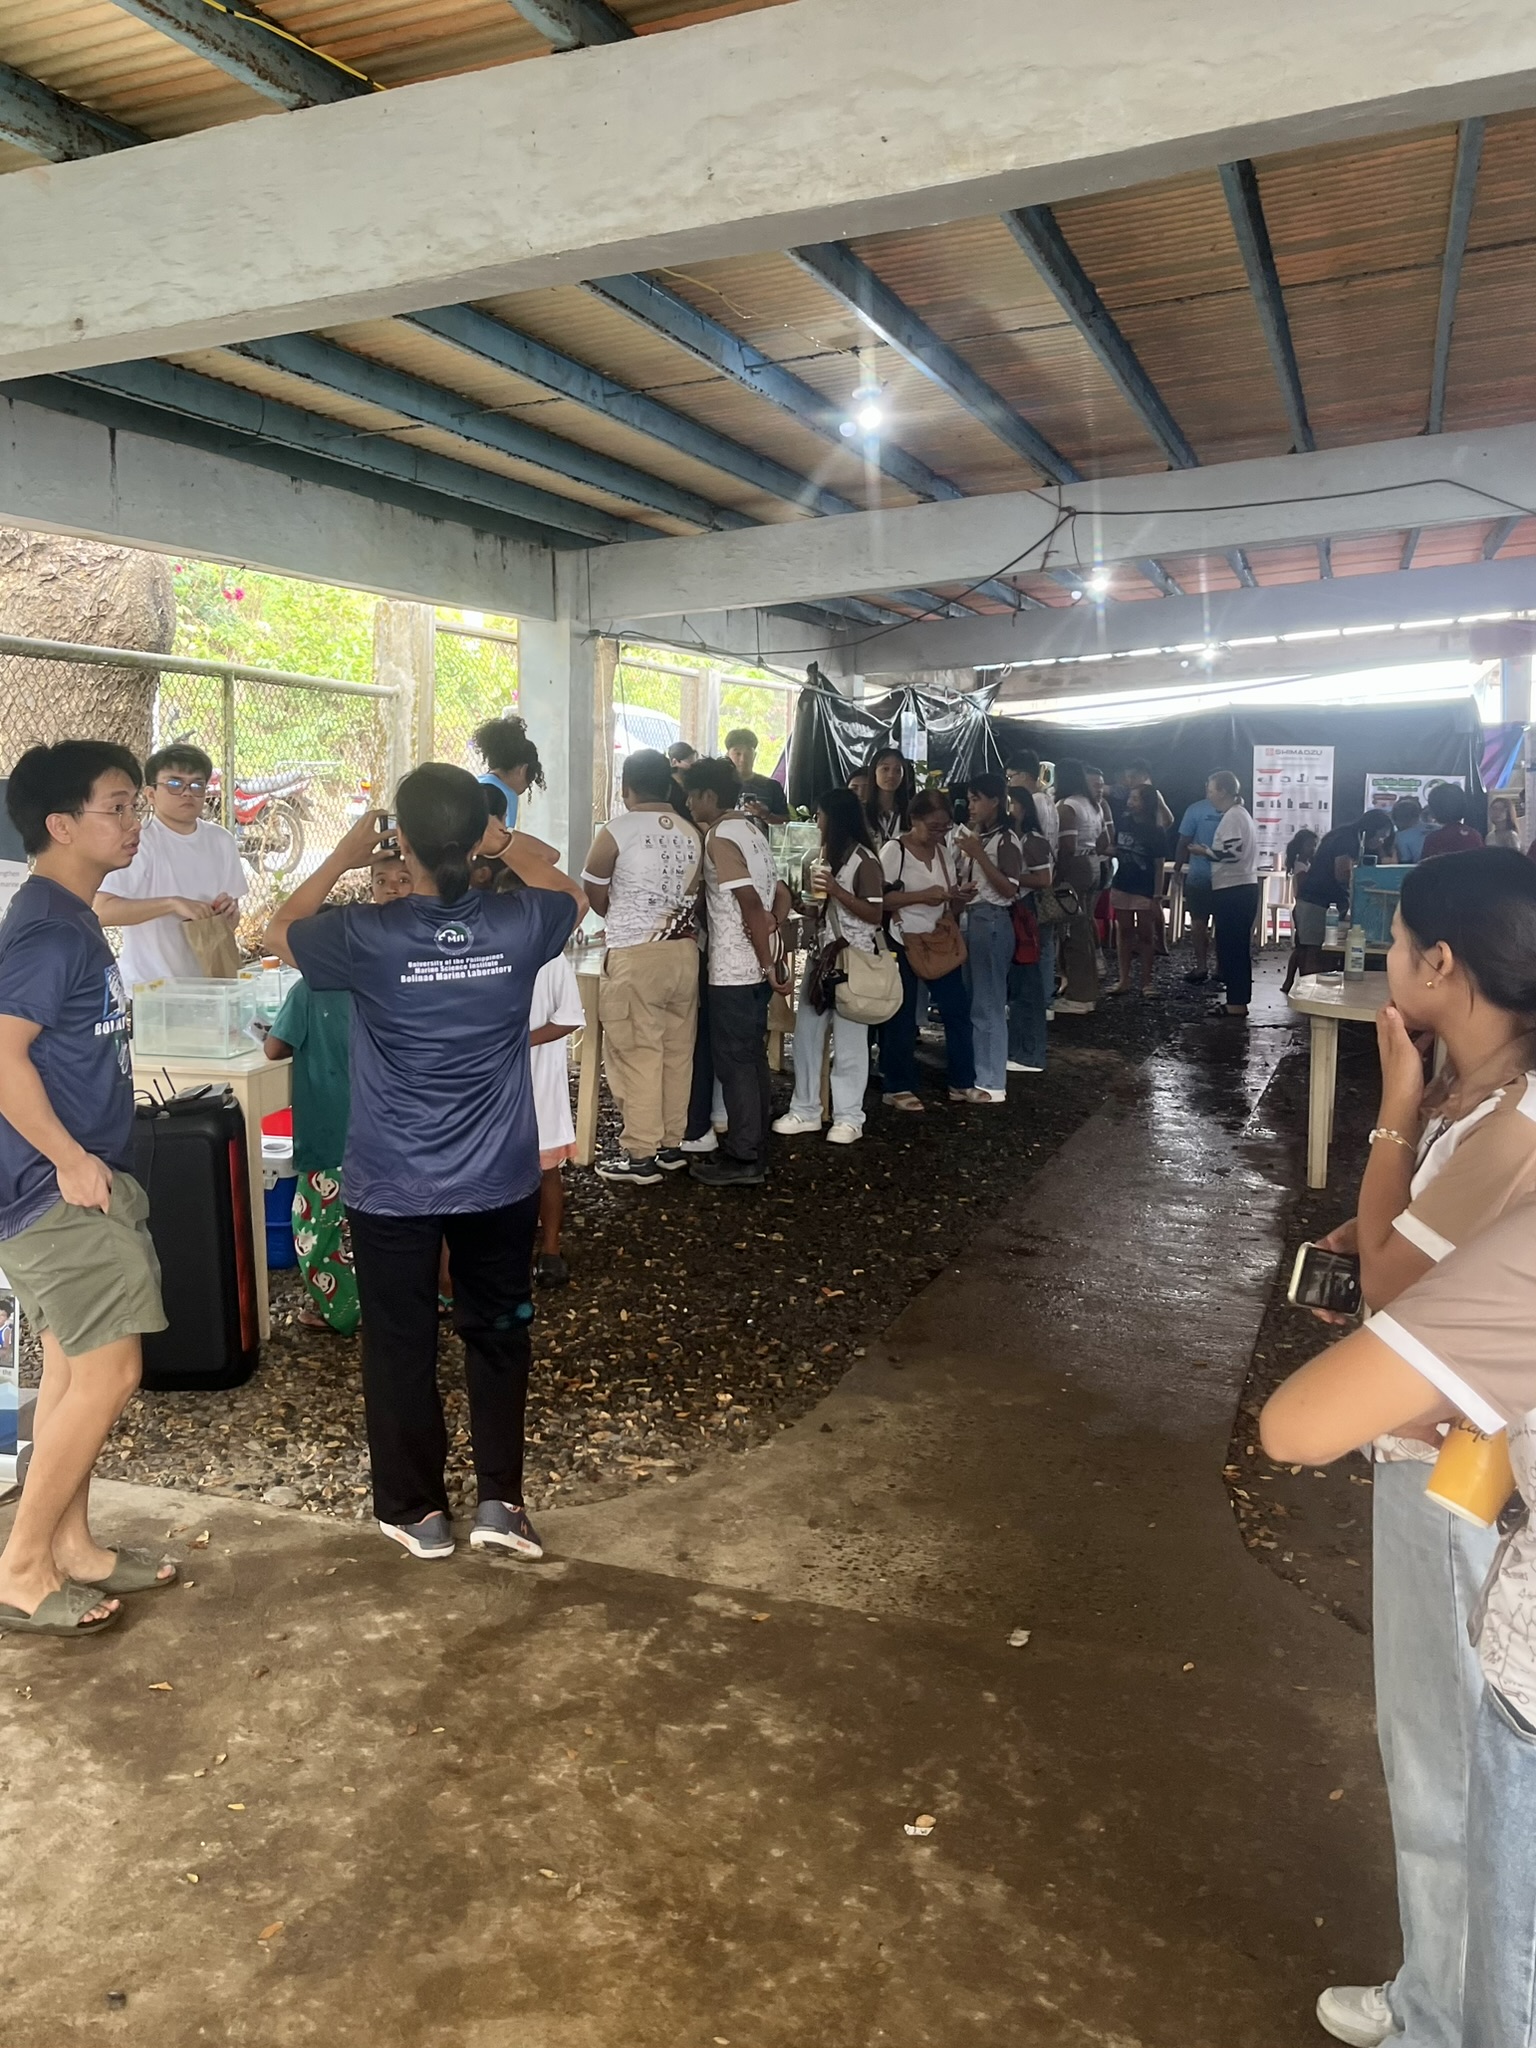
Science has a very strong application-oriented status here. Within the working groups at the institute, people often discuss the benefit of their research to the community. We also talked to local fishermen. They were very curious about our work and told us how they could already make use of previous research by the institute and increase their income at mussel farms.
Our experiment also could help these fishermen in the future. If we gain a better understanding of how soundscapes affect marine life, we could use that knowledge to prevent the decline of biodiversity in these waters. This would enable the community to secure stable access to the natural marine resources that serve as an important source of food and income here.
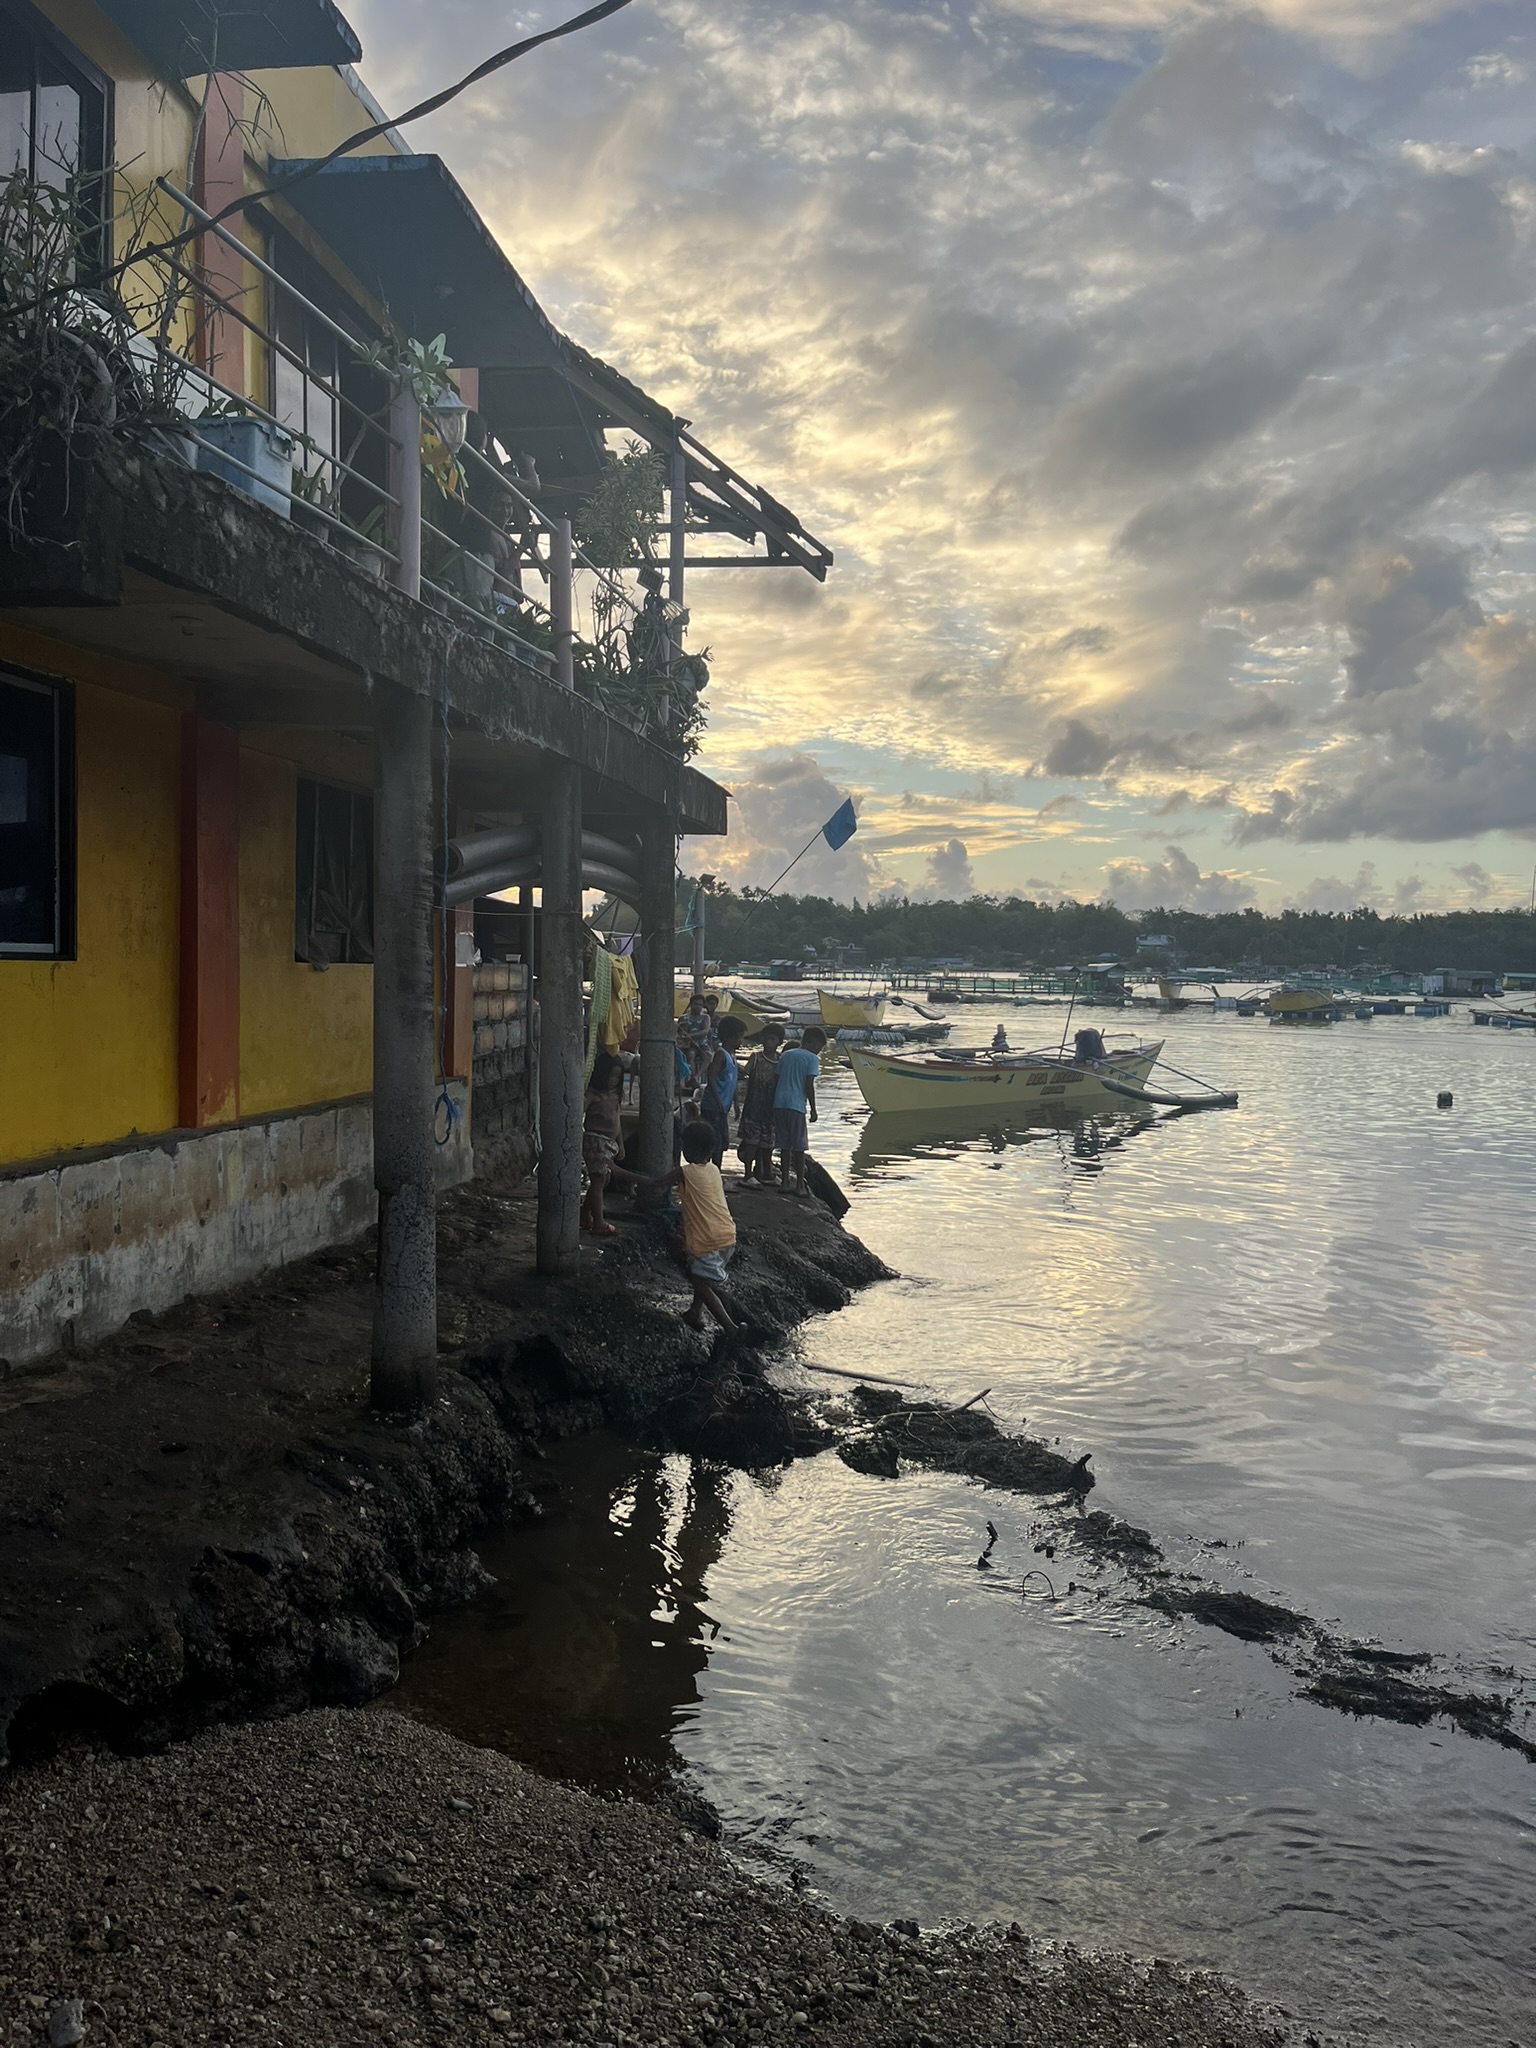
The end of our experiments
The Philippines experience 20 typhoons in a year on average and most of them hit the country during the northwest monsoon between July through October, which is overlapping with the last phase of our experiments. The frames we deployed were built to go along with the waves, but strong waves with heavy rains inflicted some damage on them. Because of that and since further storms were about to come, we decided to terminate the experiments some weeks earlier than planned.
We didn’t do much analysis of the data that we collected yet, but the first results are already fascinating. When comparing the communities that established under the influence of boat noise with those that developed in the absence of playbacks, it seems that the noise decreased the communities‘ biomass and biodiversity while it also altered their composition.
For assessing the dry weight of the organisms that colonized the panels, we scraped off everything that grew on their surfaces and dried this material in an electric dryer. After this work, the whole laboratory building smelled like a fish market. On the next day, we could already see that people took notice as many fans appeared on the hallway to blow away that smell. Luckily, everyone has been very kind and patient, helping us with ventilation and cleaning and simply putting up with the smell. Soon, our time here will come to an end, and we will head back to Kiel, Germany, to work on our data. We will be sad to say goodbye to all our colleagues and friends here, and we hope that the smell of fish will not be the only impression we leave behind!
Soundscapes in the pearl of the orient seas: The Philippines!
It all started with a bang – several million years ago. Beneath the Atlantic, successive eruptions raised an enormous volcanic mountain from the ocean floor, and its very tip now forms rugged cliffsides, deep red canyons and fertile ground for hotel chains. How land was formed here, in the middle of the ocean, is still plainly evident in the red and black banded mountainsides of Madeira, in pools of volcanic rock frozen mid-flow and in cliffs sculpted by magma, wind and water. Life clings to this volcanic ground with stubbornness: Cacti climb sheer ridges, while sage-green, brown and vibrant yellow shrubs crouch against the rugged terrain.
Today, Madeira is known as the Island of Flowers, an image that echoes across postcards, signs and souvenirs. Indeed, many of the winding mountain roads are lined by eucalyptus trees from Australia, tall white and lilac lilies from South Africa, and hydrangeas from Asia. Fitting for an island that lives from tourism, while also beginning to buckle under its strain.
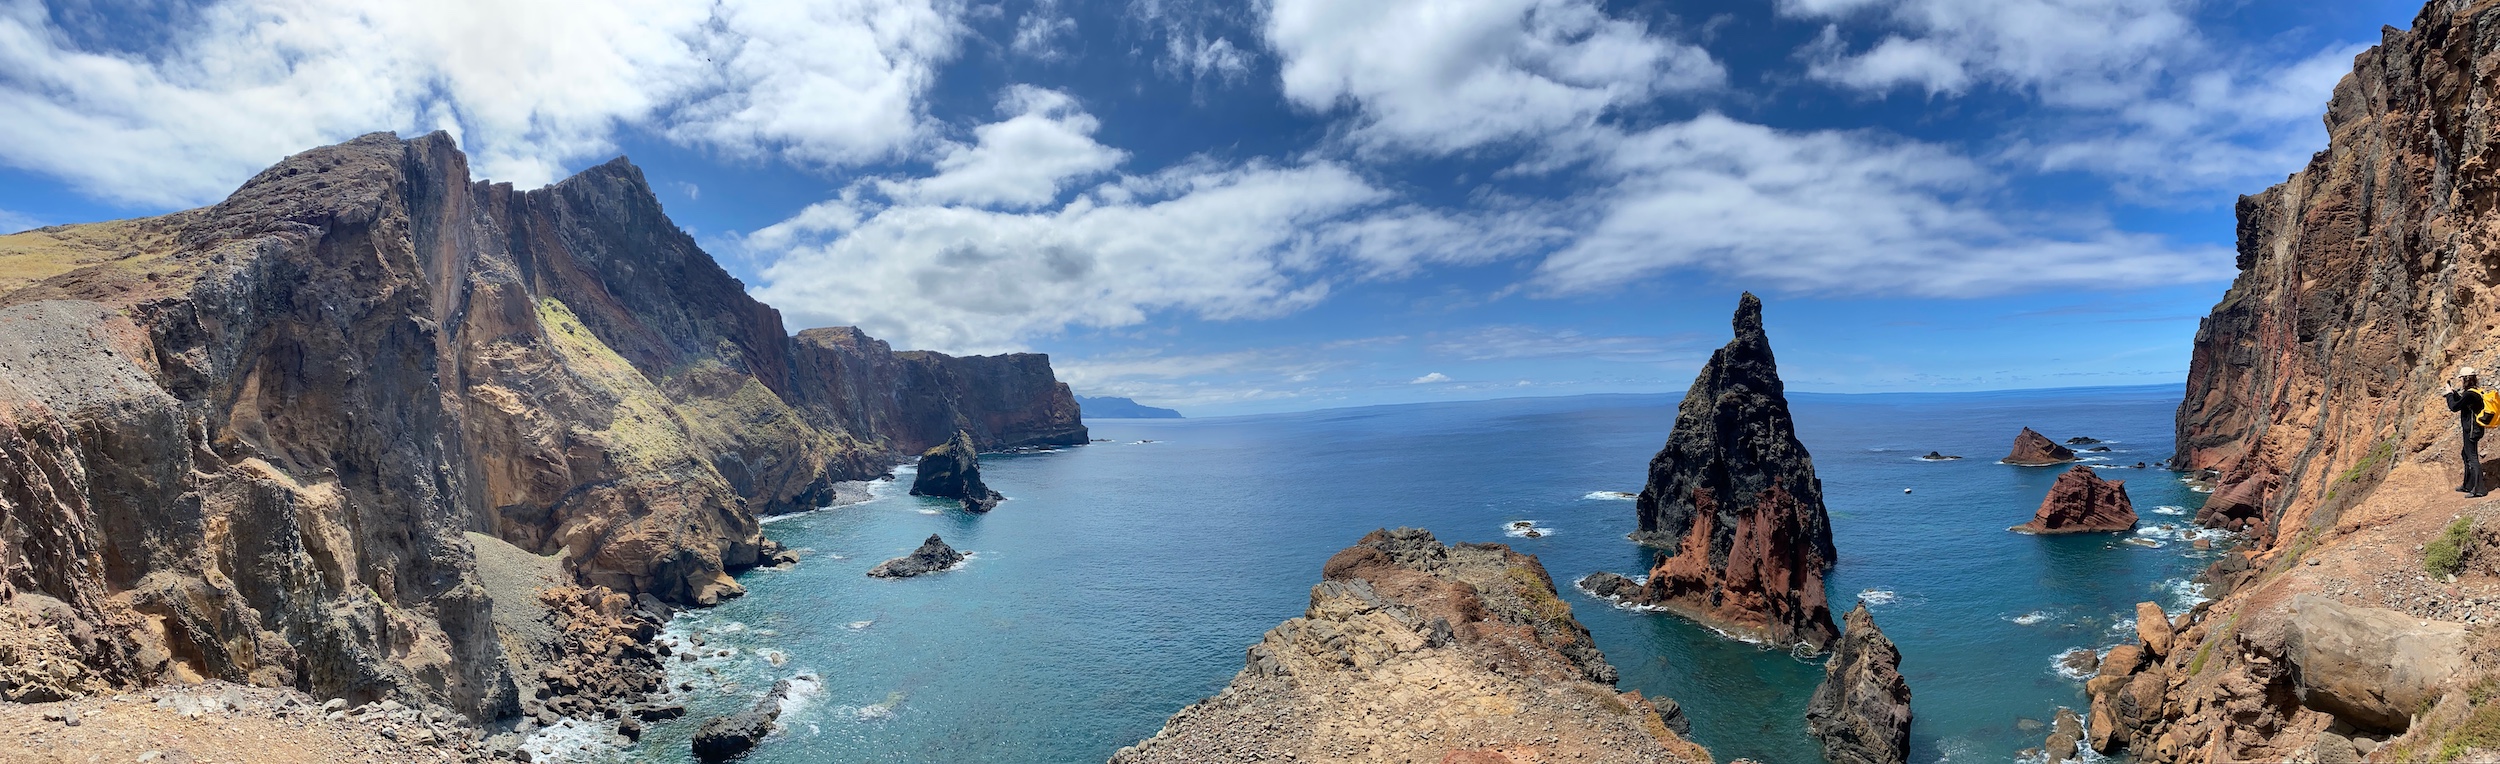
Our own project looks, at least partly, at another, less visible invader: human-made sound. Beneath the ocean’s surface, boat engines add to the island’s natural underwater soundscape, and during the six months we spend here we want to find out whether sound changes where the larvae of marine sessile animals, such as bryozoans, tunicates or polychaetes, choose to settle. Those animals are sessile in their adult life, but as larvae they are free floating. In this stadium, they are influenced by a wide variety of environmental factors—including noise—while they seek out a suitable habitat in which they could settle and survive.
And with that “Óla” from Team Madeira. We are Elin and Jana, two German students who have come to Madeira for half a year to take part in this year’s GAME (Global Approach in Marine Ecology) project.
Jana studies biology at the Ruhr-University in Bochum. “I was always interested in marine biology and had already worked in this field for my bachelor’s thesis. When I decided that I didn’t want to move away from Bochum for my Masters, I was a little bit sad, deep down, thinking that I couldn’t continue to pursue marine biology. So, I was thrilled to return to the ocean and to fieldwork when I got accepted for GAME”.
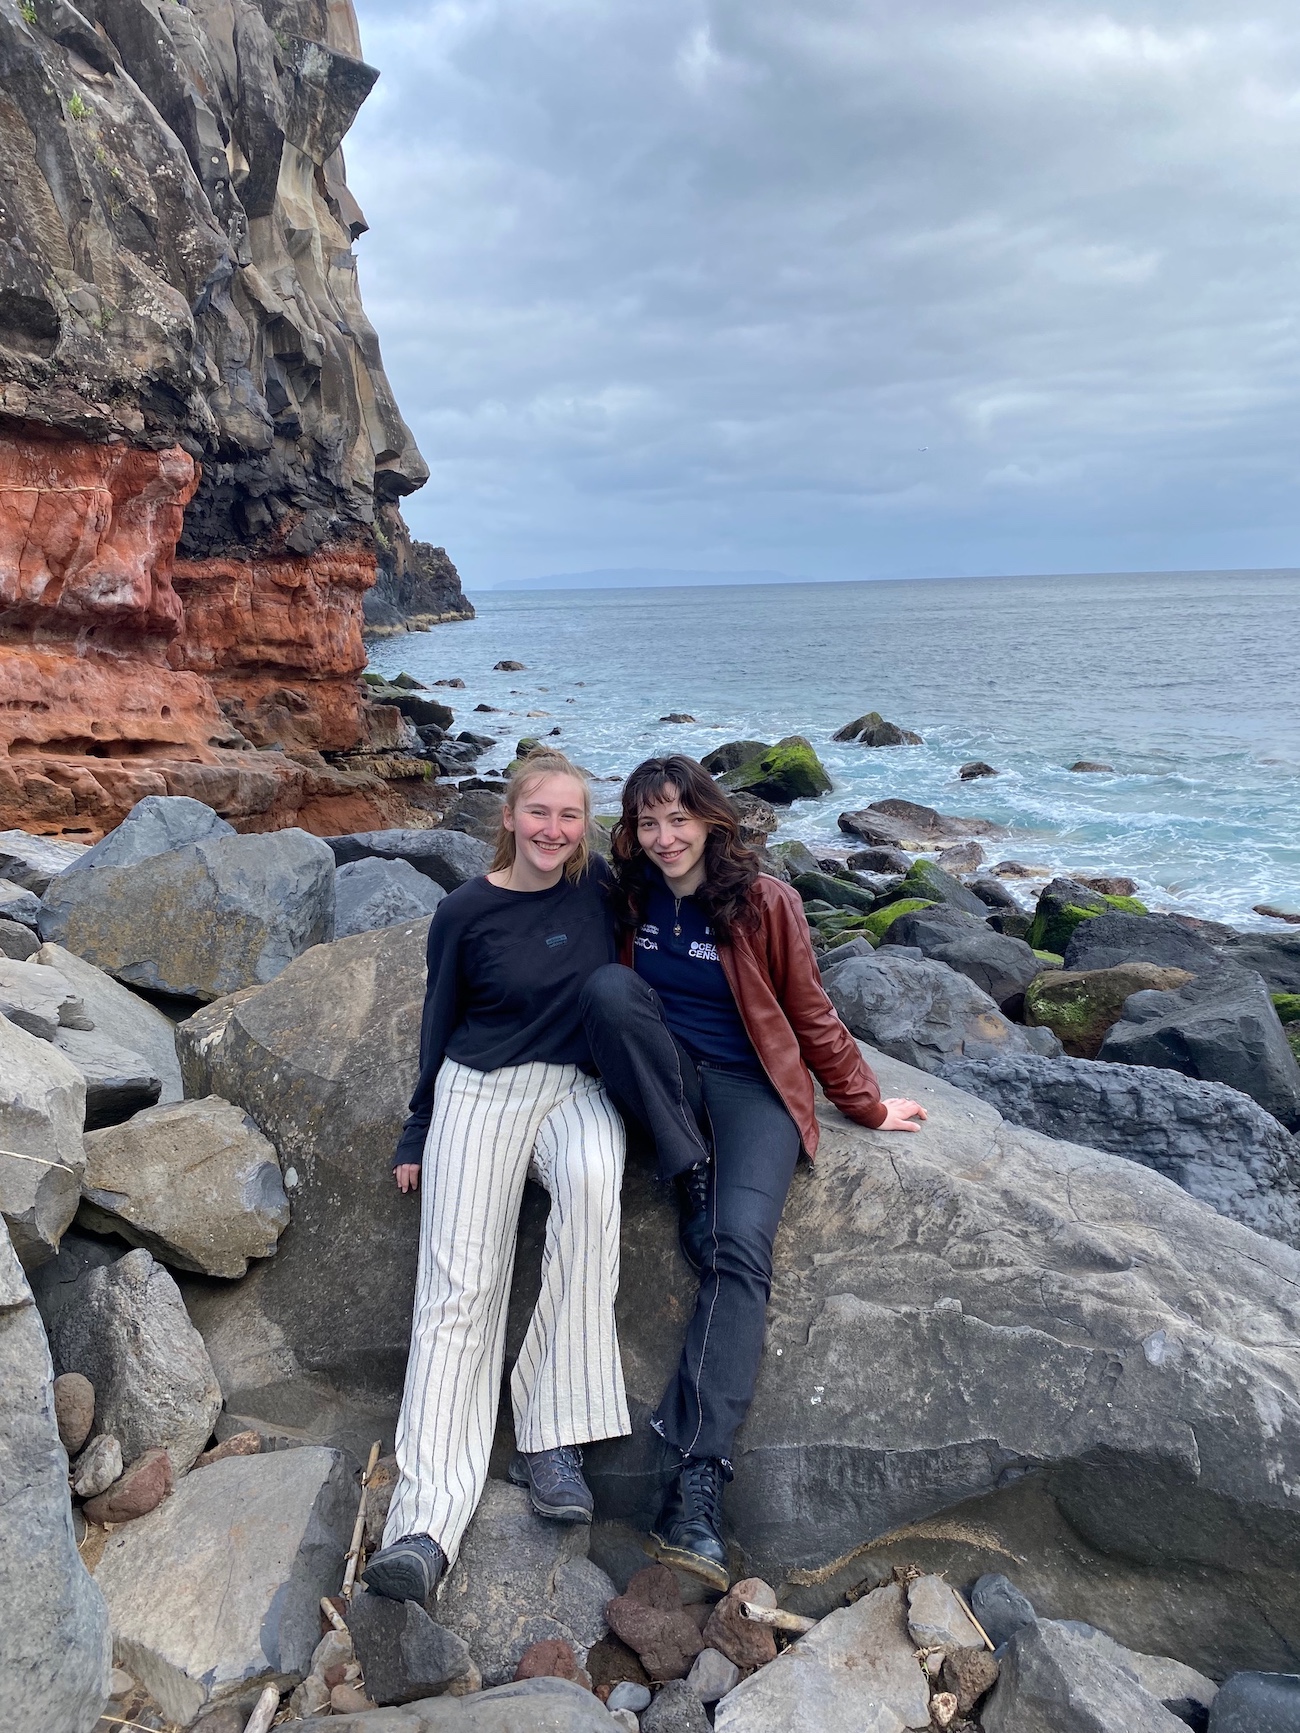
Elin studies biological oceanography in Kiel “This year’s GAME topic of The influence of soundscapes on hard bottom community colonization seemed made for me, since I had already written my bachelors thesis about the colonization of hard substrates and if I could’ve picked any field, sound would have been it.”
This year is the first time that GAMIEs are working with sound, which made the planning phase in Kiel in March extra exciting for us. We tested underwater microphones, so called hydrophones, tried out speakers and had many, many, many discussions about scientific literature and the experimental setup. In the end all teams agreed on one basic concept: One student in each country would analyze the effects of boat noise and the other the influence of natural soundscapes on the formation of invertebrate communities. Natural soundscapes will be captured by deploying thydrophones in underwater habitats that are typical for the marine region a team is working in. In Madeira, the underwater world is strongly shaped by the past volcanic activity, and features steeply sloping rock faces and rocky areas that are overgrown with algae and sessile animals. These form the most typical habitat of the region. Furthermore, here and there they give way to sandy bottoms at greater depths.
We are investigating the settlement under the influence of natural sounds, because more and more marine habitats have been destroyed by human activity. In the past, several studies have been conducted on marine mammals, fish, shellfish and coral species, which found that when sound was used to simulate healthy habitats in otherwise disturbed environments, it led to the successful re-establishment of populations. A concept that is known as acoustic restoration.
In our experiments, both, the natural sounds and the boat noise, will be played back from speakers and will be directed onto plastic plates hanging in the water, to which the larvae of sessile animals can attach.
So much for the theory.
After arriving on Madeira in early April, we got to work and realized quickly that reality is lots of planning, glue, trips to the hardware store and starting over. Luckily, we have kind and helpful supervisors at MARE, the research institute here in Madeira, many of which are former GAMIEs. They contributed their experience, advice and occasional emotional first aid. But most of the time we’re trying to do as much as we can on our own – with special support from Jana’s electronics-technician-husband, Niklas, who also came along to Madeira and is of great help with all the equipment. Even though we had many long and a few frustrating days, it was nice to plan and build everything on our own. Actually, it’s incredibly rewarding to see the finished results of our work running smoothly while the experiments are going on.
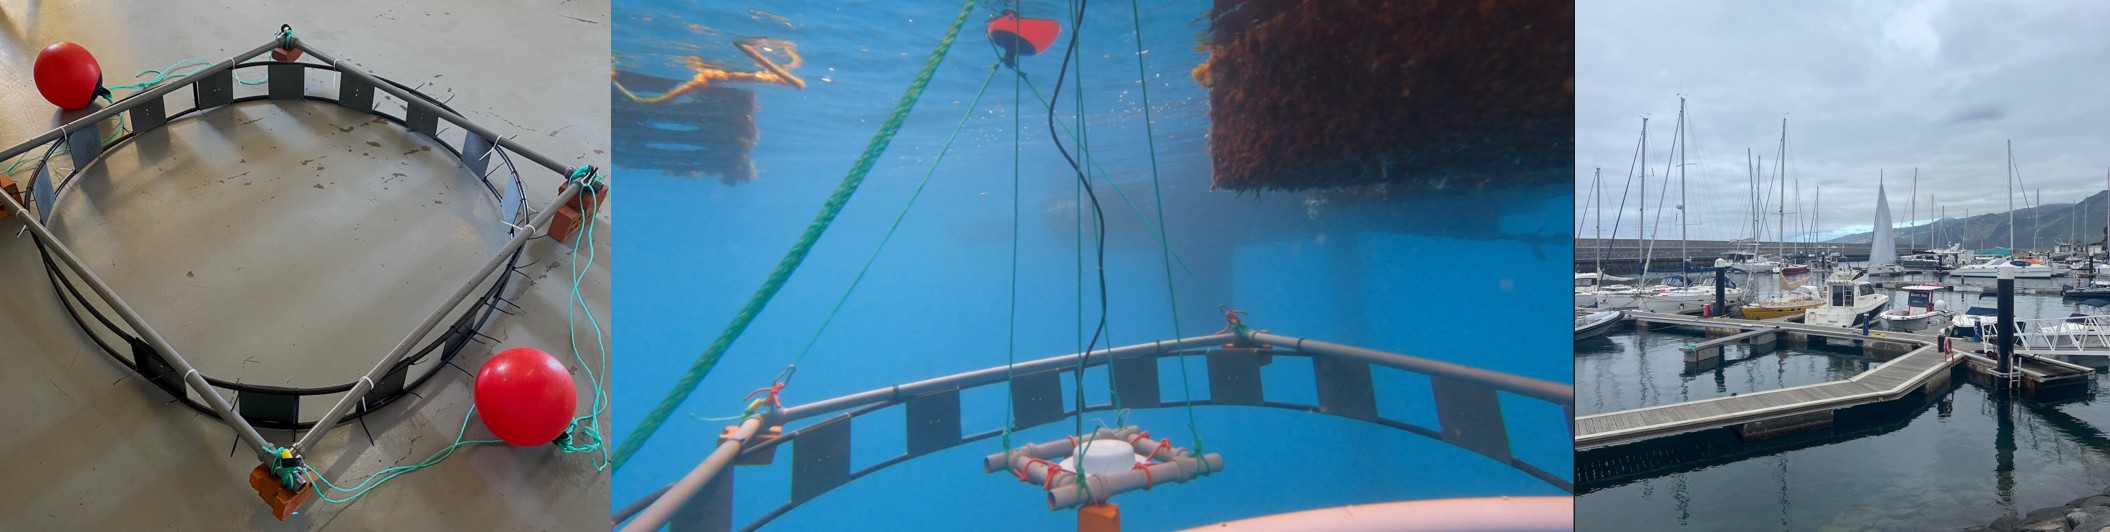
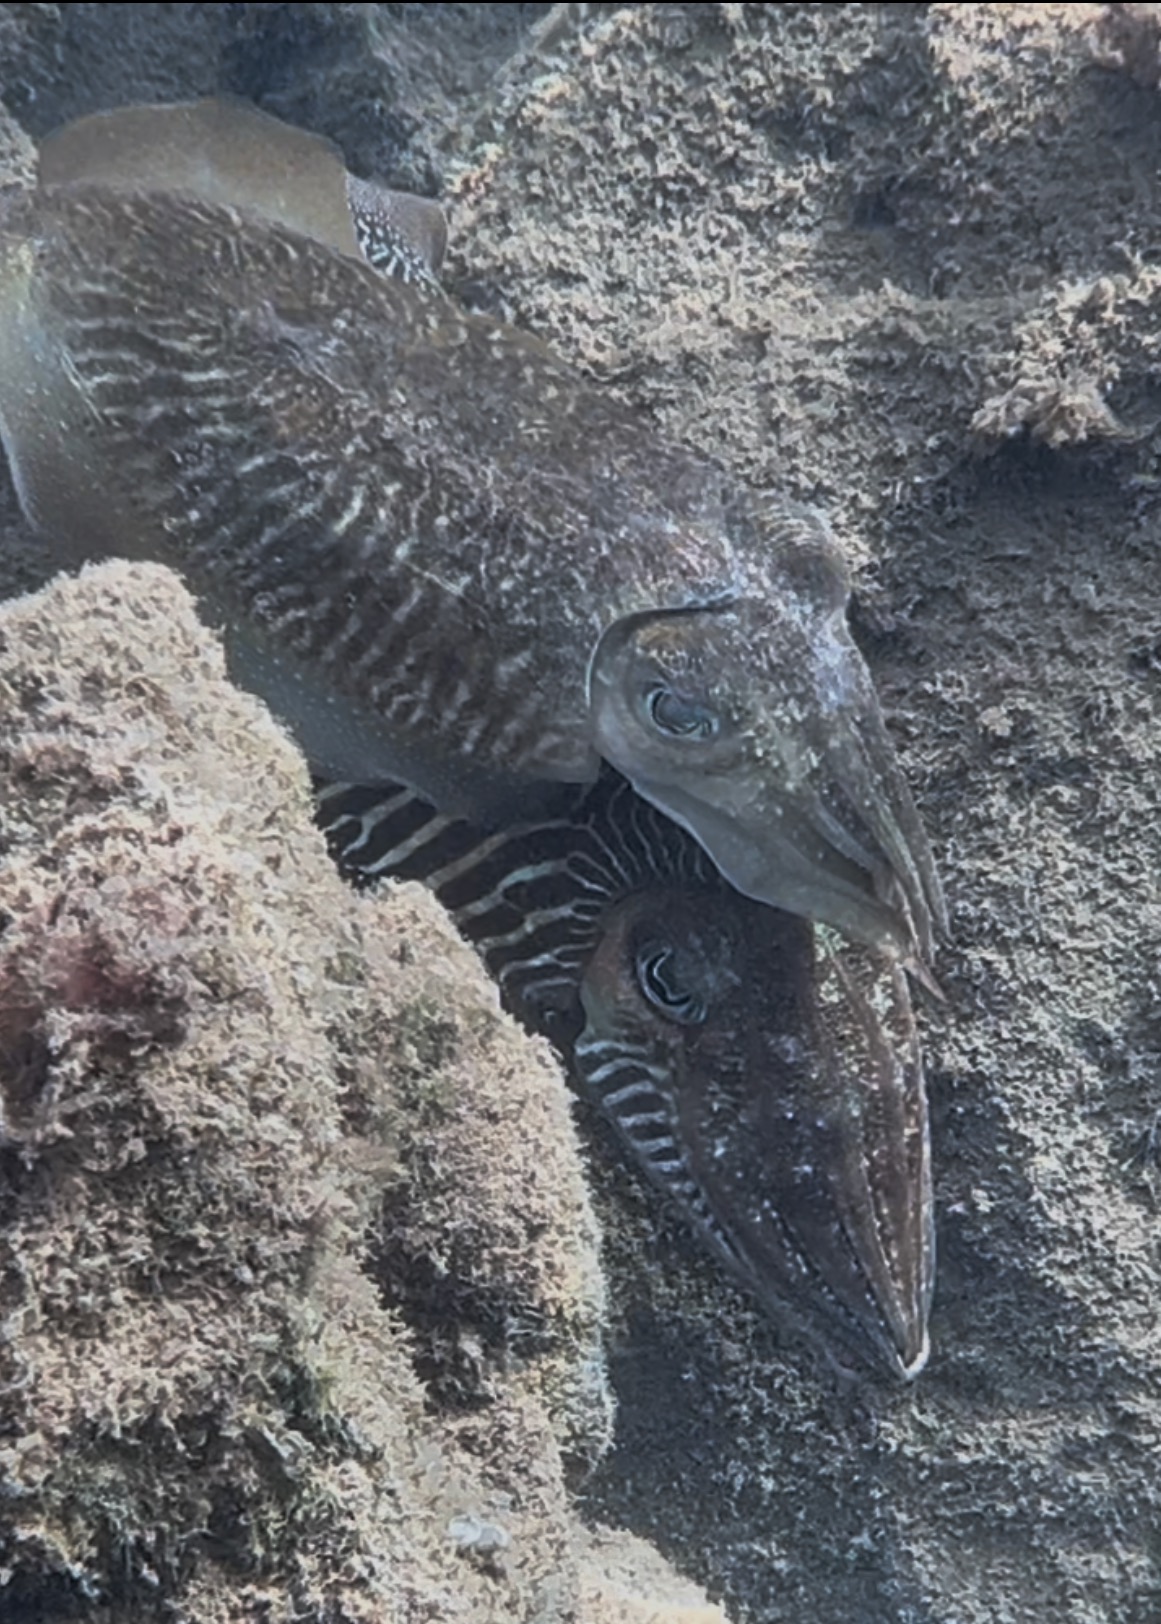
Our workplace here in Madeira is the marina in Quinta do Lorde, which is almost on the eastern tip of the island. It’s a beautiful workplace, because most days the water is calm and clear and we get to see sepias, triggerfishes and a school of barracudas swimming in the shallow waters. This makes it all the more frustrating that it is forbidden to go in, due to the ship traffic – you can imagine how hard it is for two marine scientists to follow this rule, and how often we stare into the water longingly.
The ideal way for us to run the two experiments was conducting them both at the same time. But of course, the playbacks of the natural soundscape and the boat noise shouldn’t mask or overlay each other. And they should not reach those panels that we have to study invertebrate settlement in the absence of any playbacks. This prerequisite is called acoustic isolation: whatever happens near one speaker shouldn’t affect the other settlement plates. Since sound can travel far under water, we choose the two opposite ends of the marina and two jetties in between for the deployment of the settlement panels.
Unfortunately, our workplace is in a busy marina and to check if the play-backed boat noise doesn’t affect the other locations where we placed settlement plates, we need silence throughout the entire area. So, we had to stop and redo the measurements many, many times, because of incoming and departing boats, loud wind, cracking noise from the jetties or technical difficulties with our hydrophones.
We had one truly frustrating Friday afternoon when we wanted to test acoustic isolation but couldn’t get even five minutes of silence without a boat engine in the background for hours! And then, shortly before we had to catch the last bus home, we finally managed to do the test- and it was perfect. We had recordings without any disturbances and we had acoustic isolation- which meant we could run both experiments in parallel.
Then the wind blew the hydrophone from the jetty into the water, while we were packing up. Jana was over it and ready to give up, but Elin declared it the best thing that had happened that day. She had in the morning naively predicted a short workday with plenty of time to go snorkeling. Instead, she got special permission to go into the marina just this once – and gleefully fished out the hydrophone. Everything was done just in time before the last bus came and we decided never to test acoustic isolation on a Friday afternoon again.

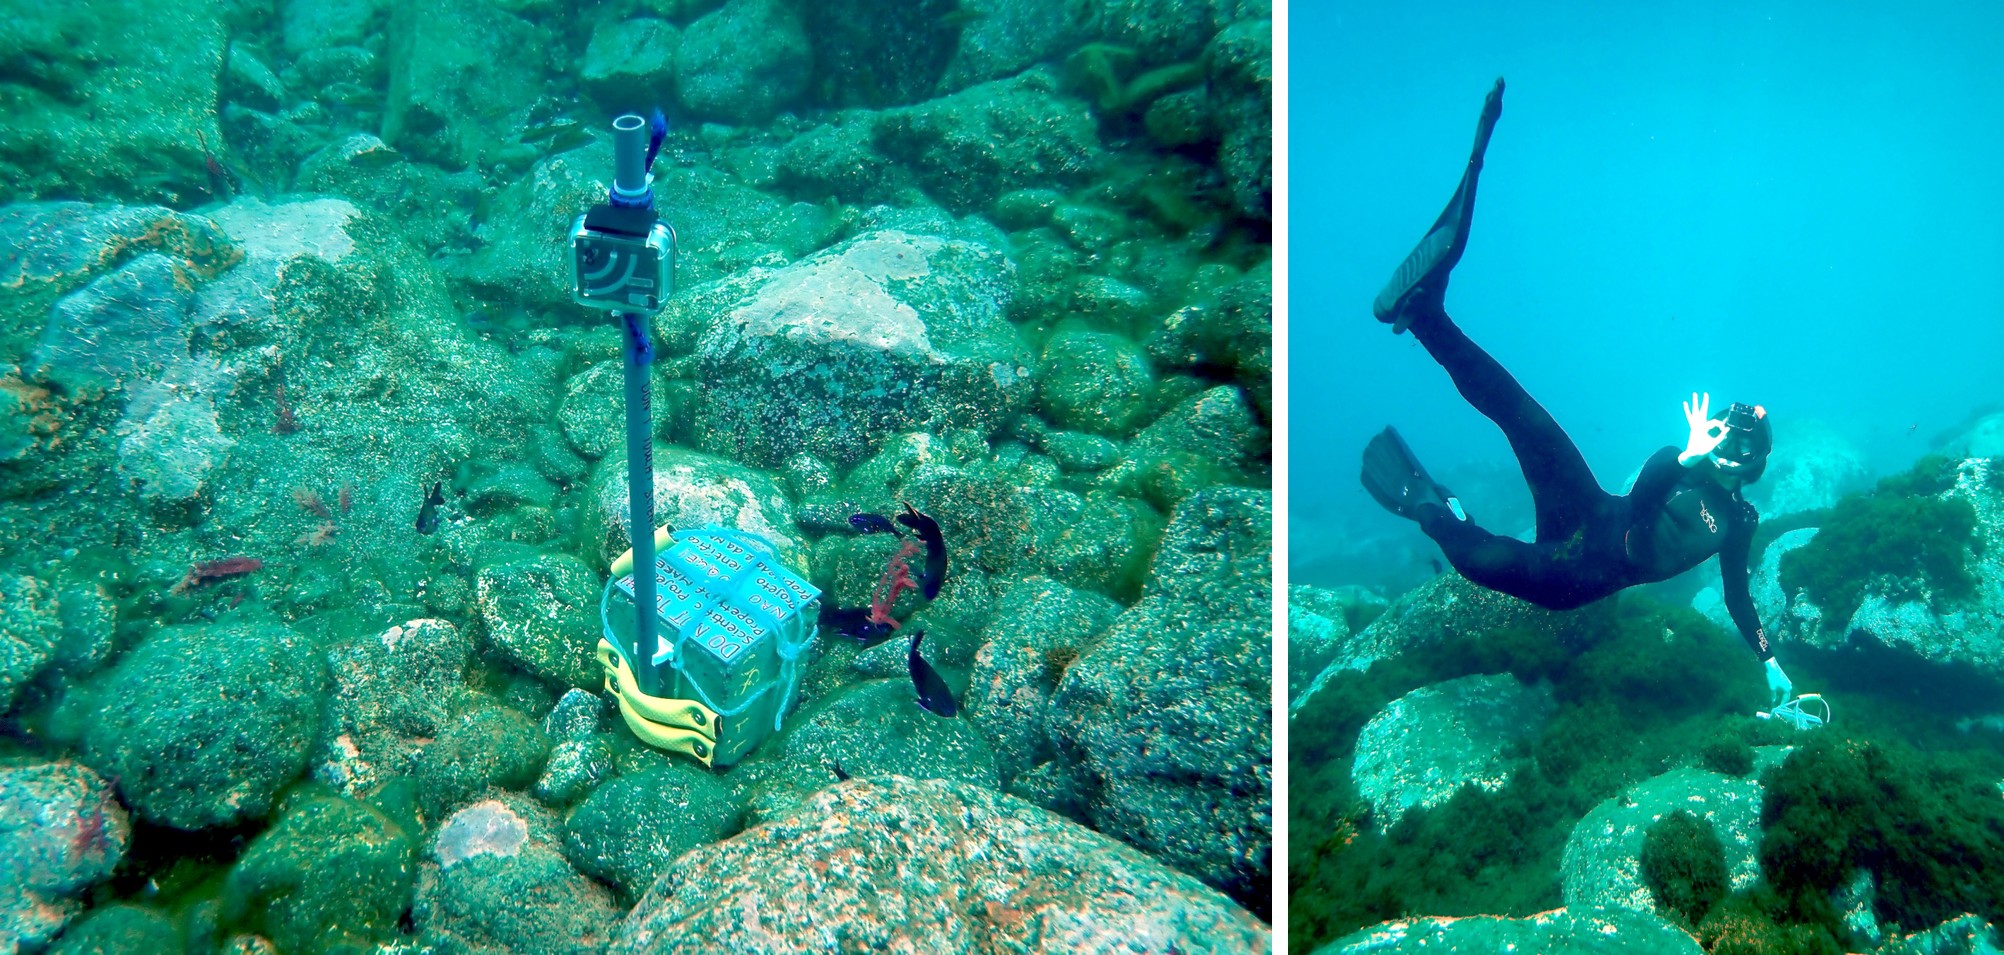
Since Jana studies the effects of natural soundscapes on larvae settlement, she needs to record the marine ecosystems of Madeira. The team at MARE helped her to choose a few promising locations, which best reflect Madeira’s rocky underwater landscape. They are in protected areas and have little boat traffic.We built six hydrophone stands, of which one was placed at each location with the help of a technical diver. The stands were constructed in a way that the hydrophone could be attached and detached by freediving from the surface, and this allows us to work independently of the diver. And, of course, to have the opportunity to go snorkeling for work :). For the first month it was just Elin who could hold her breath long enough to reach the hydrophone stand, which was in 5 to 8 meters water depth, because she had years of experience. But after training freediving while snorkeling in beautiful locations all over the island, first Niklas and then Jana figured it out and now we can divide this very popular task among the three of us.
Even when the project is running smoothly, there are always a million little things to think of, to plan and to organize. Our motto became ‘at least one of us is thinking’ – because of how often one of us forgot something or didn’t think ahead and the other one caught it just in time. And there is something to it. Even though we will write separate Master theses, we share the work and the responsibility, and it is amazing to work in a team in which you can truly rely on the fact that the other person cares just as much and is right there with you.
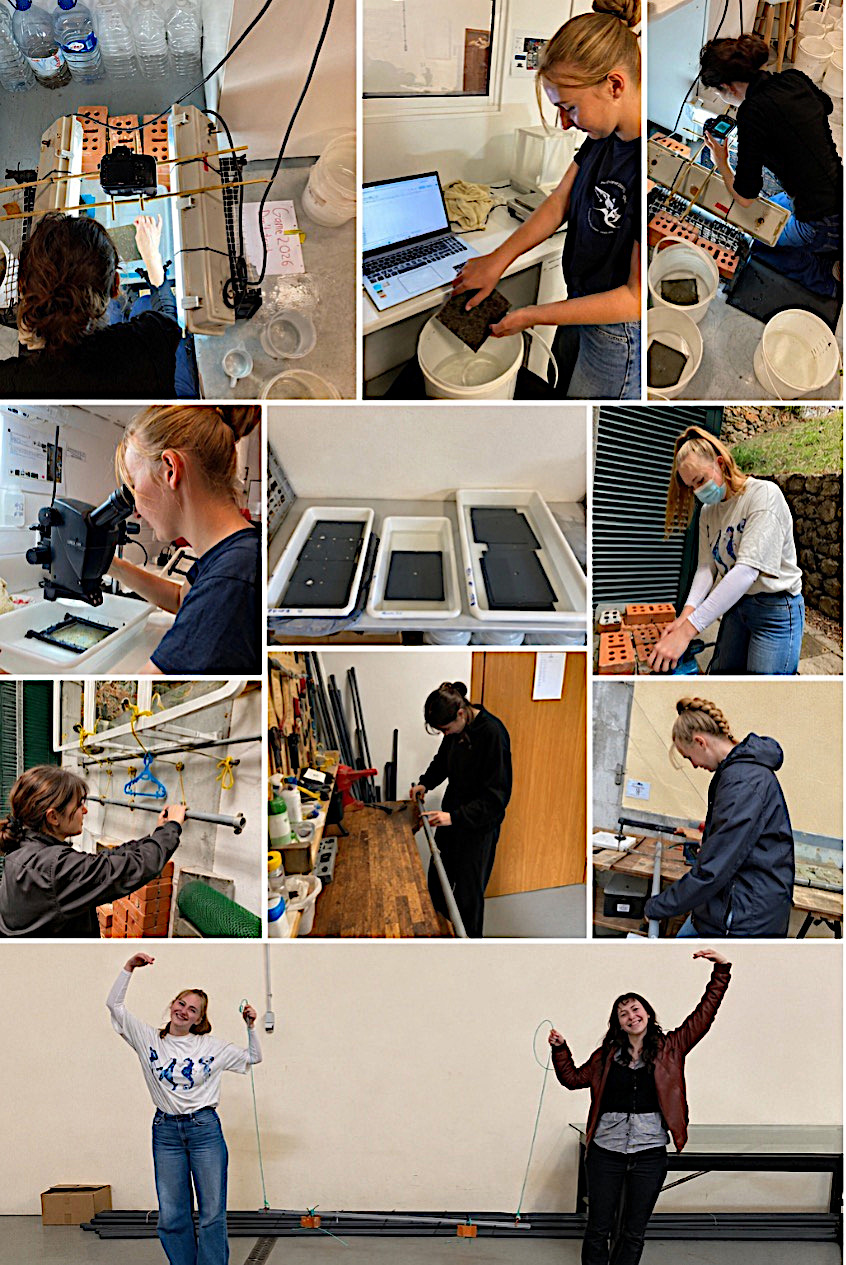
When we’re not in the workshop building our frames or glued to the binocular during long sampling days, we love to be in the water for snorkeling trips or go hiking in the beautiful mountains. The island’s nature is fascinatingly versatile, and after almost 5 months have passed now, we’re sure that we’ll never grow tired of the amazing views. There are so many Levada trails with waterfalls, hidden paths through the mountains and small towns to visit. Levadas are man-made irrigation channels on Madeira. They carry the water from the mountains from the north to the south. The network, which spans a total of 2,000 to 3,000 kilometers, is used today not only for agriculture but primarily as a world-famous hiking trail. We make a point to go exploring new places, but the joy of staying for half a year is that you get to find your favorites and come back to them.

We are really happy to have worked and lived here on Madeira, and we can’t believe that half a year has almost come to an end; we’d do it all over again in a heartbeat.
Did you know some female sea turtles can travel hundreds—or even thousands—of miles through open ocean before returning to nest on or near the very beaches where they hatched? In fact, Leatherback sea turtles take this long-distance travel to an extraordinary level. Pacific leatherbacks nesting in Indonesia have been documented migrating more than 10,000 kilometers to the West Coast of the United States. That’s the longest migration of any air-breathing marine vertebrate. So how do they accomplish this without Google Maps?
Scientists have found that sea turtles can sense magnetic information and use it as a navigational cue. Because the strength and angle of Earth’s magnetic field vary across the planet, these subtle differences can provide turtles with information about where they are and help guide their movements across the ocean. For turtles that return to their birthplace to nest (a behavior known as natal homing), these magnetic cues may be especially important. It’s an extraordinary system, but even the best navigation can take a turtle only so far.
Despite their great sense of direction, sea turtles don’t always make it where they’re going.
A sea turtle may be capable of navigating thousands of miles, but reaching the right destination is that much more of a challenge when human-caused obstacles lie in the way.
Artificial light is one example. Artificial lighting not only discourages nesting females from coming ashore but also has a harmful impact on hatchlings, which historically emerge from their nests at night and orient toward the brightest horizon. On a natural, undeveloped beach, that is generally the open ocean. But artificial light from coastal development can overwhelm the natural cue, drawing hatchlings inland away from the water and causing them to get lost on day one.
Coastal development not only brings more artificial light and human activity to the shoreline, but it also changes turtle habitats themselves. Buildings, roads and other development can alter or reduce areas sea turtles need for nesting. Shoreline armoring, such as seawalls, can eliminate the dry sand turtles need to successfully nest, while beach driving and other activities can further disrupt nesting habitats. And these challenges extend beyond the beach.
The ocean is getting noisier, too. Sea turtles have internal ears and can hear underwater sounds. Vessel traffic, oil and gas surveys, underwater construction and sonar all add noise to the marine environment. Human-generated sound can cause stress, disrupt normal behaviors or even force marine animals to move from preferred habitats or divert from migratory paths.
Get Ocean Updates in Your Inbox
Sign up with your email and never miss an update.
Evolution never saw the plastic grocery bag coming.
Then there’s a threat sea turtles encounter almost everywhere they travel: plastic pollution. Sea turtles evolved over millions of years to spot drifting prey, like jellyfish. But plastic rapidly started to be used only around 60+ years ago.
Our plastic trash entered the ocean so quickly that animals haven’t had time to adapt. To a hungry sea turtle, a floating plastic bag still looks enough like dinner to trick even an experienced turtle. Plastic bags, balloons, soft plastic packaging and other plastics, once swallowed, can block a turtle’s digestive tract or puncture internal organs. And it doesn’t necessarily take much.
A recent Ocean Conservancy study of more than 10,000 marine animal autopsies found that nearly half of the sea turtles studied had ingested plastic. Even more alarming, researchers found that for adult loggerhead turtles, swallowing just one and a half times the plastic in a golf ball was enough to kill 50% of these creatures.
It’s a heartbreaking reminder that something we use for minutes can threaten an animal that’s been roaming Earth’s ocean for more than 100 million years.
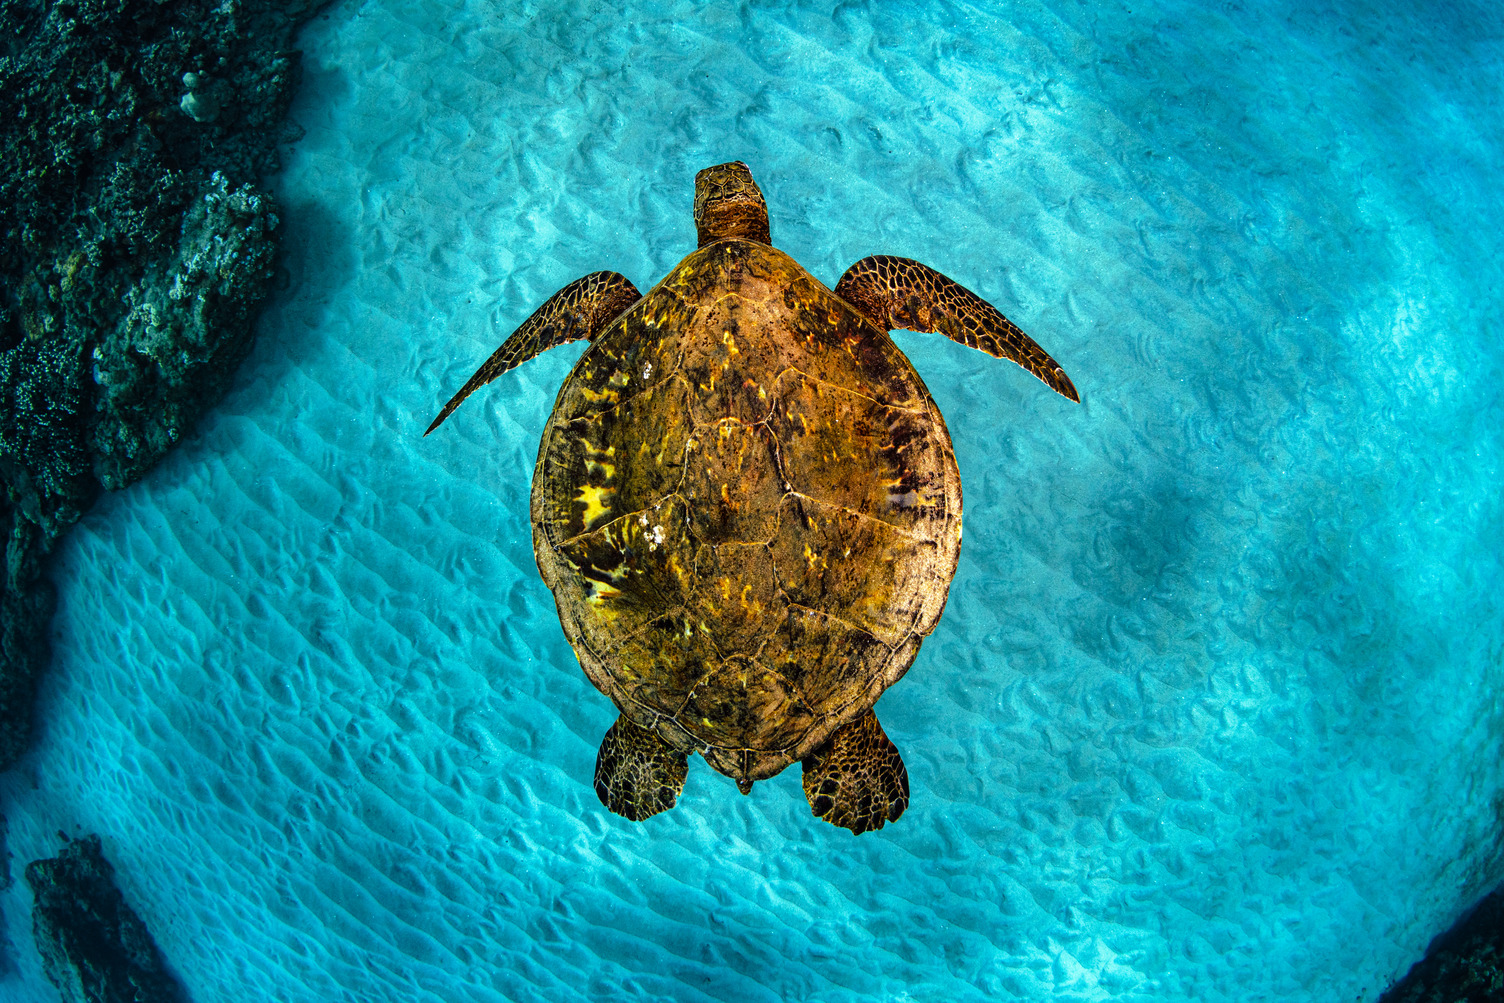
Ancient animals still face very modern threats.
Sea turtles survived the extinction event that wiped out dinosaurs. They’ve outlasted shifting continents and dramatic changes to our planet. But surviving millions of years doesn’t make them invincible. Today, they’re facing threats that appeared in the blink of an evolutionary eye: plastic pollution, habitat loss, vessel strikes, fishing gear entanglement and climate change. The remarkable thing is that many of these challenges aren’t inevitable. They’re problems we can all help solve.
Together, we can reduce the amount of plastic that reaches the ocean. We can protect and restore nesting beaches. And we can support policies that protect healthy ocean ecosystems. Every action helps make our waters a safer place for animals that depend on it.
So, do sea turtles get lost? When left to their own devices, not often. Sea turtles have an extraordinary ability to navigate across vast stretches of open oceans. But there’s a bigger question worth asking: Can we help make the ocean a safe place while they make these incredible journeys? Navigation is only part of the challenge for sea turtles trying to find their way home. Sea turtles may know where they’re going, but it’s our job to ensure the ocean and coastlines they depend on are safe when they get there. That’s why Ocean Conservancy is committed to protecting our entire ocean—and all the creatures that dwell there.
We’re fortunate to share the planet with these amazing creatures. Their journeys are a remarkable feat of science and survival. To all the turtles out there: Here’s to finding your way—wherever you’re going!
Visit Our Action Center
The post Do Sea Turtles Get Lost? appeared first on Ocean Conservancy.
https://oceanconservancy.org/blog/2026/08/27/do-sea-turtles-get-lost/



-

 Greenhouse Gases2 years ago
嘉宾来稿:满足中国增长的用电需求 光伏加储能“比新建煤电更实惠”
-
Climate Change1 year ago
Guest post: Why China is still building new coal – and when it might stop
-
Greenhouse Gases1 year ago
Guest post: Why China is still building new coal – and when it might stop
-

 Climate Change2 years ago
嘉宾来稿:满足中国增长的用电需求 光伏加储能“比新建煤电更实惠”
-

 Renewable Energy11 months ago
Sending Progressive Philanthropist George Soros to Prison?
-
Climate Change2 years ago
Bill Discounting Climate Change in Florida’s Energy Policy Awaits DeSantis’ Approval
-
Greenhouse Gases1 year ago
嘉宾来稿:探究火山喷发如何影响气候预测
-

 Carbon Footprint2 years ago
US SEC’s Climate Disclosure Rules Spur Renewed Interest in Carbon Credits