

A steep decline of Antarctic sea ice may mark a long-term transformation in the Southern Ocean, and seawater intrusions beneath the Thwaites Glacier could explain its melting outpacing projections.
Antarctica’s vast ice fields and the floating sea ice surrounding the continent are Earth’s biggest heat shields, bouncing solar radiation away from the planet, but two studies released today show how global warming is encroaching even on the sunlight reflector in the coldest region on the planet.
In Two New Studies, Scientists See Signs of Fundamental Climate Shifts in Antarctica


A temporary breach of the 1.5C global-warming limit is now “inevitable” following “decades of insufficient climate action”, says the UN Environment Programme (UNEP).
In its “sobering” annual assessment of the global “emissions gap”, UNEP says that exceeding the Paris Agreement’s 1.5C limit is “imminent and unavoidable”.
This year’s report, titled “The point of return”, says the “task now” is to minimise the size and scale of a temperature “overshoot” and to “establish a credible return path to 1.5C by the end of the century”.
Even the “lowest possible” overshoot scenario for 1.5C would first see global warming peak at around 1.7-1.8C in the middle of the century before declining, says the report.
This scenario – which is “still aligned with the long-term temperature goal of the Paris Agreement” – would require global emissions cuts of 18% by 2030 and 45% by 2035, while ramping up “removals” of carbon dioxide (CO2) from the atmosphere, says UNEP.
In contrast, it notes that the current climate pledges by countries around the world – even if fully implemented – would only reduce emissions by 5-8% by 2030 and 11-15 % by 2035, relative to 2025 levels.
Nonetheless, the report identifies “ample opportunity to accelerate action”, concluding that “countries can still limit peak warming, shorten the duration of overshoot and keep the goals of the Paris Agreement within reach”.
(See Carbon Brief’s detailed coverage of previous reports in 2014, 2015, 2016, 2017, 2018, 2019, 2020, 2021, 2022, 2023, 2024 and 2025.)
Emissions ‘comparable’ between 2024 and 2025
The report says that emissions in 2025 were “comparable” to those of 2024.
Global greenhouse gas emissions in 2025 totalled 58.4bn tonnes of CO2 equivalent (GtCO2e), according to the report. This is around 0.16GtCO2e lower than 2024 levels – albeit, with high levels of uncertainty around the numbers.
In addition, because the figures presented in the 2025 report are “provisional”, the report says, it is “not possible to conclude on the overall direction of emissions in 2025”.
The emissions growth rate has been slowing down in recent decades: the growth rate over 1990-2015 was, on average, 1.7% per year, while emissions have increased by an average of 0.8% per year since 2016.
The chart below shows the total human-driven emissions between 1990 and 2025, separated by greenhouse gas: CO2 from fossil-fuel combustion (dark grey), methane (light grey), nitrous oxide (blue), fluorinated gases (orange) and CO2 from land-use change (green).
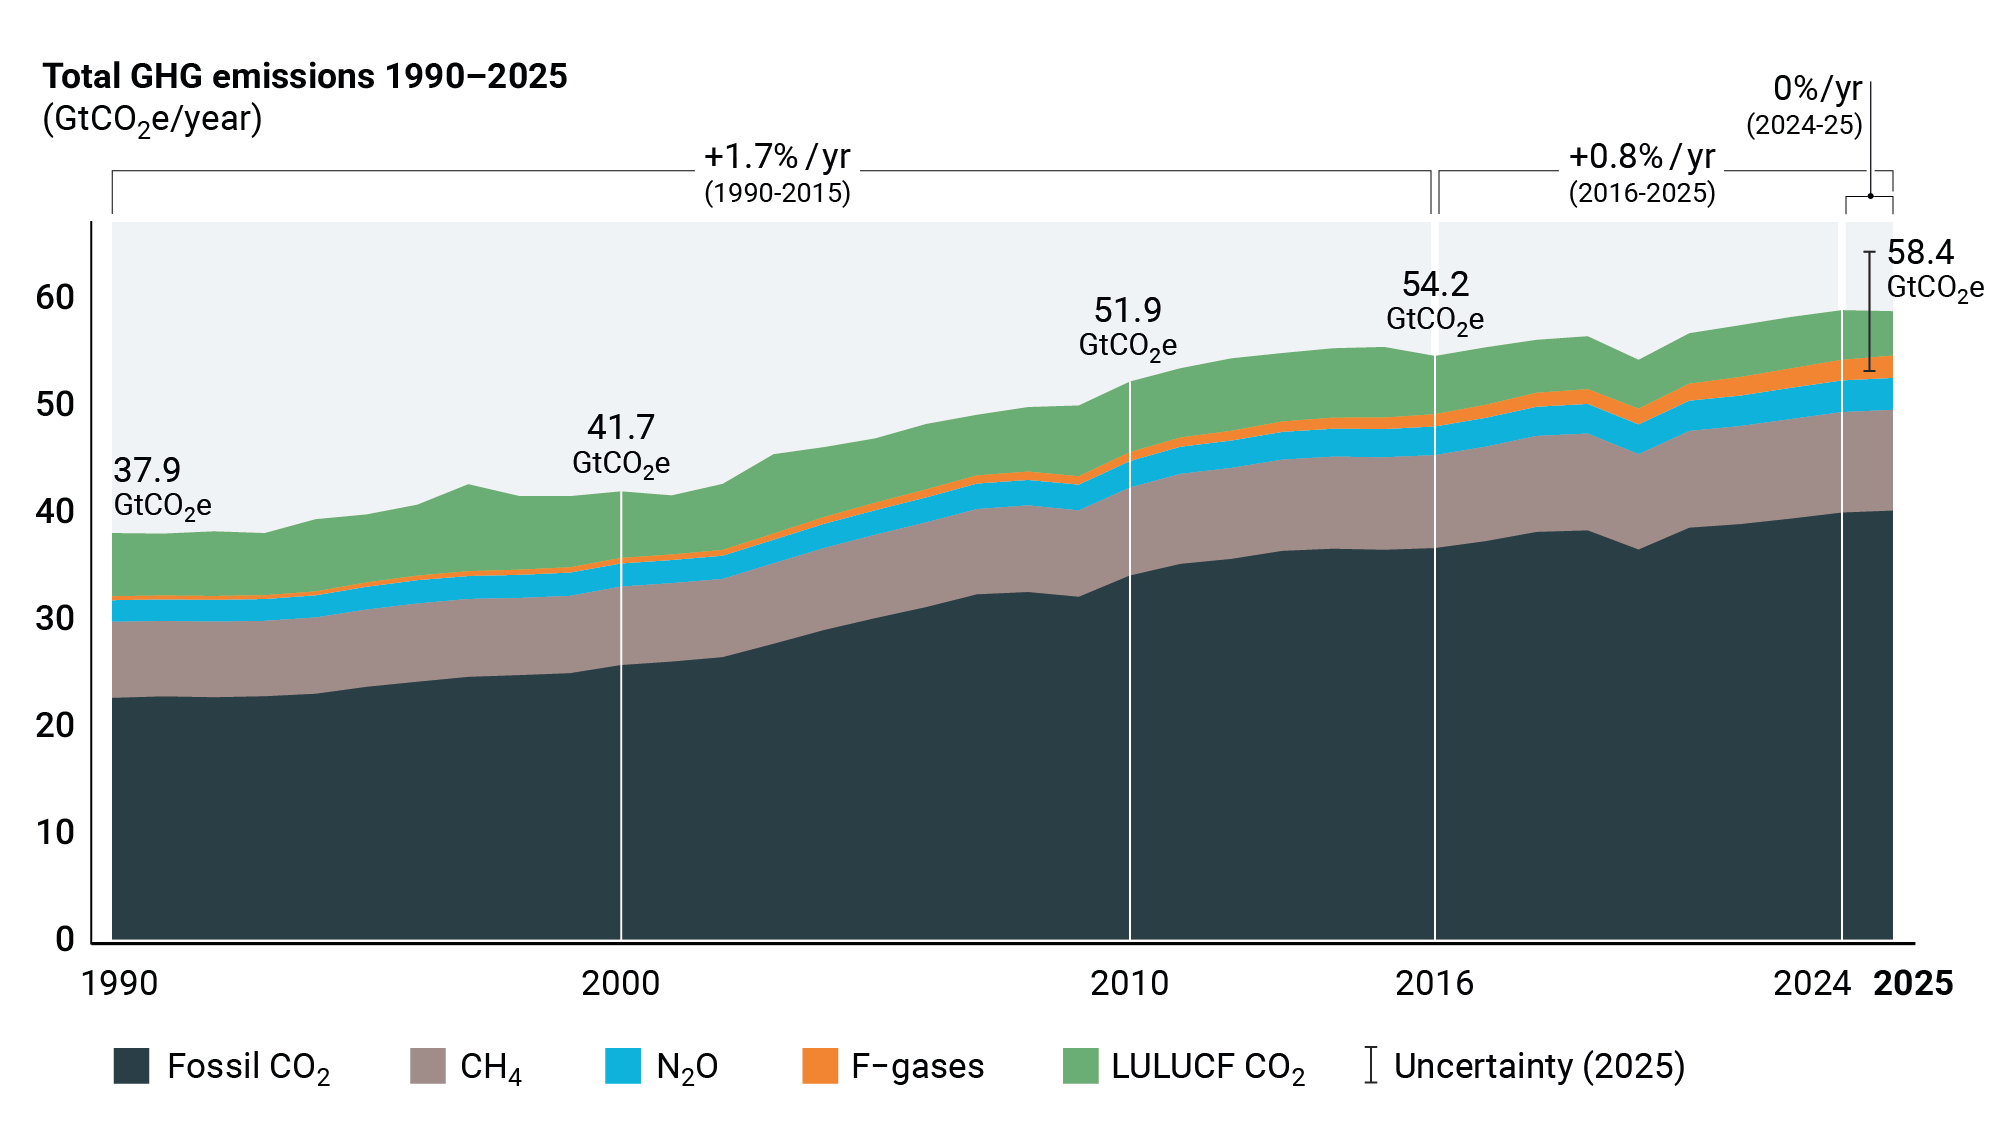
Compared to 2024, emissions from fossil fuels increased slightly, by between 0.4-1.1%, says the report. Emissions of both nitrous oxide and fluorinated gases increased by even higher rates, but since these comprise such a small part of total greenhouse gas emissions, “their contribution to the overall trend is relatively less significant”, it adds. Methane emissions remained steady over that time.
A reduction in the CO2 emissions from land use, land-use change and forestry (LULUCF) “slightly overcompensates” for the rise in emissions of fossil-fuel CO2 and other gases, according to the report. (For more on falling land-use emissions, see Carbon Brief’s explainer.)
The decrease in LULUCF emissions was “partially driven” by a decline in global wildfire emissions, particularly in Africa, South America and parts of south-east Asia. The report notes that these decreases were “likely connected to the ceasing of El Niño conditions”. The ongoing “super” El Niño is likely to cause LULUCF emissions to increase in 2026.
The report also examines countries’ contributions to the increase in greenhouse gas emissions – although here, it excludes LULUCF due to a lag in national-level emissions inventories for the sector.
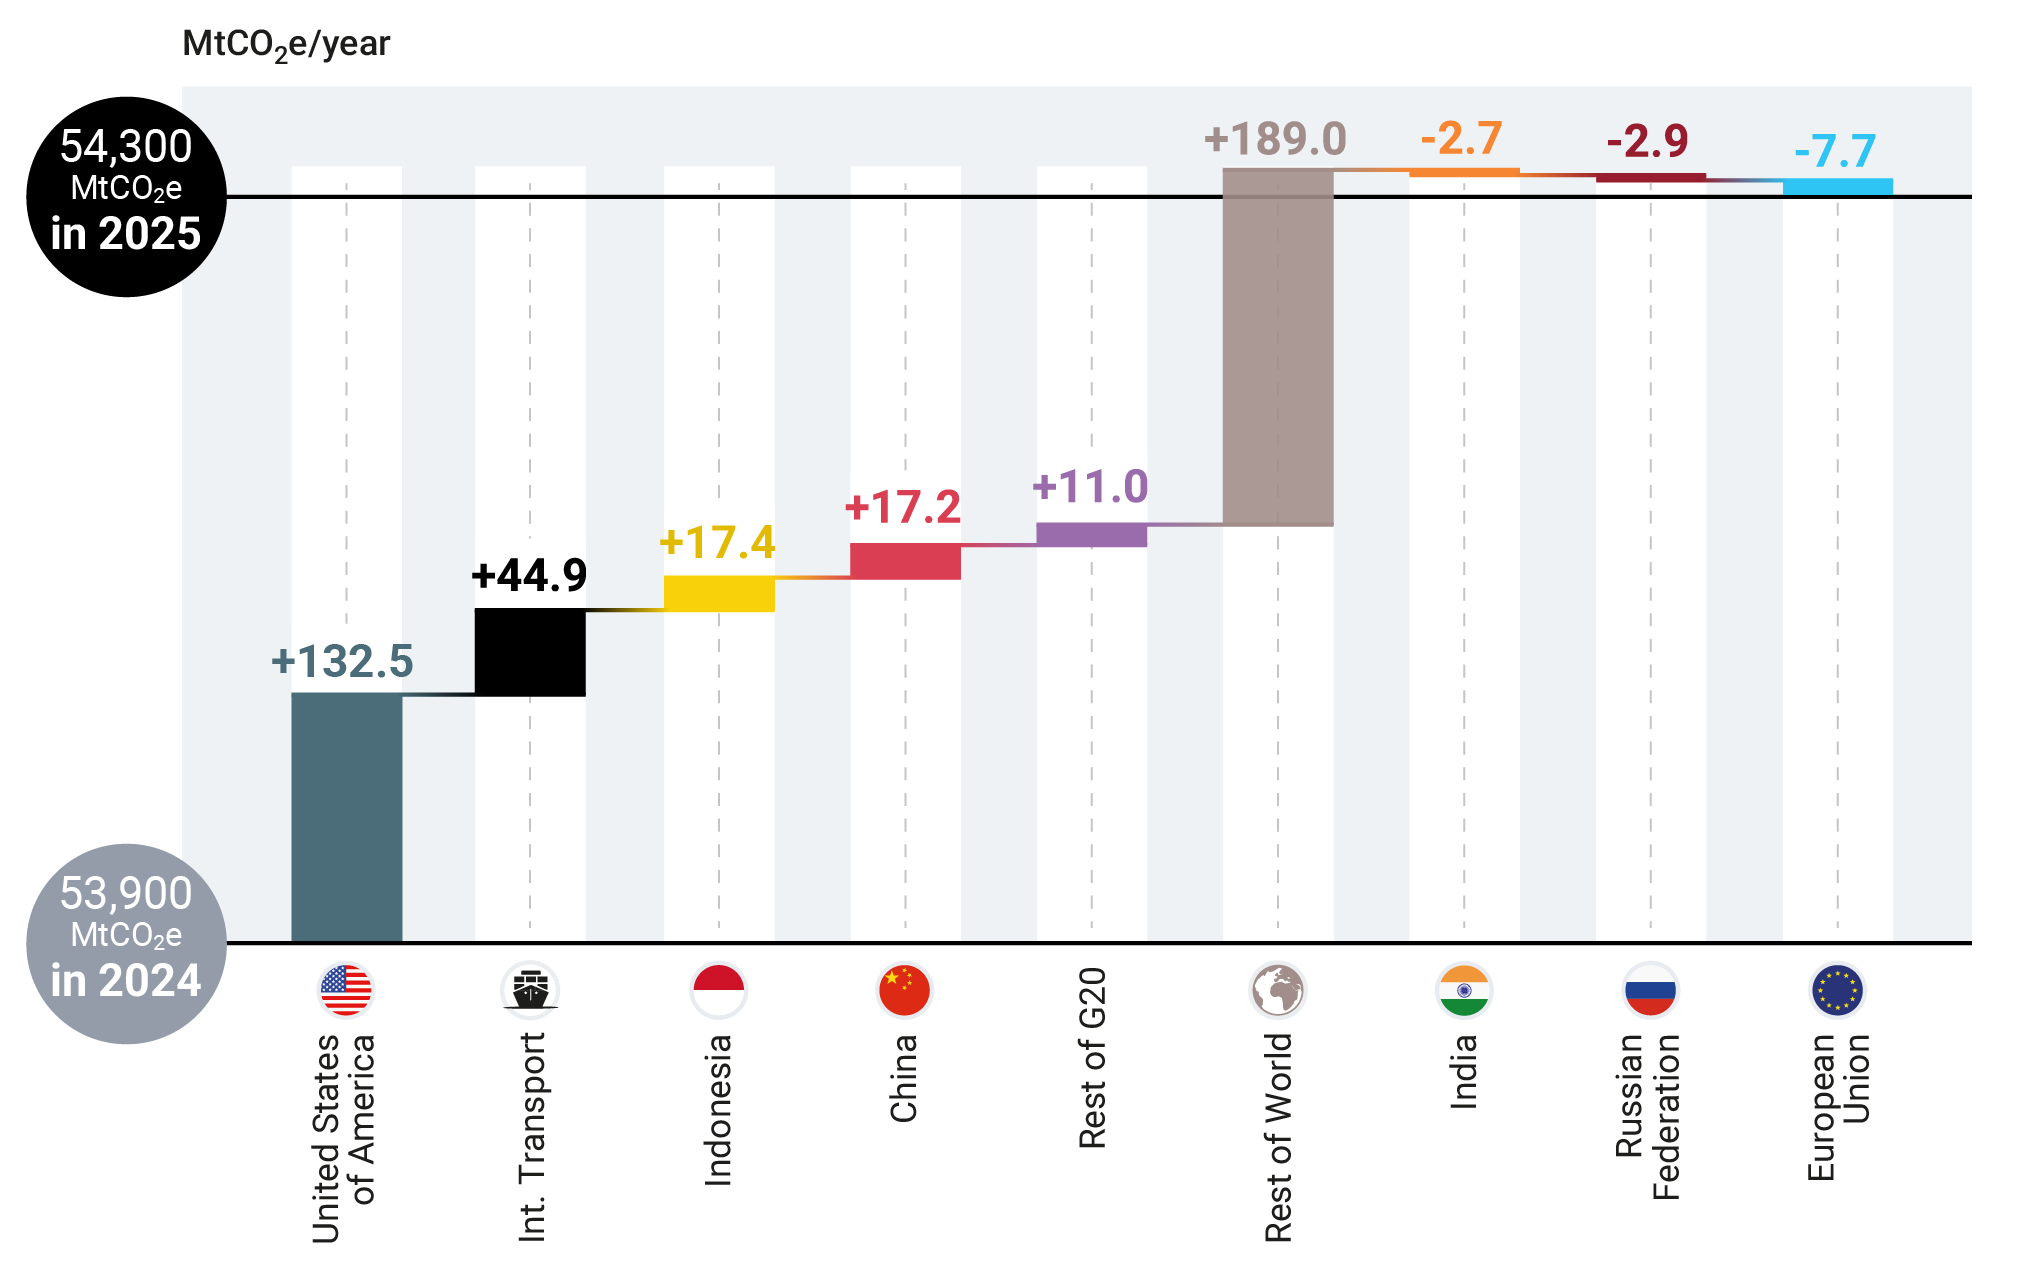
Among the top six emitters, only the US saw a notable increase in 2025, says the report, whereas emissions in China, the EU, India, Russia and Indonesia were relatively flat. Emissions in the US grew by 133m tonnes of CO2e (MtCO2e) in 2025, due to increased electricity demand and a “rebound” of coal power. This growth in US emissions is likely due to a combination of market factors, including increased heating demand due to a colder winter, higher gas prices and overall increased electricity demand.
The changes for the six largest emitters, the rest of the G20 countries, international transport and the rest of the world can be seen in the chart below.
Across most sectors, progress towards decarbonisation has been “modest”, says the report. The most notable decreases have occurred in the power sector and the transport sector, due to the growth of solar power and electric vehicles. The report notes:
“There are emerging signs of transport sector electrification and decarbonisation, but at rates and levels that are not yet sufficient to drive emissions reductions at the global level.”
However, emissions from the transport sector have continued to grow, due to increased demand for international aviation and shipping.
The report notes that while electricity demand from data centres is “projected to double” by 2030, data centres at present account for less than 1% of total emissions.
New NDCs would reduce emissions ‘far from what is needed’
All countries were meant to submit new UN climate pledges for 2035, known as the third nationally determined contributions (NDCs) to the Paris Agreement, by February 2025. However, 95% of nations missed this deadline.
Many countries came forward with their third NDCs at a UN climate summit in New York in September 2025 and at the COP30 climate summit in Brazil in November 2025.
By the end of COP30, 122 – or 63% – of countries had produced their third NDCs.
The report says that figure had risen to 124 by 1 September 2026, with pledges now covering 75% of global emissions.
This is more than double the number of third NDCs available at the time of the 2025 emissions gap report – allowing a “more robust basis for assessing collective progress and ambition toward 2035”, says the report.
Although the first global stocktake of action towards the goals of the Paris Agreement called for countries to submit targets “covering all greenhouse gases”, there has only been a “modest” increase in the number of nations to do so, according to the report.
It says that eight countries included greenhouse gas targets for the first time in their third NDCs, bringing the total number parties with such targets up to 155.
The third NDCs “increasingly use more robust and verifiable target formulations”, such as standardised baselines, says the report.
However, they have not “meaningfully broadened the scope of sectors and gases covered by the targets”, it adds.
If the third NDCs were implemented in full, it would lower global emissions in 2035 by 3.5GtCO2e, compared to 2030 targets, says the report.
It says this is “far from the global reductions needed to get on track to achieving the long-term temperature goal of the Paris Agreement”.
Compared to the 2025 report, the projections for global emissions in 2035 as a result the third NDCs are about 3GtCO2e higher.
This is down to the formal withdrawal of the US from the Paris Agreement, as well as from “harmonising” the projections with the latest historical emissions data, says the report.
The global “implementation gap” for 2030 – defined as the difference between countries’ projected emissions under current policies and the emissions expected if they implemented their NDCs in full – has narrowed compared to last year, says the report.
However, this is mainly due to the withdrawal of the US from the Paris Agreement. In other words, the narrowing of the gap is due to “policy changes, not policy progress”.
The implementation gap for both 2030 and 2035 are of a similar size – suggesting “enhanced collective ambition of 2035 NDCs is weak”, continues the report.
Some 14 of the 17 G20 nations, counting the EU as one, have submitted new NDCs with emissions targets for 2035, says the report.
However, the emissions trajectories of the majority of G20 nations remain “misaligned” with their net-zero targets, says the report.
The chart below shows the gap between nations’ current emission trajectories and their NDC targets for 2030 and 2035 (diamonds), along with their net-zero targets (circles).
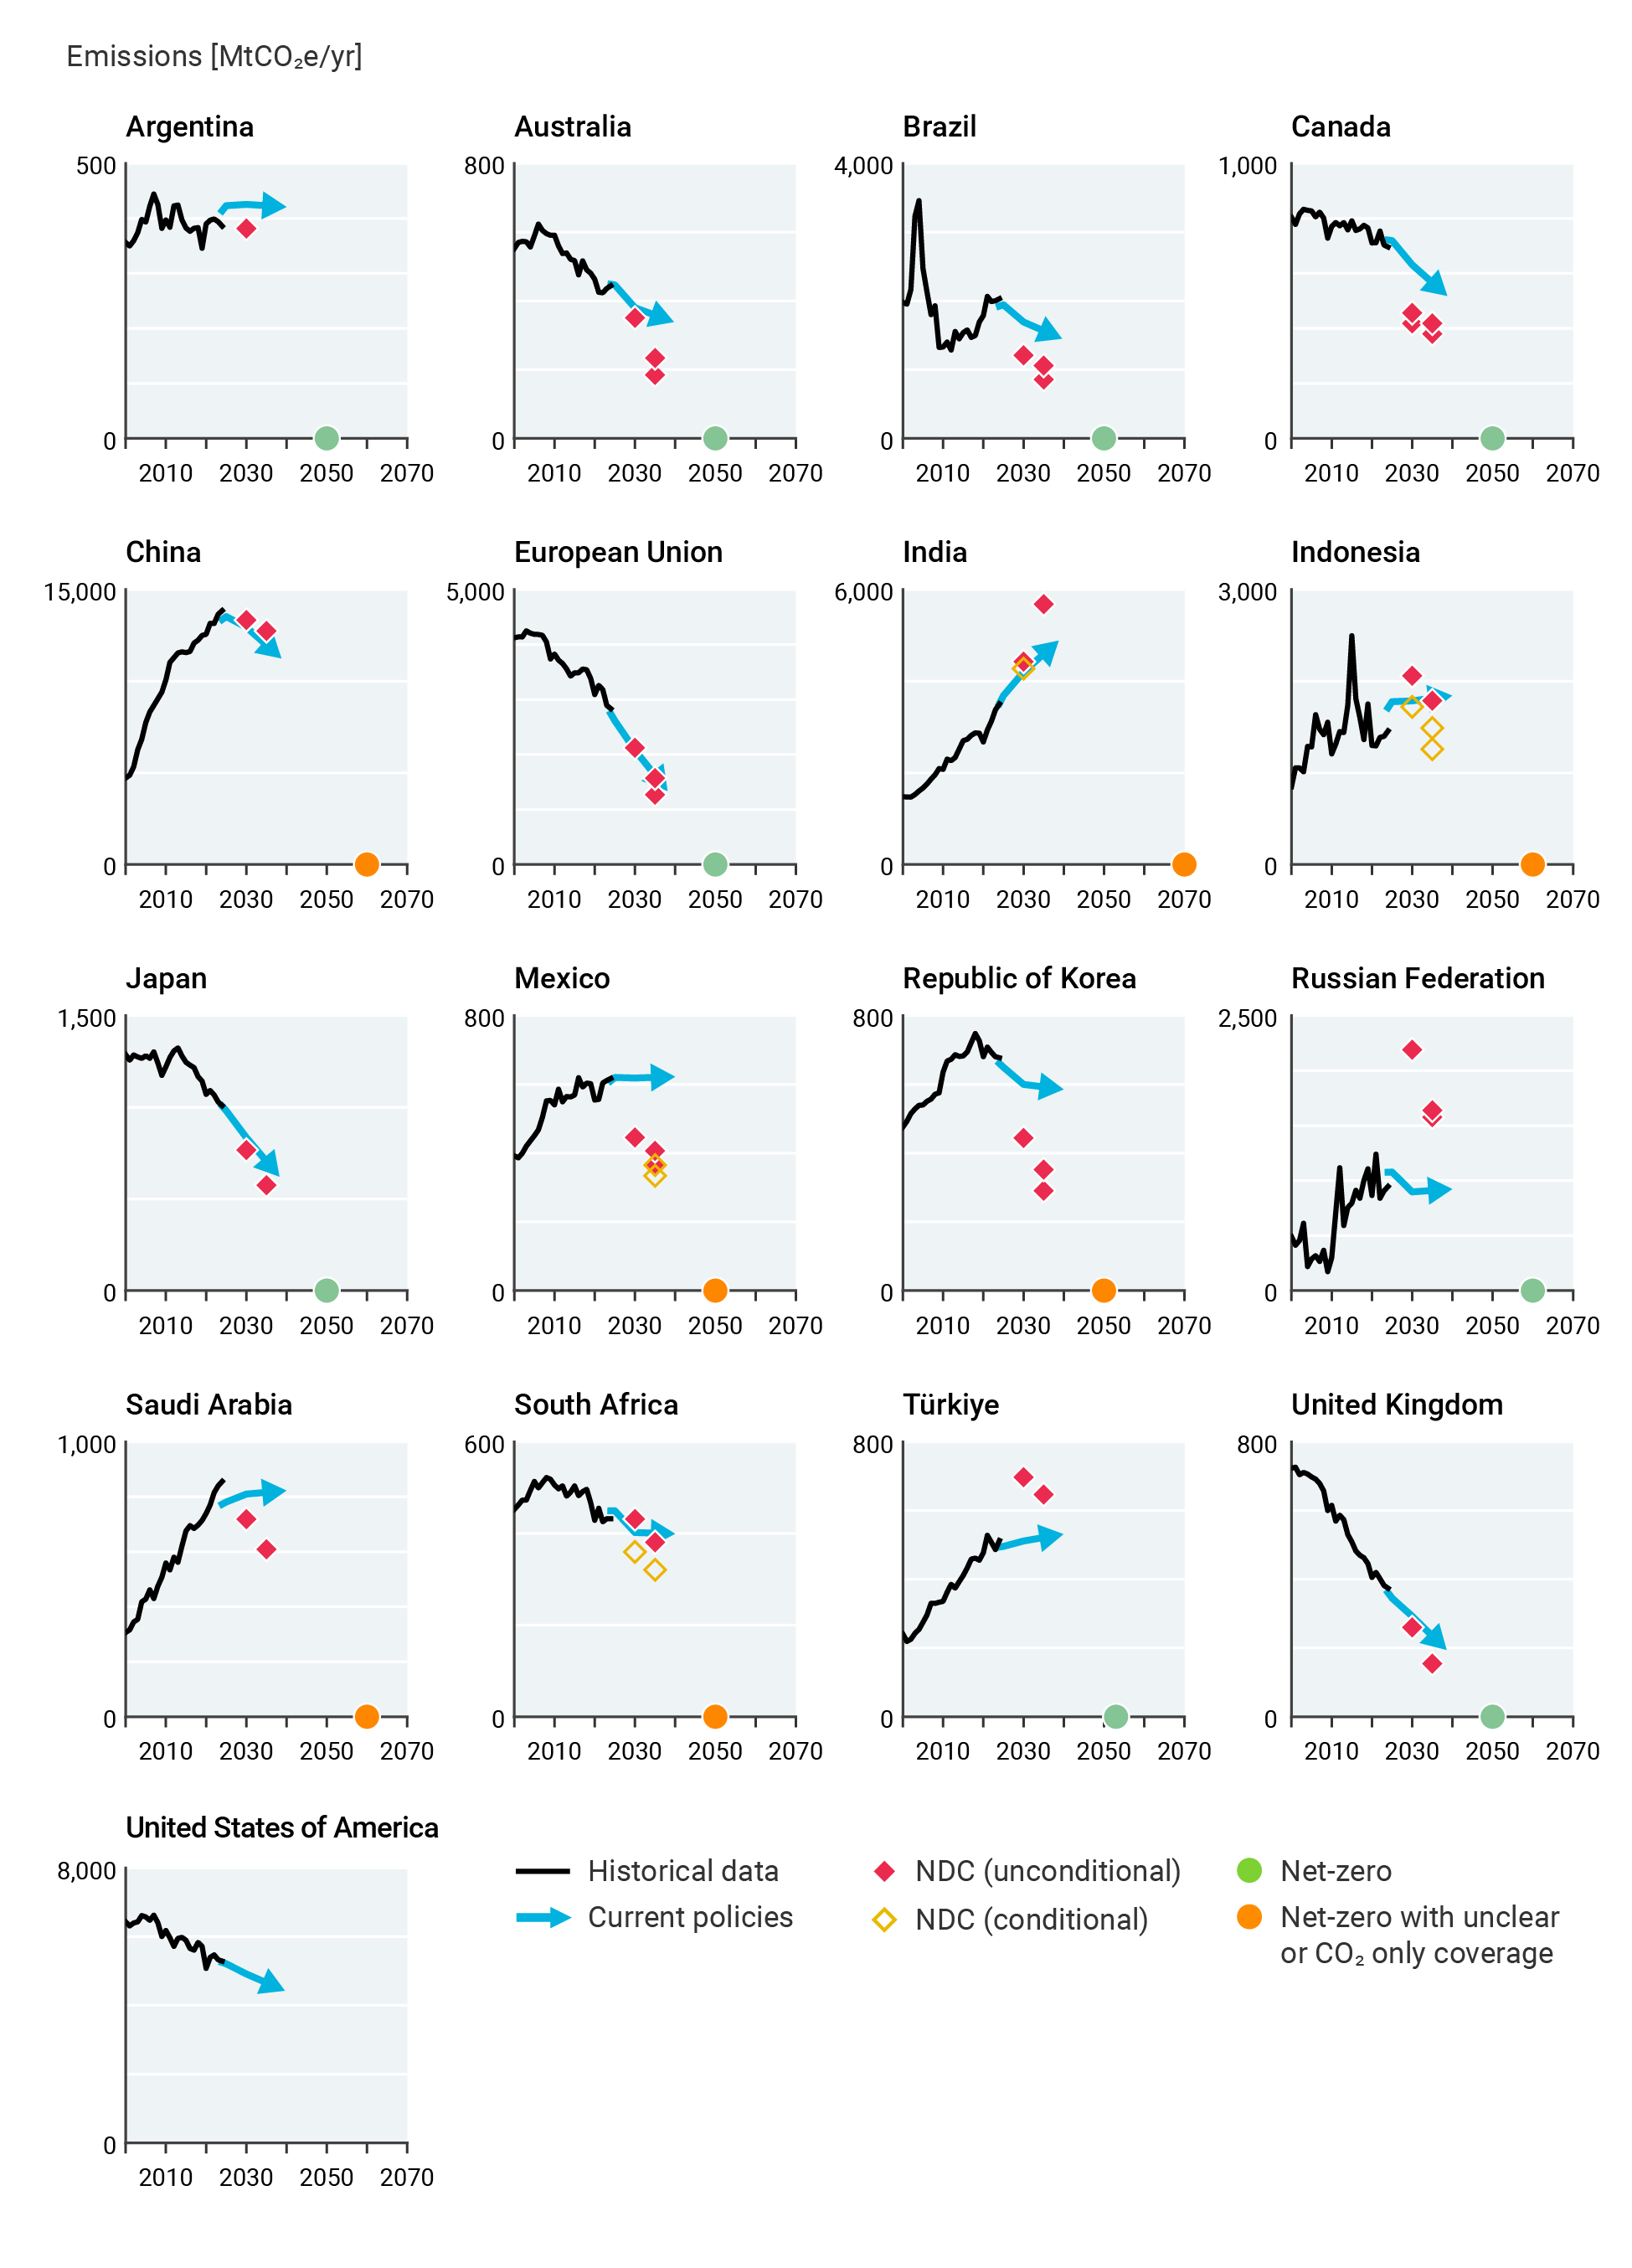
All G20 members except Japan, the EU and UK would need to “accelerate their emission reduction rates based on current policies” to achieve their net-zero targets, adds the report.
Emissions gap is ‘still large’
The report goes on to estimate the “emissions gap” – the difference between projected global emissions if all NDCs are met in full and what would be needed to achieve the long-term temperature goal of the Paris Agreement.
The report assesses a range of potential future pathways – some that have been assessed in previous reports and some new. The three core “NDC scenarios” are:
- A “current policy” scenario, which projects global greenhouse gas emissions based only on policies adopted and implemented as of November 2025.
- An “unconditional NDCs” scenario, which projects greenhouse gas emissions assuming full implementation of the most recent NDCs that do not depend on external support (with a cut-off date of 1 September 2026).
- A “conditional NDCs” scenario that further assumes that the implementation of NDCs that depend on external support, such as climate finance from wealthier countries (also with a cut-off date of 1 September 2026).
As with the 2025 report, the authors also analyse two “scenario extensions”, which explore the implications of current policies, NDCs and net-zero pledges beyond 2035:
- A “current policies continuing” scenario, which “follows current policies to 2035 and assumes a continuation of similar efforts thereafter”.
- A “conditional NDCs plus all net-zero pledges” scenario, which is “the most optimistic scenario included”. This scenario assumes the “conditional NDC” scenario is achieved until 2035 and then all net-zero or other long-term low emissions developments strategies are followed thereafter, excluding that of the US.
In previous reports, the authors have compared all of these scenarios against pathways that hold warming below 2C and 1.8C, or against 1.5C with no more than 0.1C of “overshoot”.
(Overshoot refers to pathways where global warming first exceeds the 1.5C limit and is then brought back down through techniques that remove carbon from the atmosphere.)
These three warming pathways were drawn from the scenario database for the mitigation report of the Intergovernmental Panel on Climate Change’s (IPCC) sixth assessment (AR6).
These scenarios were developed around 2015-20 and assumed that the world would pursue immediate emissions cuts from around 2020. However, in reality, emissions have continued to rise. As a result, the report says, those temperature pathways “have become outdated”.
For example, the authors explain, emissions are currently around 80% above the level that would have been needed by 2030 to limit warming to 1.5C with no or “low” overshoot.
Therefore, as a result of “decades of insufficient emission reductions”, the possibility of limiting warming to 1.5C with limited or no overshoot “has now been lost”, say the authors.
The 2026 report instead “draws on a new generation of pathways in which ambitious mitigation action starts from 2025”. These are:
- A “below 2C” scenario, which is consistent with keeping global warming below 2C throughout the 21st century, with at least a 66% chance.
- A “lowest 1.5C overshoot” scenario, which keeps warming to 1.7-1.8C throughout the entire century (with a 66% chance) and returns it to 1.5C by 2100 (with a 50% chance).
These updated scenarios “reflect the failure to cut global emissions to date”, note the authors.
The overshoot scenario “minimise[s] both the magnitude and duration of overshoot above 1.5C”, say the authors, while meeting a defined set of “feasibility and sustainability guardrails”. These include, for example, balancing the demands of bioenergy and large-scale carbon removals with biodiversity and food security needs.
The task to “minimise” overshoot reflects the wording of the “Global Mutirão” package of measures agreed at the COP30 climate summit in Brazil in 2025. This acknowledged – for the first time in a COP text – that there was likely to be an overshoot of 1.5C and urged that both its extent and duration needed to be “limit[ed]”.
The chart below, taken from the report, shows how the emissions pathways compare to each other, as well as historical emissions and the 1.5C pathway used in previous reports.
The right-hand section shows the “unbridgeable gap” to pathways that limit warming to 1.5C with overshoot of no more than 0.1C.
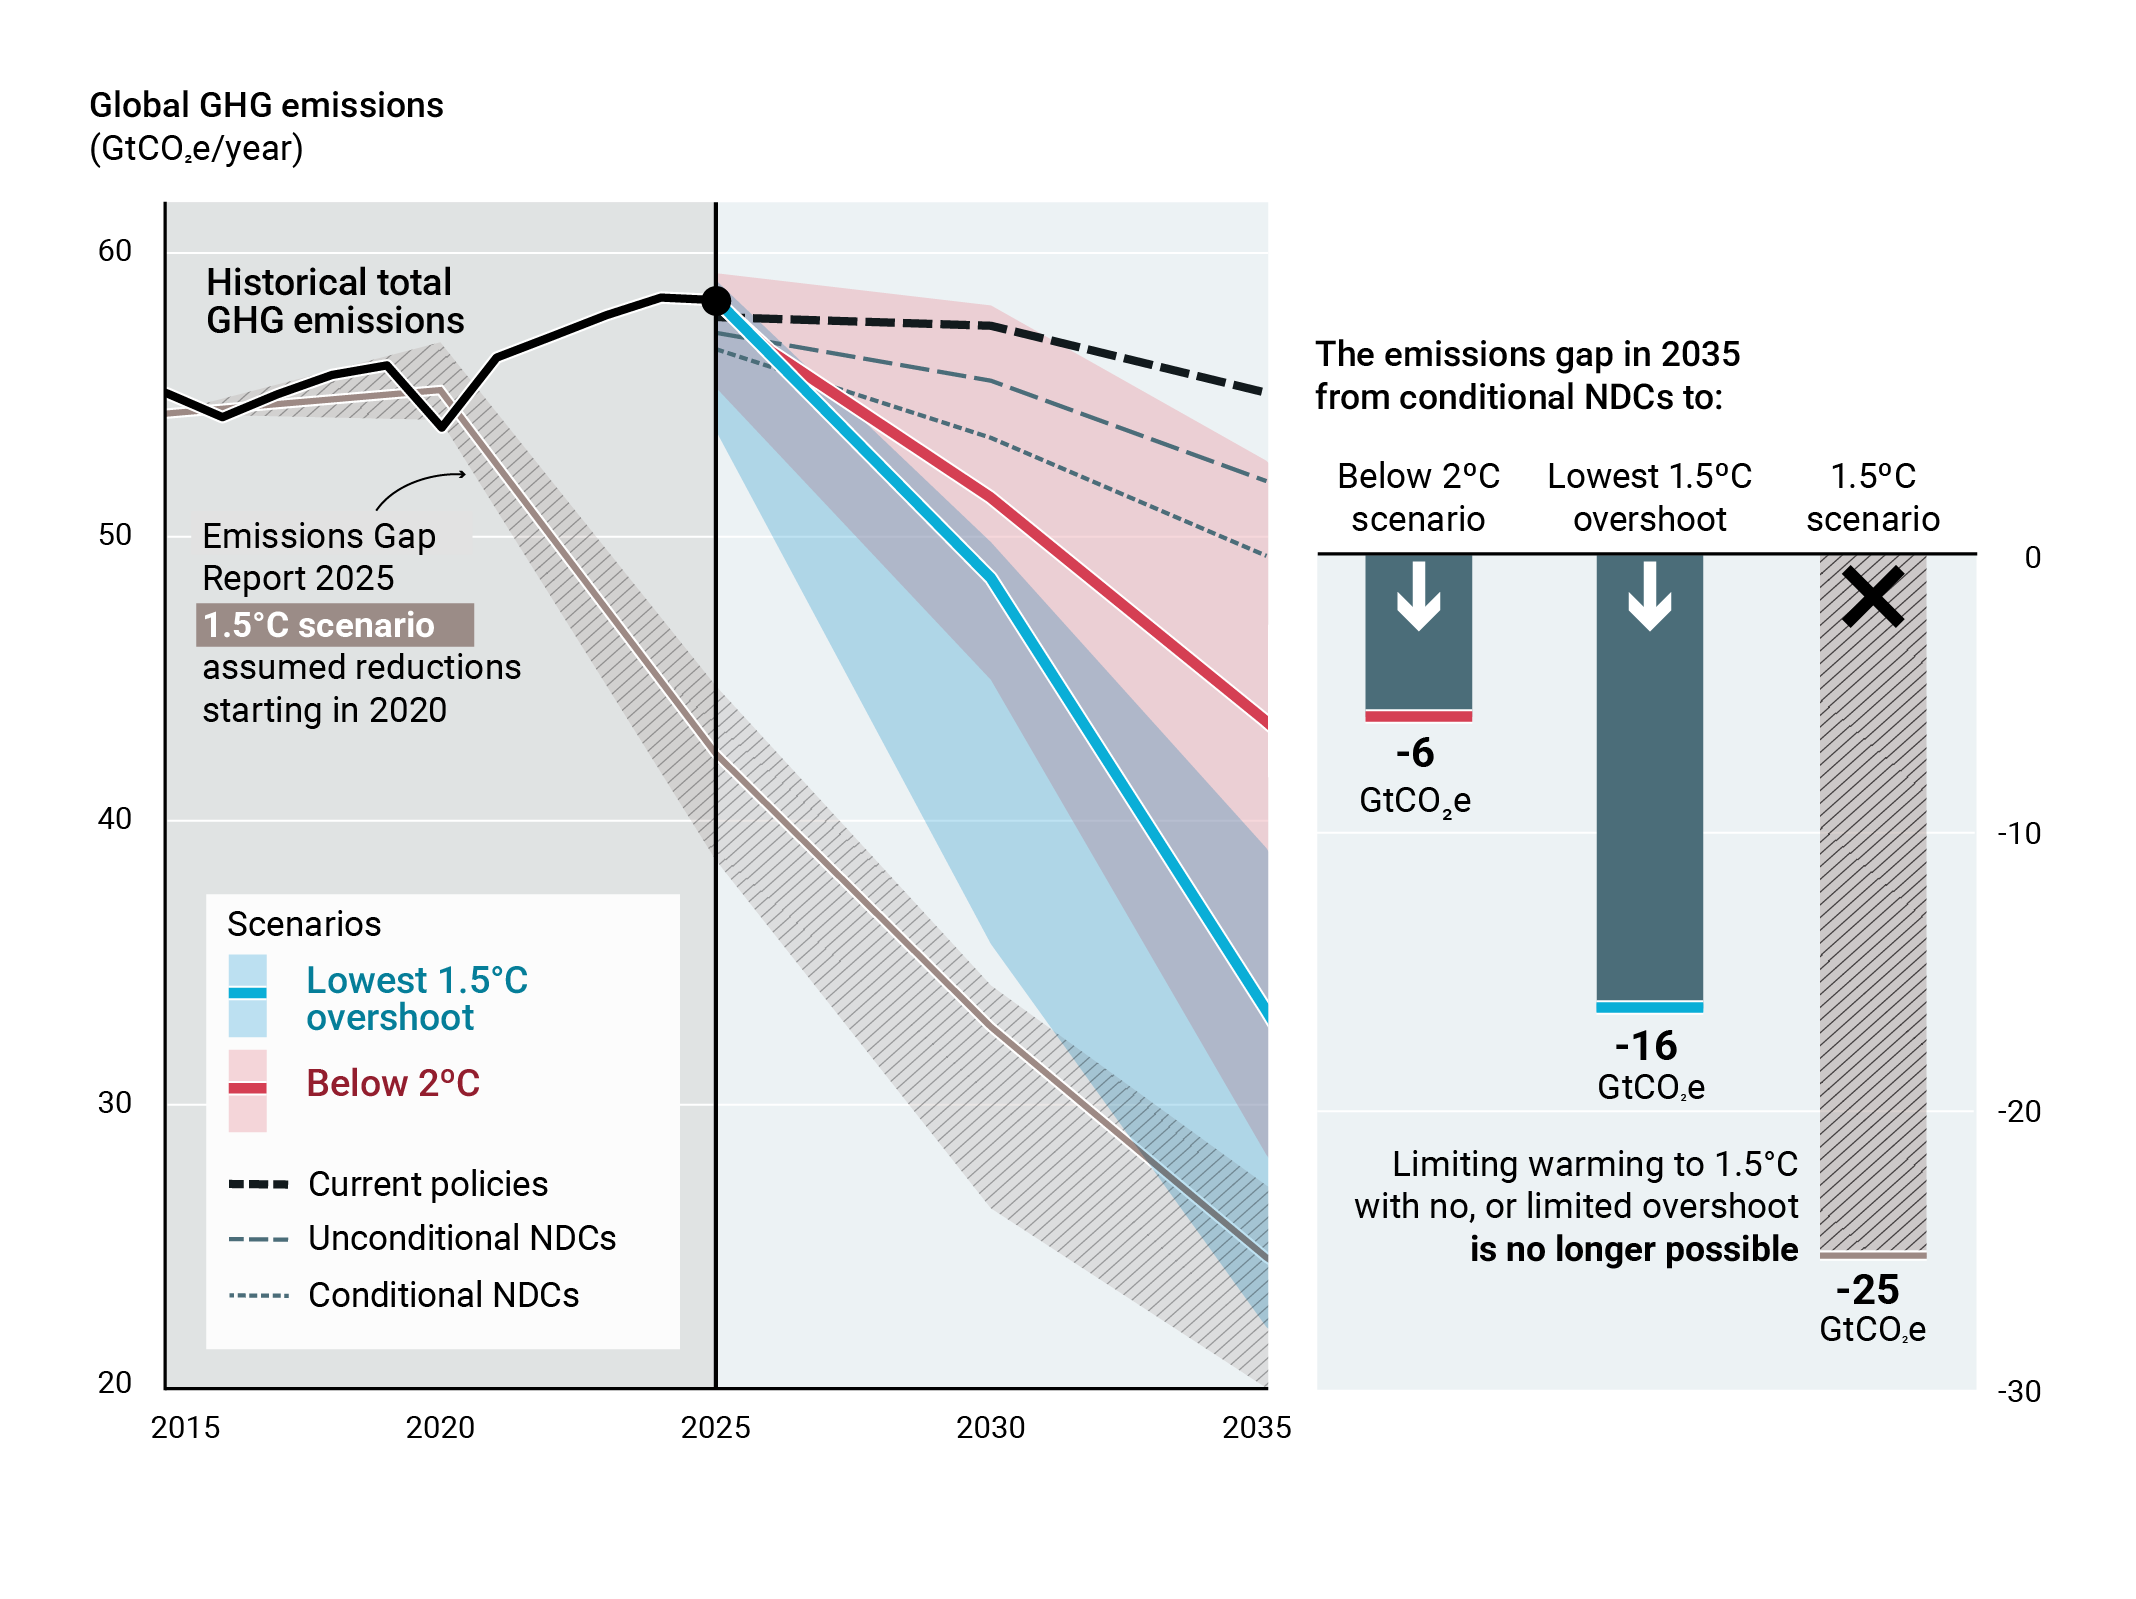
The lowest 1.5C overshoot scenario requires “immediate, deep, rapid and sustained reductions”, says the report. Global greenhouse gas emissions would need to fall by 18% by 2030, 45% by 2035 and 69% by 2040, relative to 2025 levels. Global net-zero CO2 emissions would be reached around 2050.
These benchmarks for 1.5C effectively replace those in the IPCC’s AR6, which specified reductions of 43% by 2030 and 60% by 2035, relative to 2019 levels. These have been frequently cited in COP decisions and other declarations.
With the ongoing uncertainty around the timeline for the IPCC’s seventh assessment reports, the benchmarks in the UNEP report provide an important update on the emissions cuts required to limit overshoot.
For the 2C scenario, global greenhouse gas emissions would need to drop by 11% by 2030, 24% by 2035 and 37% by 2040, relative to 2025 levels, the report says.
The table below sets out the estimated emissions from the NDC scenarios and the gaps to the new “below 2C” and “lowest 1.5C overshoot” scenarios.
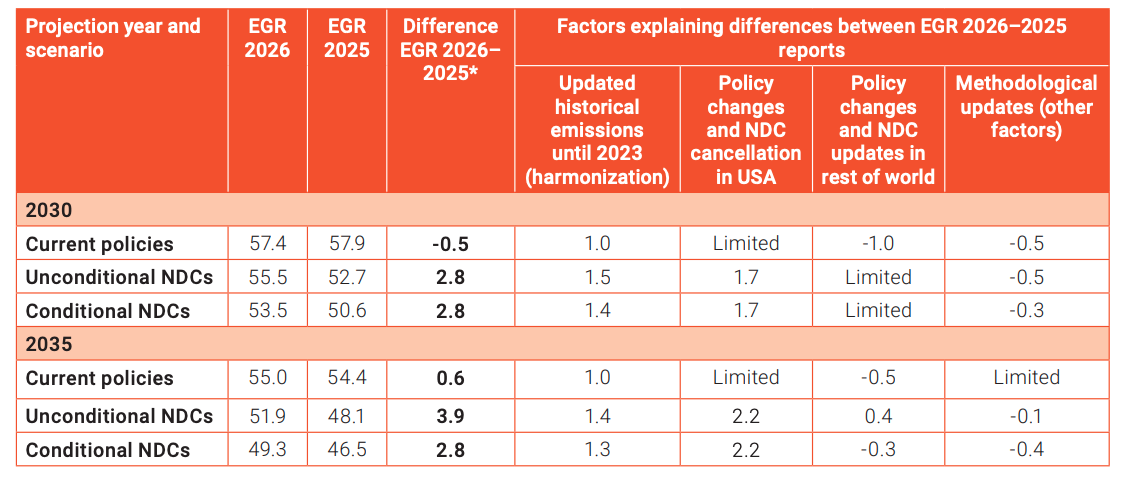
These emissions gaps are “still large”, say the authors, with current NDCs and net-zero targets not being “enough to minimise overshoot”.
(The report also notes that because the 1.5C and 2C scenarios have changed, the emissions gaps in 2026 are not directly comparable with previous reports.)
Putting the world on track for the lowest 1.5C scenario would require global emissions to fall by 5.7% per year over the next decade, it says.
This is “even more rapid” than the 5% annual drop that would have been required to meet the 1.5C limit without overshoot, had emissions cuts started in 2019, adds the report.
Every five years of delay will add 0.1C
To explore different future emission pathways and their impact on global temperatures, the report uses a simple climate model, or “emulator”, called FaIR.
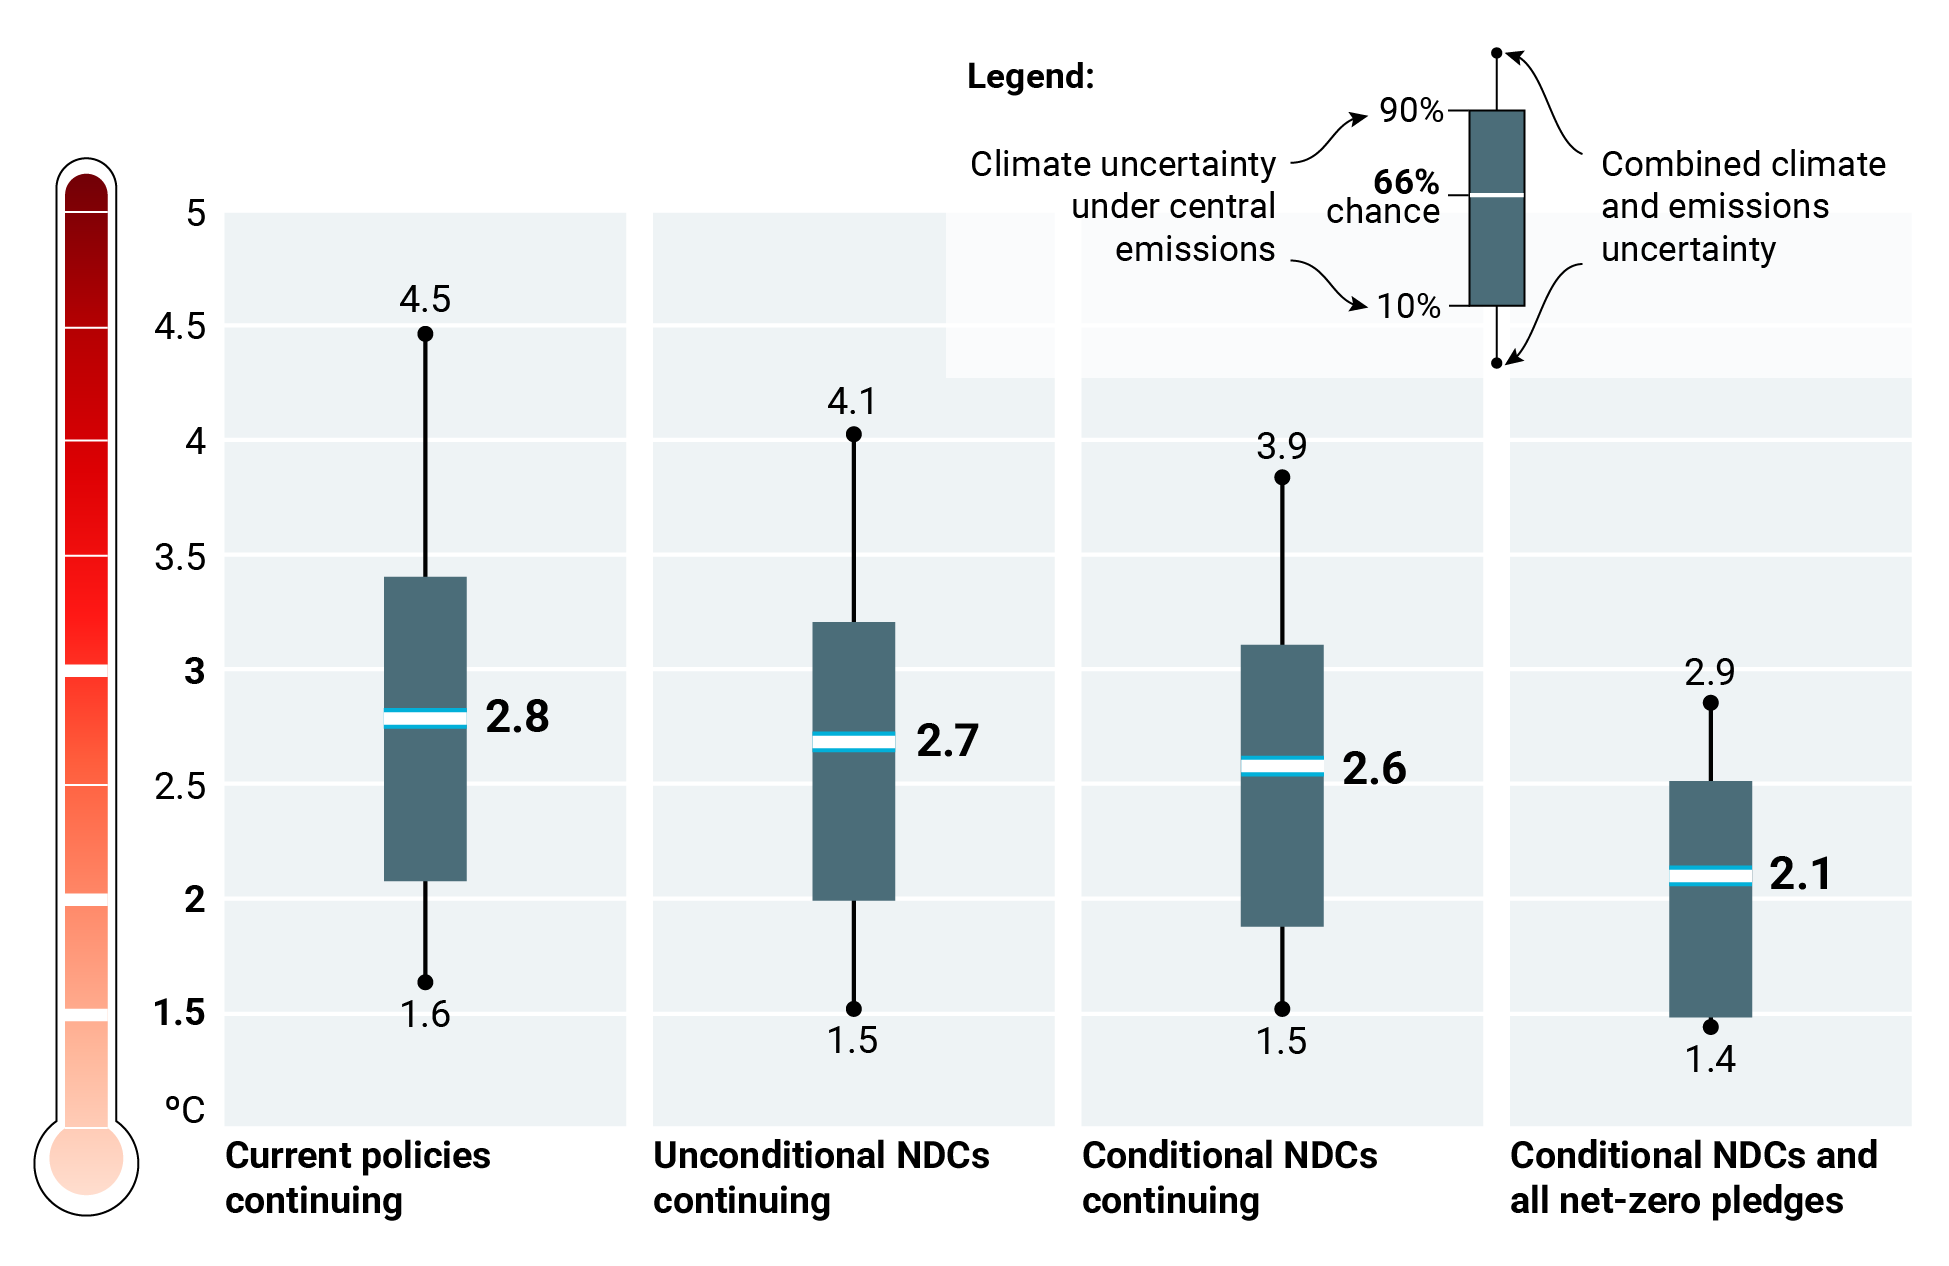
The report estimates that current national policies would cause 2.8C of global warming over the century, with a 66% chance. Under this scenario, there is also a 10% chance that warming would exceed 3.4C.
If unconditional NDCs are implemented, warming this century could reach 2.7C, with a 66% chance, it says.
If all NDCs are fully implemented, warming could reach 2.6C by 2100, with a 66% chance.
In the “most optimistic” scenario, where countries fully implement their NDCs and reach their net-zero targets, there is a 66% chance that warming could be limited to 2.1C by the end of this century.
These results are illustrated on the chart below, with boxes showing a 10-90% certainty range under a central estimate of future emissions and vertical lines showing the “combined uncertainty across greenhouse gas emissions projections and Earth-system response uncertainty”.
Compared to last year, the central warming estimates in 2100 for the NDC scenarios are about 0.2-0.3C higher, says the report.
This is because the projected global emissions as a result of the 2035 NDCs have increased. Again, this is down to the US withdrawal from the Paris Agreement and higher estimates of historical emissions.
While fully implementing all NDCs and net-zero pledges could cut warming by 0.6C, this would still be 0.25C higher than the lowest 1.5C overshoot pathways, says the report.
It adds that this “highlights the need both to close the implementation gap between current policies and existing NDCs and net-zero pledges, and to strengthen NDCs or exceed existing commitments”.
As noted above, the report continues that, “with immediate, deep, rapid and sustained emission cuts”, it would still be possible to limit peak warming to 1.7-1.8C, with a 66% chance.
If these emission cuts are “combined with an ambitious and sustainable scale-up of CO2 removal”, then warming could be returned to 1.5C by the end of the century, it continues.
However, “continued delay” in reducing global emissions would “further worsen the climate outcomes still achievable”, it says, adding:
“For every five years of delay in starting to cut emissions, around another 0.1C of warming will be locked in.
“Continued insufficient emission reductions over the next decades could make warming of 2C inevitable, putting the Paris Agreement at risk of failure.”
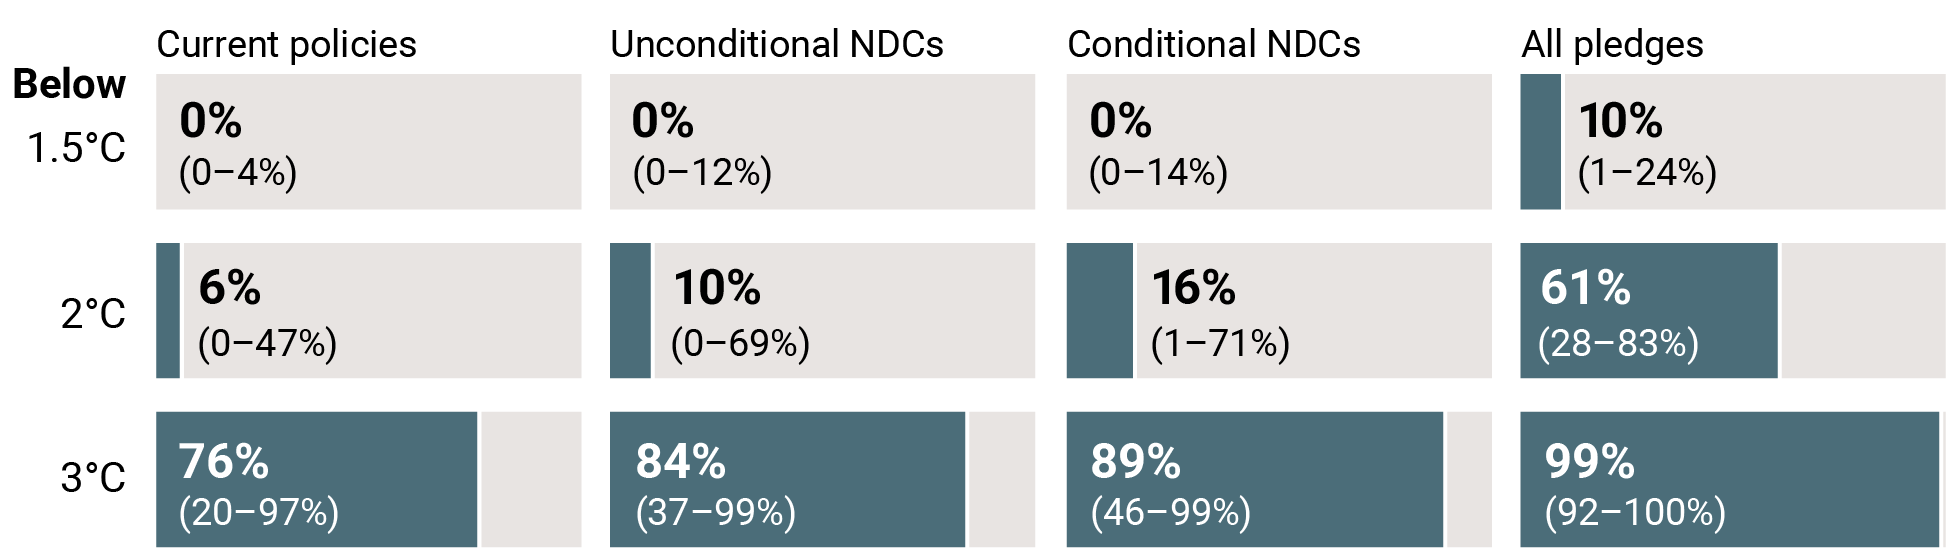
The figure below shows the likelihood of holding warming to 1.5C, 2C and 3C under scenarios over this century where countries continue with current policies, implement unconditional NDCs, all NDCs and both NDCs and net-zero pledges.
‘Uneven and insufficient’ progress towards global stocktake
The report also looks at how the world is measuring up against the mitigation actions set out in the first “global stocktake”, which was agreed at the COP28 climate summit in Dubai, in 2023.
The global stocktake is a key part of the Paris regime that assesses progress towards meeting the goals of the agreement. After each stocktake is completed, countries are supposed to increase their ambition as needed to get on track with their collective targets.
The report looks at nine “mitigation action areas” agreed in the outcome of the first global stocktake. Overall, the report says, progress in those areas is “uneven and insufficient”.
However, it does note that there are “several remarkable examples of progress that exceeded expectations”.
In particular, the deployment of renewable energy has increased substantially more than was expected by future projections made in 2015 using then-current policies, notes the report. The increase in overall renewable capacity was three times higher than expected under the previous projections. As a result, CO2 emissions related to energy generation increased by 40% less than was expected.
The chart below shows how key energy indicators have changed (black circles), compared to the 2015 projections (white circles).
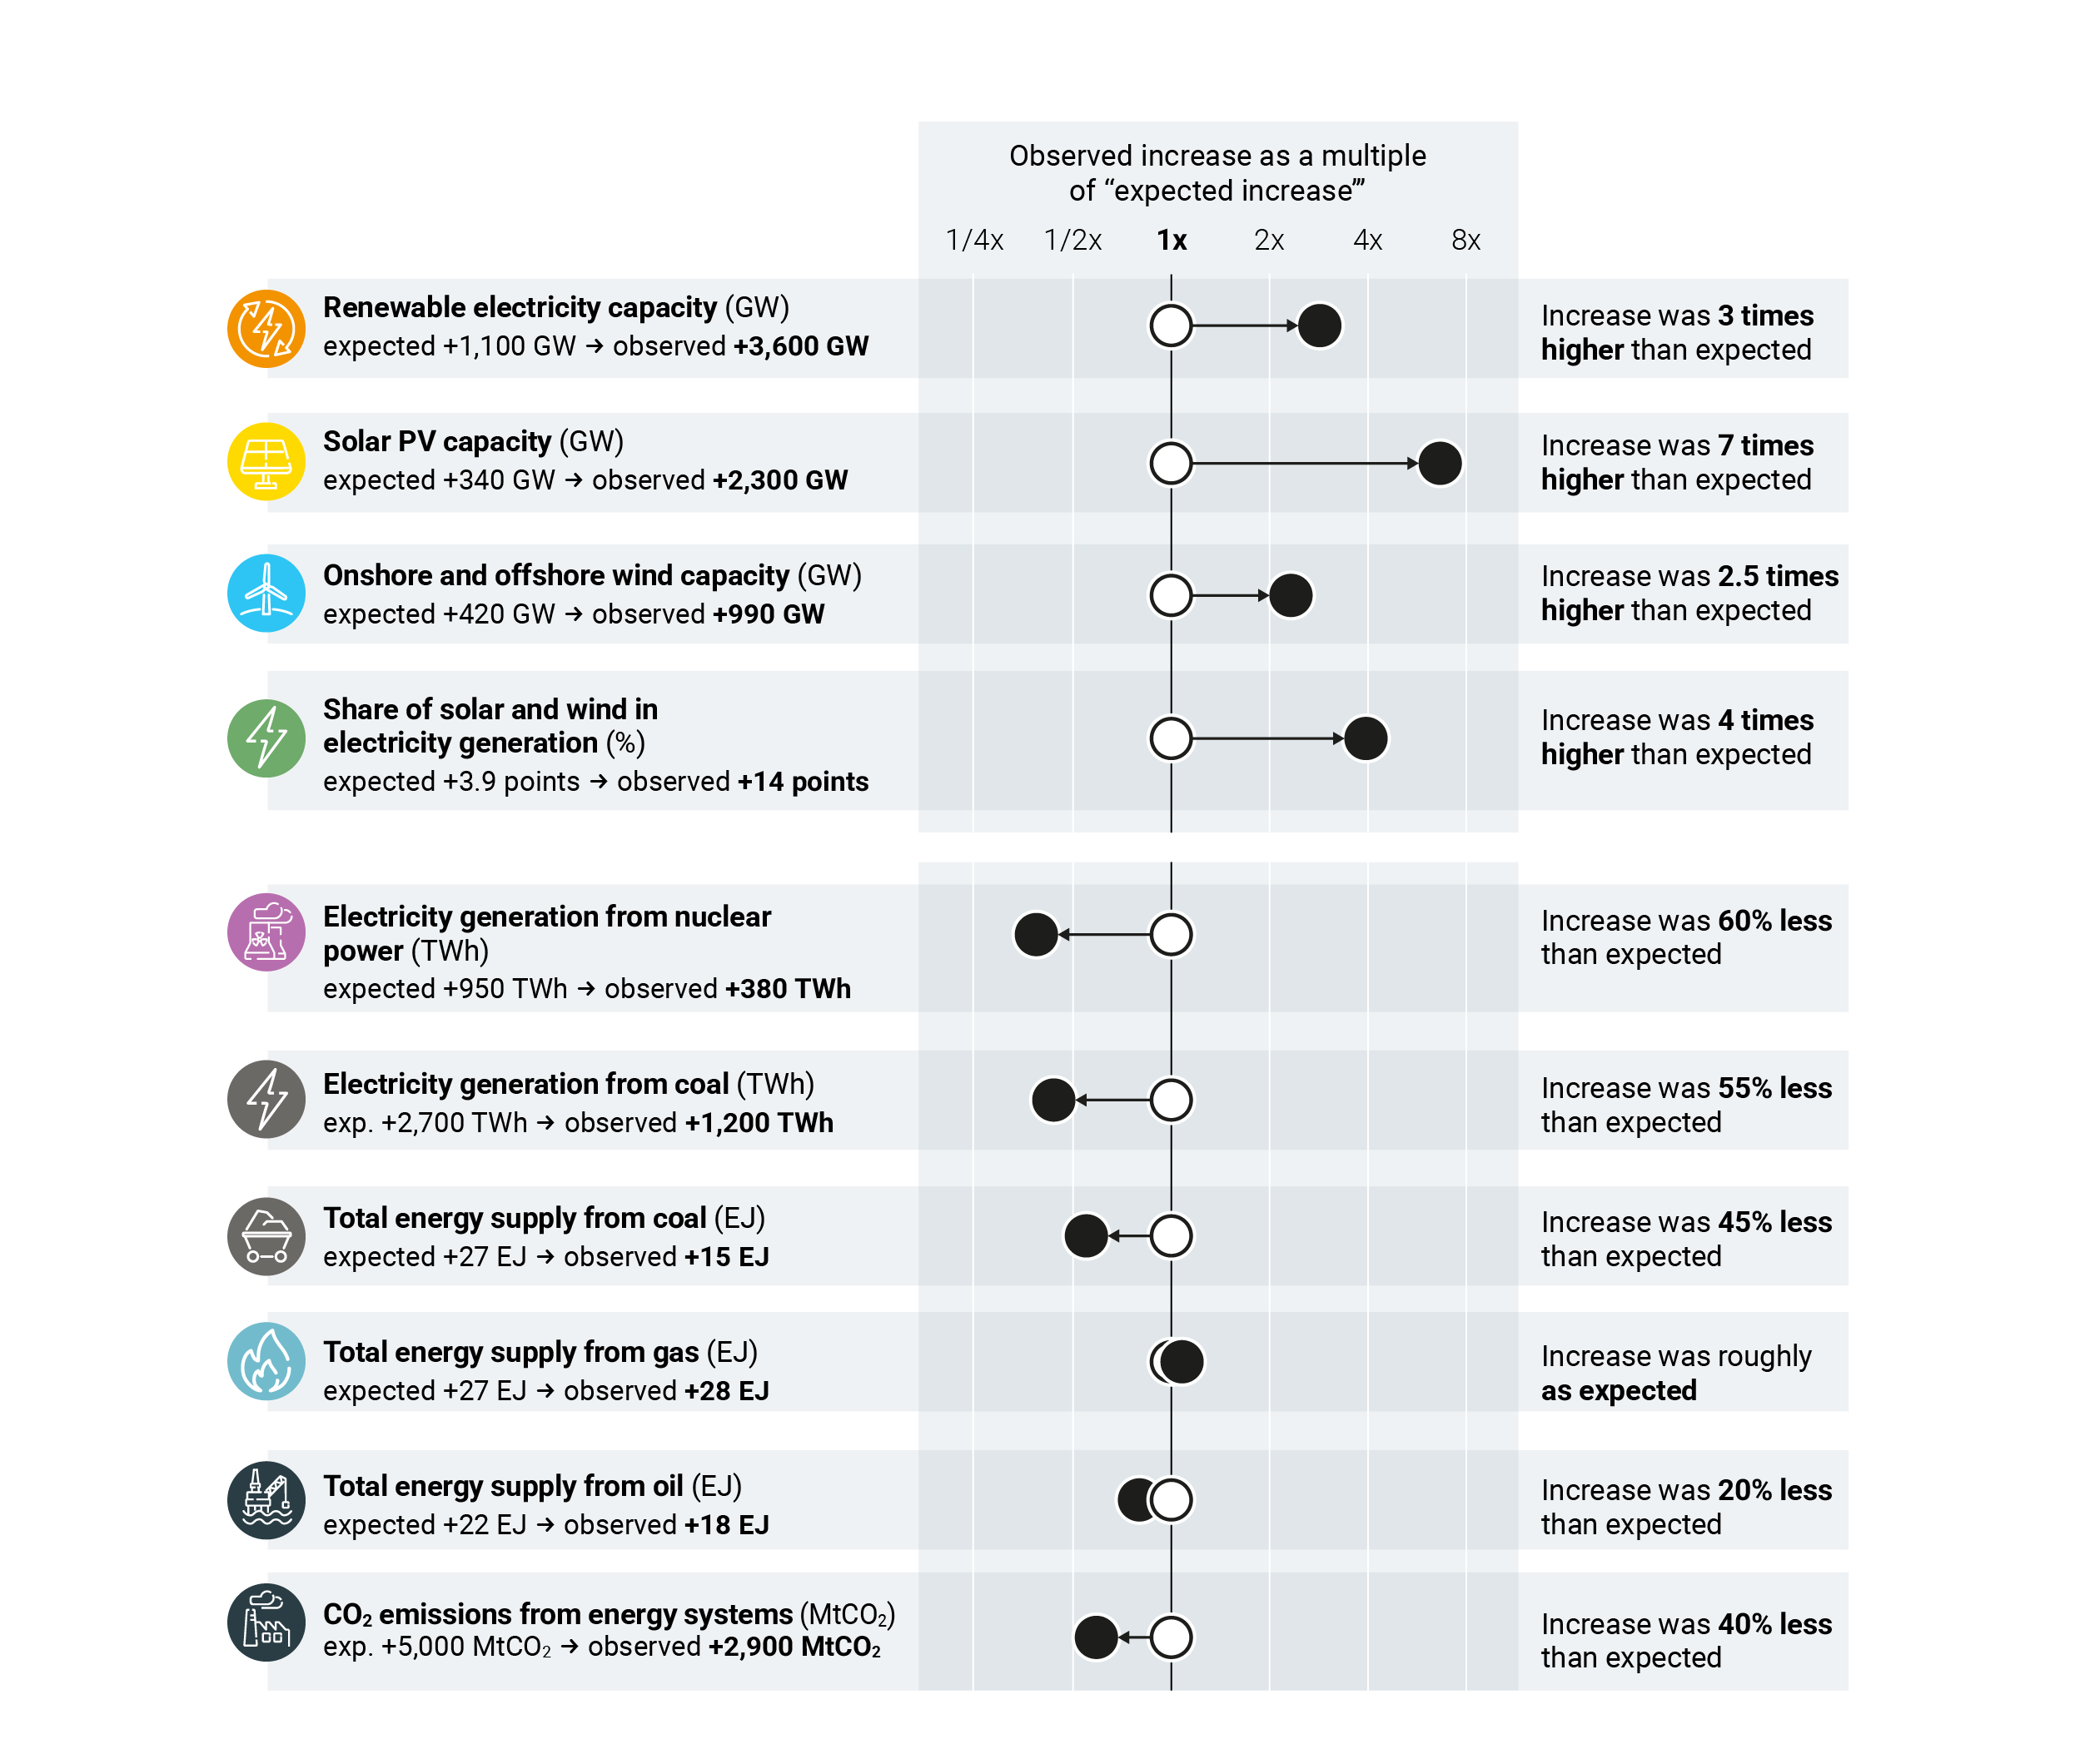
According to the report, “only renewables are on track for 2030…though continued adoption and implementation of supportive policies will be required to sustain such growth”.
The world is “lagging particularly far behind” where it needs to be to limit warming to the lowest possible overshoot of the 1.5C target in two areas: transitioning away from fossil fuels and halting deforestation, says the report. (Deforestation is the largest contributor to LULUCF emissions.)
The report notes that the amount of energy sourced from fossil fuels “continues to rise globally, albeit at a slower rate than was projected in 2015”. Under current policies, it says, global coal usage may peak by 2030, but oil and gas use is “likely to keep increasing”.
Furthermore, it says, global efforts to stop deforestation by 2030 “remain significantly off track”. Achieving the end-of-decade target would require accelerating the slowdown in forest loss by “more than a factor of 10”.
The report also includes modelling that shows what level of ambition is needed to achieve the “lowest overshoot” scenario – that which will “minimise the magnitude and duration of overshoot”. This lowest overshoot scenario results in a maximum warming of around 1.7C, with the world returning below 1.5C by 2100, report authors explained in a press briefing.