

Carbon Brief has launched a WhatsApp Channel, providing a convenient new way to stay up to date with our latest content.
How to get access:
- 1. Follow the Carbon Brief WhatsApp channel here.
- 2. Select “view channel”.
- 3. Select “follow” in the top right-hand corner.
- 4. Turn on notifications by tapping on the bell symbol in the top right-hand corner.
- 5. Alternatively, use this QR code…

Where can I find the channel once I’ve followed it?
All the channels you follow are located in the “updates” tab within WhatsApp. New posts by Carbon Brief will not appear alongside your personal chats or groups in WhatsApp. Therefore, it is important to turn on notifications for the channel if you wish to be alerted about new Carbon Brief content.
Can I reply to posts?
No. Unlike personal chats or groups in WhatsApp, you cannot respond to messages posted in our channel. However, you can forward posts to your own contacts, as well as react with emojis.
Can I unfollow the channel?
Yes. While in the channel, tap on the circle icon or three dots in the top right-hand corner of your screen and select “unfollow”.
What about my phone number?
As with any channel you choose to follow, your number is kept private and encrypted. It will not be visible to other followers. Carbon Brief also cannot see your phone number.
I don’t use WhatsApp. What do I need to do?
Download the app to your phone and then follow the instructions. There are versions for all the main systems – iPhone, Android and Windows, plus web and desktop versions. Please refer to WhatsApp’s privacy policy and Carbon Brief’s privacy policy.
The post How to follow Carbon Brief’s WhatsApp channel appeared first on Carbon Brief.

A surge in wholesale costs driven by expensive gas is responsible for nearly 90% of the rise in UK household electricity bills since 2020, reveals new analysis.
The figures, shared with Carbon Brief by thinktank Nesta, show that wholesale gas costs are also behind the vast majority (77%) of the increase in household gas bills.
The analysis firmly contradicts the idea, which has become embedded in UK media and political narratives, that the UK’s net-zero target is to blame for high energy bills.
Andrew Sissons, director for sustainable future at Nesta, tells Carbon Brief that net-zero is, in fact, “helping to shelter Britain from the impact of expensive gas”. He adds:
“Rising gas prices, not net-zero, have driven most of the recent surge in Britain’s energy bills. Britain is particularly exposed, with over 80% of households connected to gas mains, while our electricity system still relies too much on gas as the marginal unit.”
The analysis comes after the UK government gave its approval for the Jackdaw gas field to be developed in the North Sea, despite stating that it “would not…affect prices”.
Another gas crisis
In January 2026, Carbon Brief reported that two-thirds of the rise in electricity bills since before the 2022 global energy crisis was due to high gas prices.
Now, amid ongoing conflict in the Middle East, wholesale gas prices are at their highest levels since Russia’s 2022 invasion of Ukraine.
Indeed, as of 19 October, UK wholesale gas prices stood at 220p per therm (£75 per megawatt hour, MWh), above the average for 2022 of 210p/therm (£72/MWh).
The figure below shows that, after accounting for inflation, typical UK annual household electricity bills had risen £180 by the fourth quarter of 2026, relative to the same period in 2020.
Some 90% of this increase (£161) is due to wholesale costs, driven by the price of gas.
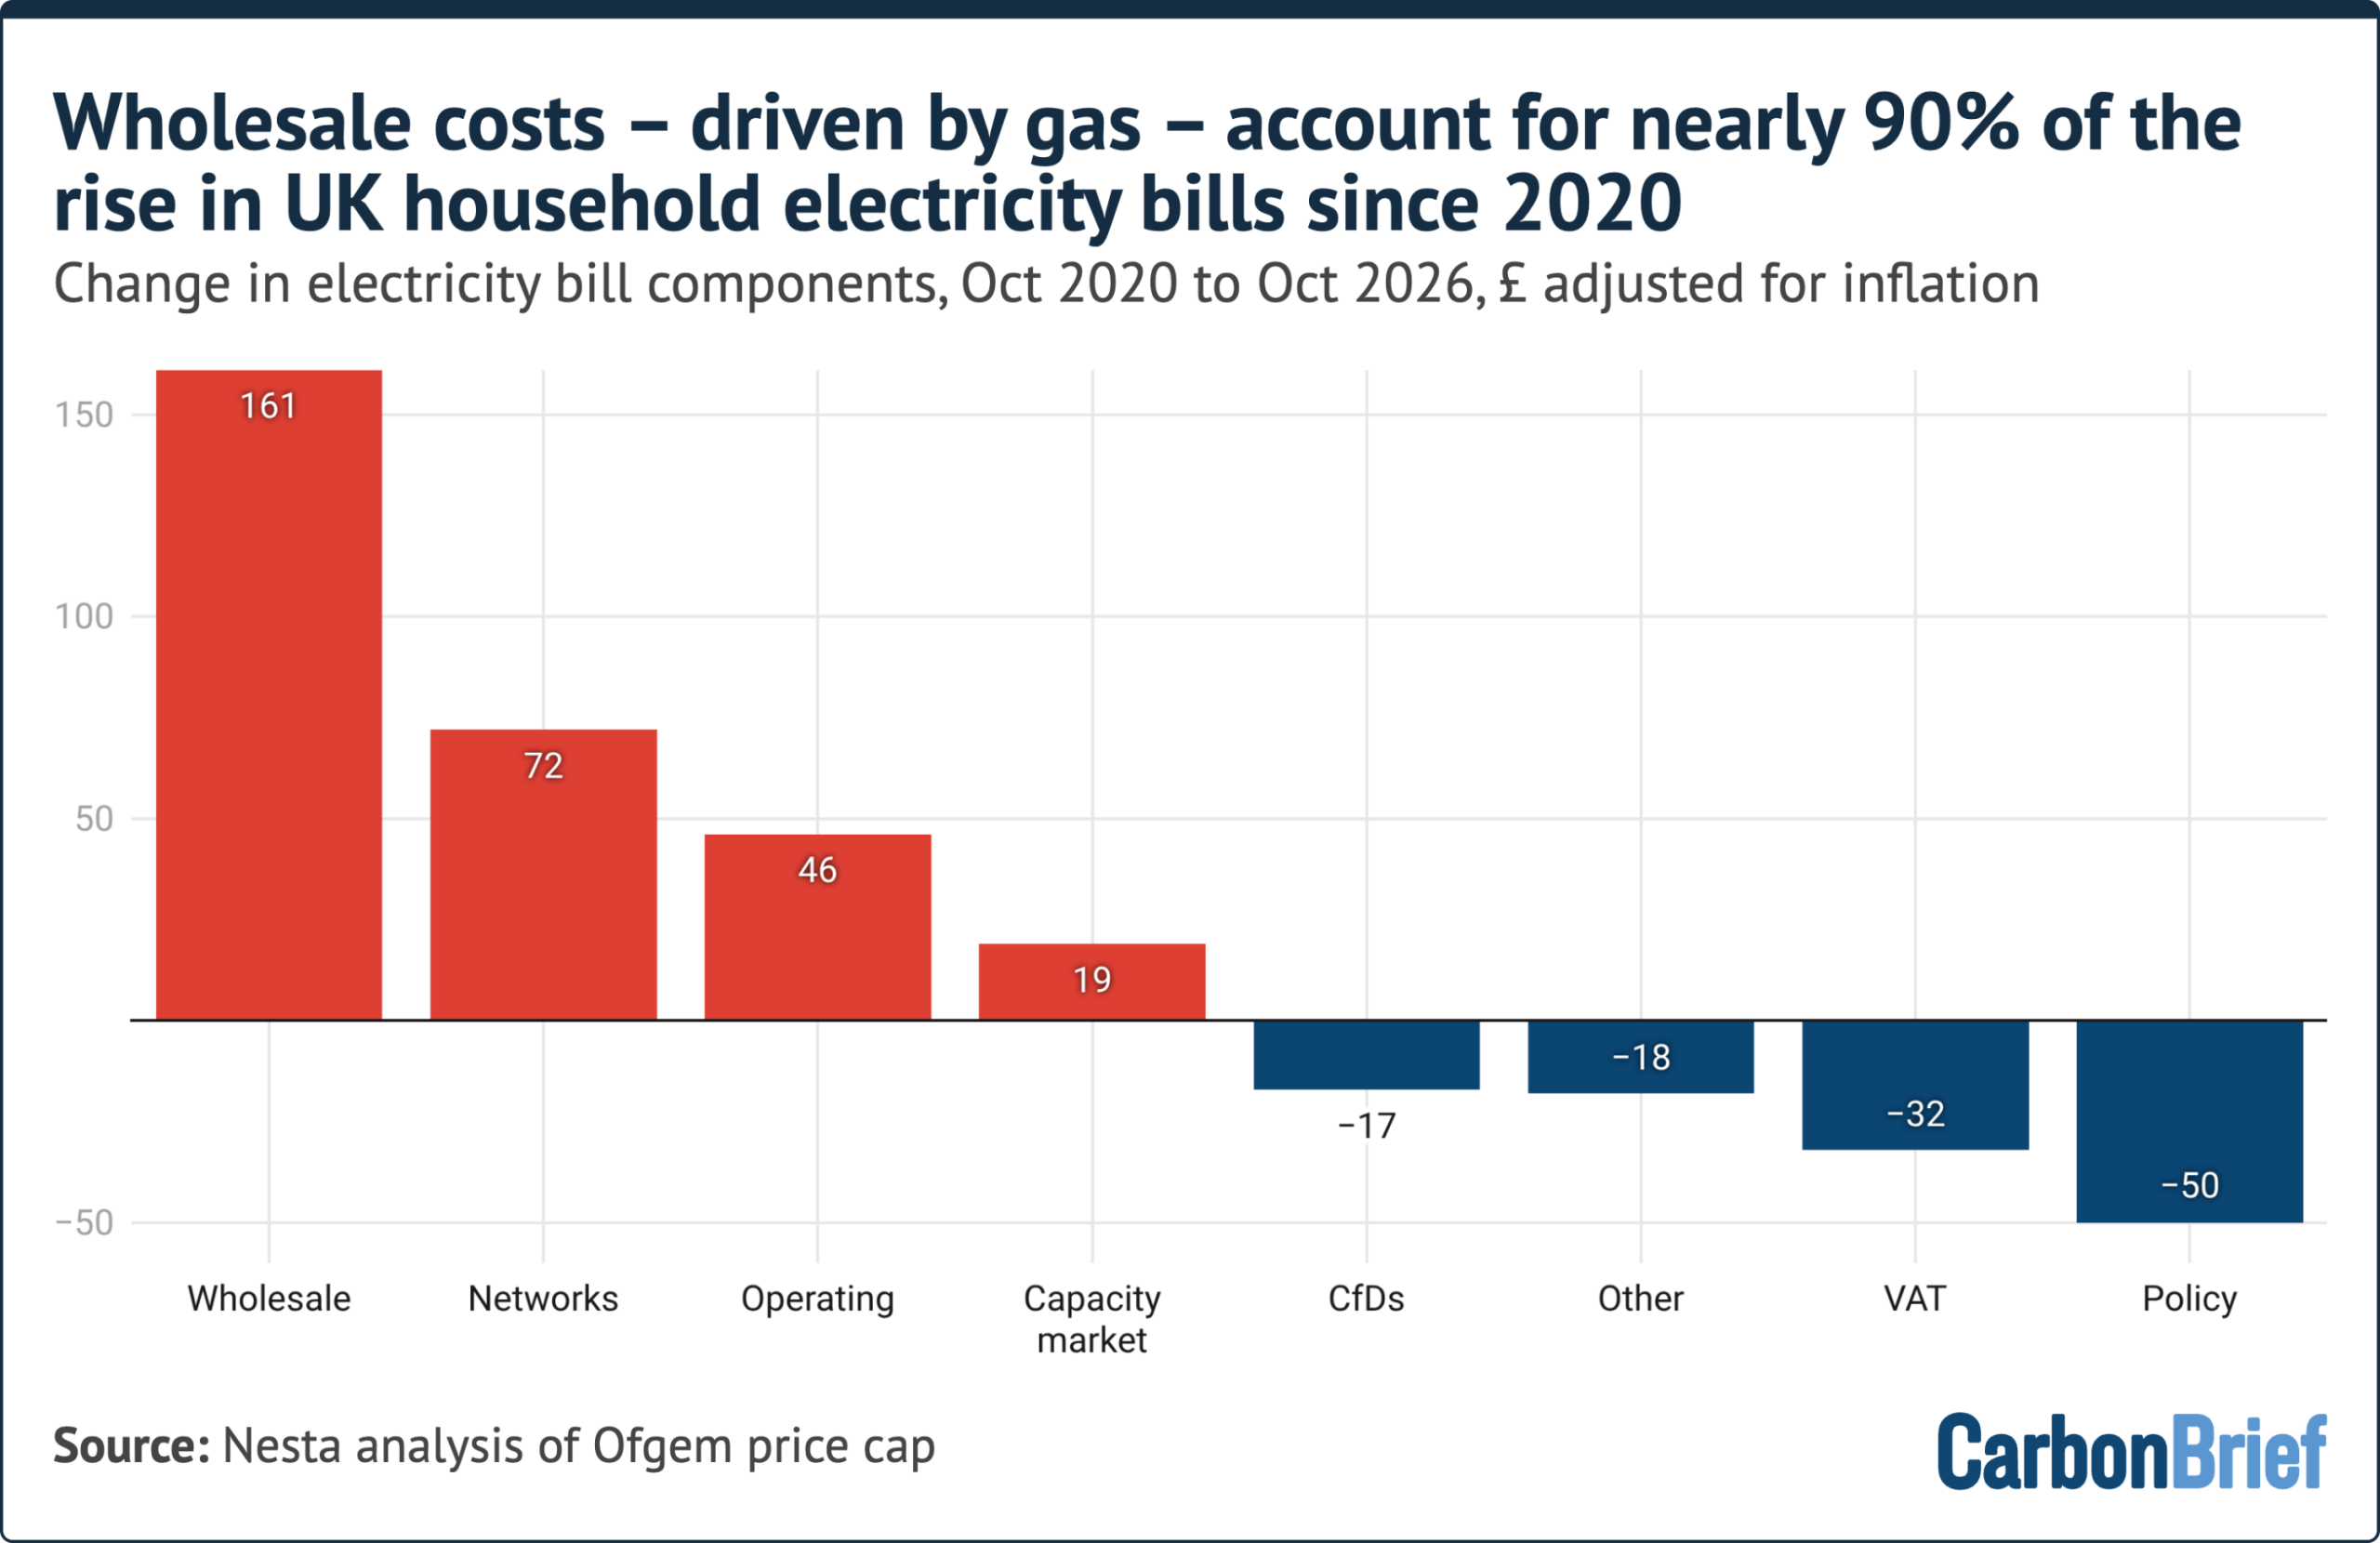
In contrast – and contrary to widespread perceptions – renewable “contracts for difference” (CfDs) are reducing electricity bills by £17 under the current price cap, according to the Nesta analysis.
In addition, the government has cut policy costs for electricity by moving 75% of legacy renewable support onto general taxation, ending the “ECO” efficiency scheme and temporarily removing VAT.
Network costs have added £72 to typical bills since 2020, according to Nesta. Most of this (£46) is for investment in the electricity transmission network, known as the “motorways” of the grid.
Only £21 of the rise in network costs relates to balancing the system, including “constraint payments” for turning off windfarms – and turning on gas plants – due to insufficient grid capacity.
Wind constraint payments regularly receive extensive news coverage, despite balancing costs – in total – making up just £35 (4%) of a typical £858 annual household electricity bill.
The Nesta figures show energy supplier operating costs have gone up by £46 since 2020. These costs are not broken down in the underlying Ofgem figures, but the increase is thought to be driven by the cost of rising household energy debt. Supplier profits are capped at 2.5% of bills.
Breaking the link
Notably, household electricity prices have increased far less rapidly since the Hormuz crisis than gas bills, with higher clean-energy generation helping break the link between the two.
Since 2020, household gas bills have increased by £368 in real terms, according to Nesta’s analysis. Some 77% of this (£283) is due to wholesale gas costs.
After accounting for inflation, total dual-fuel bills for a typical household have increased from £1,175 per year in October 2020 to £1,723 per year in October 2026, a rise of 47%.
The rise in wholesale costs driven by high gas prices accounts for £444 (81%) of this increase in real terms, as shown in the figure below.
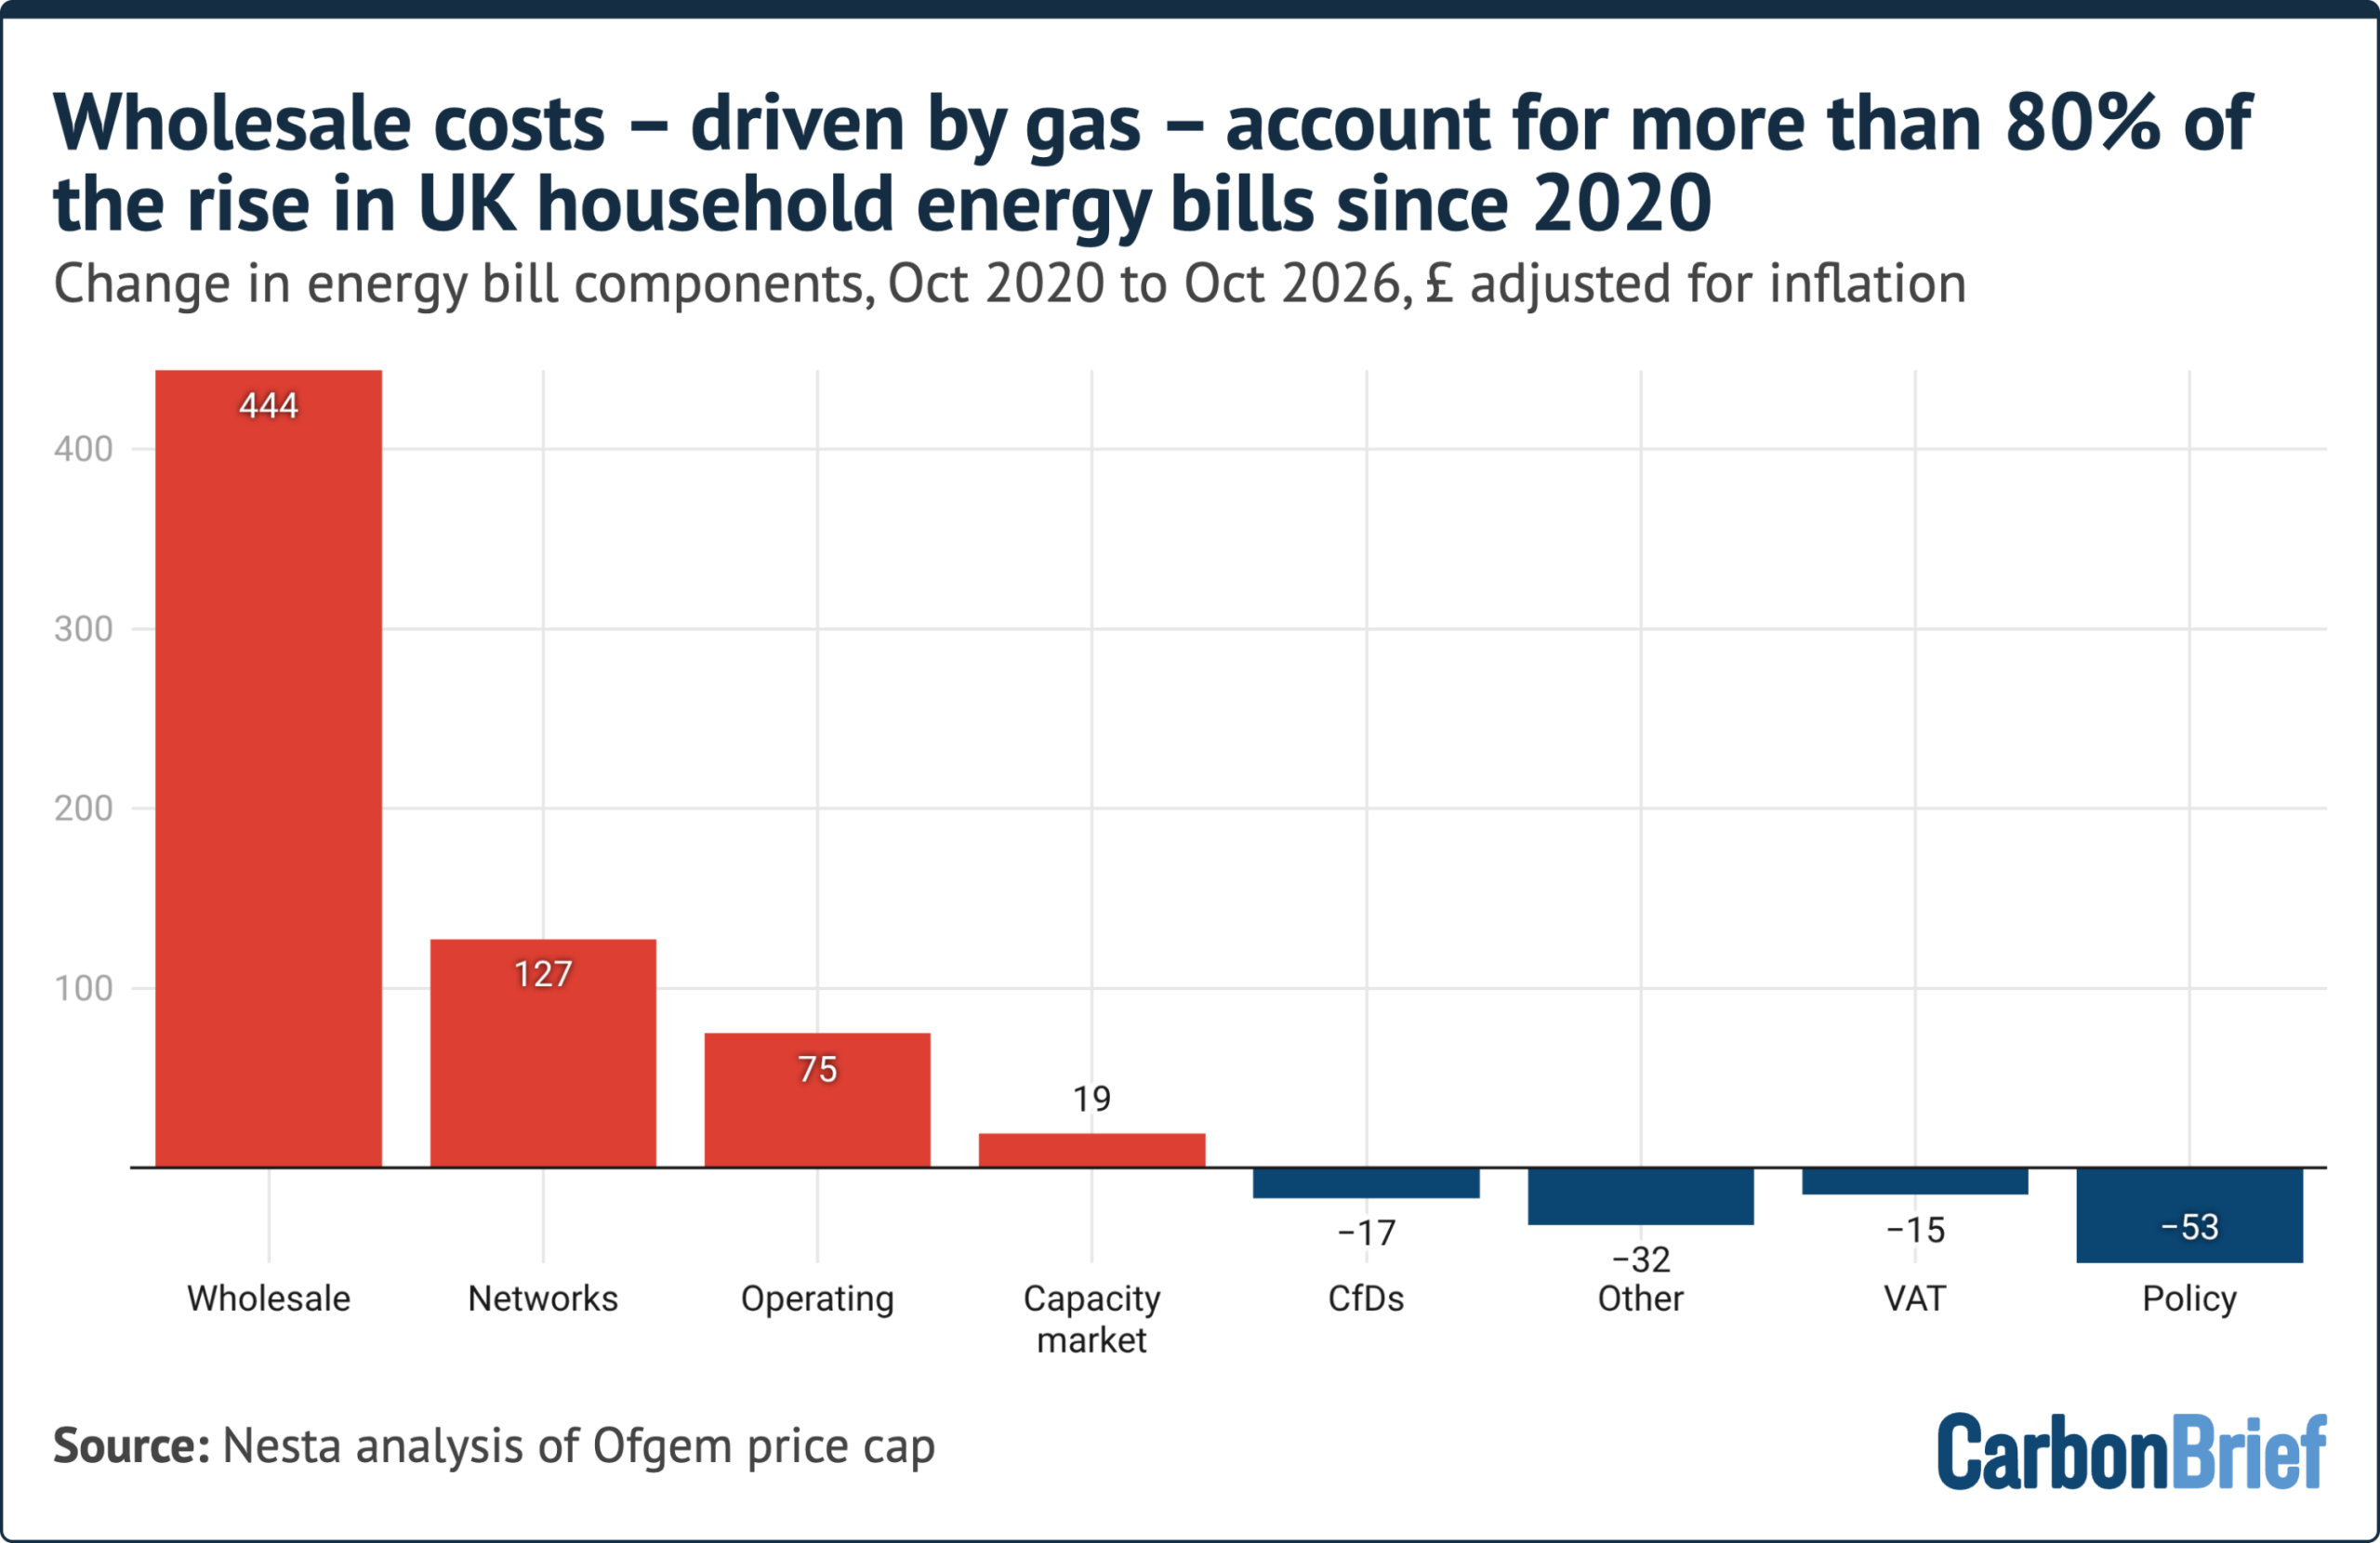
The £127 real-terms rise in network costs includes £72 for electricity transmission, distribution and balancing, as well as £55 for investment in the gas grid.
(According to the Energy Networks Association, up to 80% of the investment in electricity grids is required to maintain existing assets, with the remainder going towards expansion for net-zero.)
In total, the cost of government social and climate policies made up £183 (16%) of typical dual-fuel bills in October 2020. This had fallen to £114 (7%) as of the current October 2026 price cap.
Wholesale costs make up the largest share of the current cap, at £757 (44%). Network costs are the second-largest component of bills, at £417 (24%), followed by operating costs at £291 (17%).
Sissons tells Carbon Brief:
“Upgrading the grid is not cost-neutral, but that price tag is dwarfed by the impact of rising gas prices. In fact, net-zero is helping to shelter Britain from the impact of expensive gas. Since the start of the Iran war, electricity bills have begun to decouple from gas bills, thanks to the UK’s increased renewable power and support from contracts for difference.”
“Going further will require British households to have clean electricity, electric vehicles and heat pumps over fossil-fuel cars and boilers. By focusing on growing electricity demand, the government can spread upgrade costs more widely. This can lock in the consistent investment in electrification that is Britain’s best path to stop global turmoil showing up on winter energy bills.”
Related

Factcheck: UK Conservatives double the ‘cost of net-zero’ after spreadsheet blunder
Analysis: Wind and solar save UK from gas imports worth £5.9bn during Hormuz crisis
Analysis: EVs are now nine times cheaper than petrol or diesel to drive in the UK

CCC: Heathrow expansion could push flights to ‘80% of UK emissions by 2050’
The post Revealed: Expensive gas behind ‘nearly 90%’ of rise in UK electricity bills appeared first on Carbon Brief.
Revealed: Expensive gas behind ‘nearly 90%’ of rise in UK electricity bills
A temporary breach of the 1.5C global-warming limit is now “inevitable” following “decades of insufficient climate action”, says the UN Environment Programme (UNEP).
In its “sobering” annual assessment of the global “emissions gap”, UNEP says that exceeding the Paris Agreement’s 1.5C limit is “imminent and unavoidable”.
This year’s report, titled “The point of return”, says the “task now” is to minimise the size and scale of a temperature “overshoot” and to “establish a credible return path to 1.5C by the end of the century”.
Even the “lowest possible” overshoot scenario for 1.5C would first see global warming peak at around 1.7-1.8C in the middle of the century before declining, says the report.
This scenario – which is “still aligned with the long-term temperature goal of the Paris Agreement” – would require global emissions cuts of 18% by 2030 and 45% by 2035, while ramping up “removals” of carbon dioxide (CO2) from the atmosphere, says UNEP.
In contrast, it notes that the current climate pledges by countries around the world – even if fully implemented – would only reduce emissions by 5-8% by 2030 and 11-15 % by 2035, relative to 2025 levels.
Nonetheless, the report identifies “ample opportunity to accelerate action”, concluding that “countries can still limit peak warming, shorten the duration of overshoot and keep the goals of the Paris Agreement within reach”.
(See Carbon Brief’s detailed coverage of previous reports in 2014, 2015, 2016, 2017, 2018, 2019, 2020, 2021, 2022, 2023, 2024 and 2025.)
Emissions ‘comparable’ between 2024 and 2025
The report says that emissions in 2025 were “comparable” to those of 2024.
Global greenhouse gas emissions in 2025 totalled 58.4bn tonnes of CO2 equivalent (GtCO2e), according to the report. This is around 0.16GtCO2e lower than 2024 levels – albeit, with high levels of uncertainty around the numbers.
In addition, because the figures presented in the 2025 report are “provisional”, the report says, it is “not possible to conclude on the overall direction of emissions in 2025”.
The emissions growth rate has been slowing down in recent decades: the growth rate over 1990-2015 was, on average, 1.7% per year, while emissions have increased by an average of 0.8% per year since 2016.
The chart below shows the total human-driven emissions between 1990 and 2025, separated by greenhouse gas: CO2 from fossil-fuel combustion (dark grey), methane (light grey), nitrous oxide (blue), fluorinated gases (orange) and CO2 from land-use change (green).
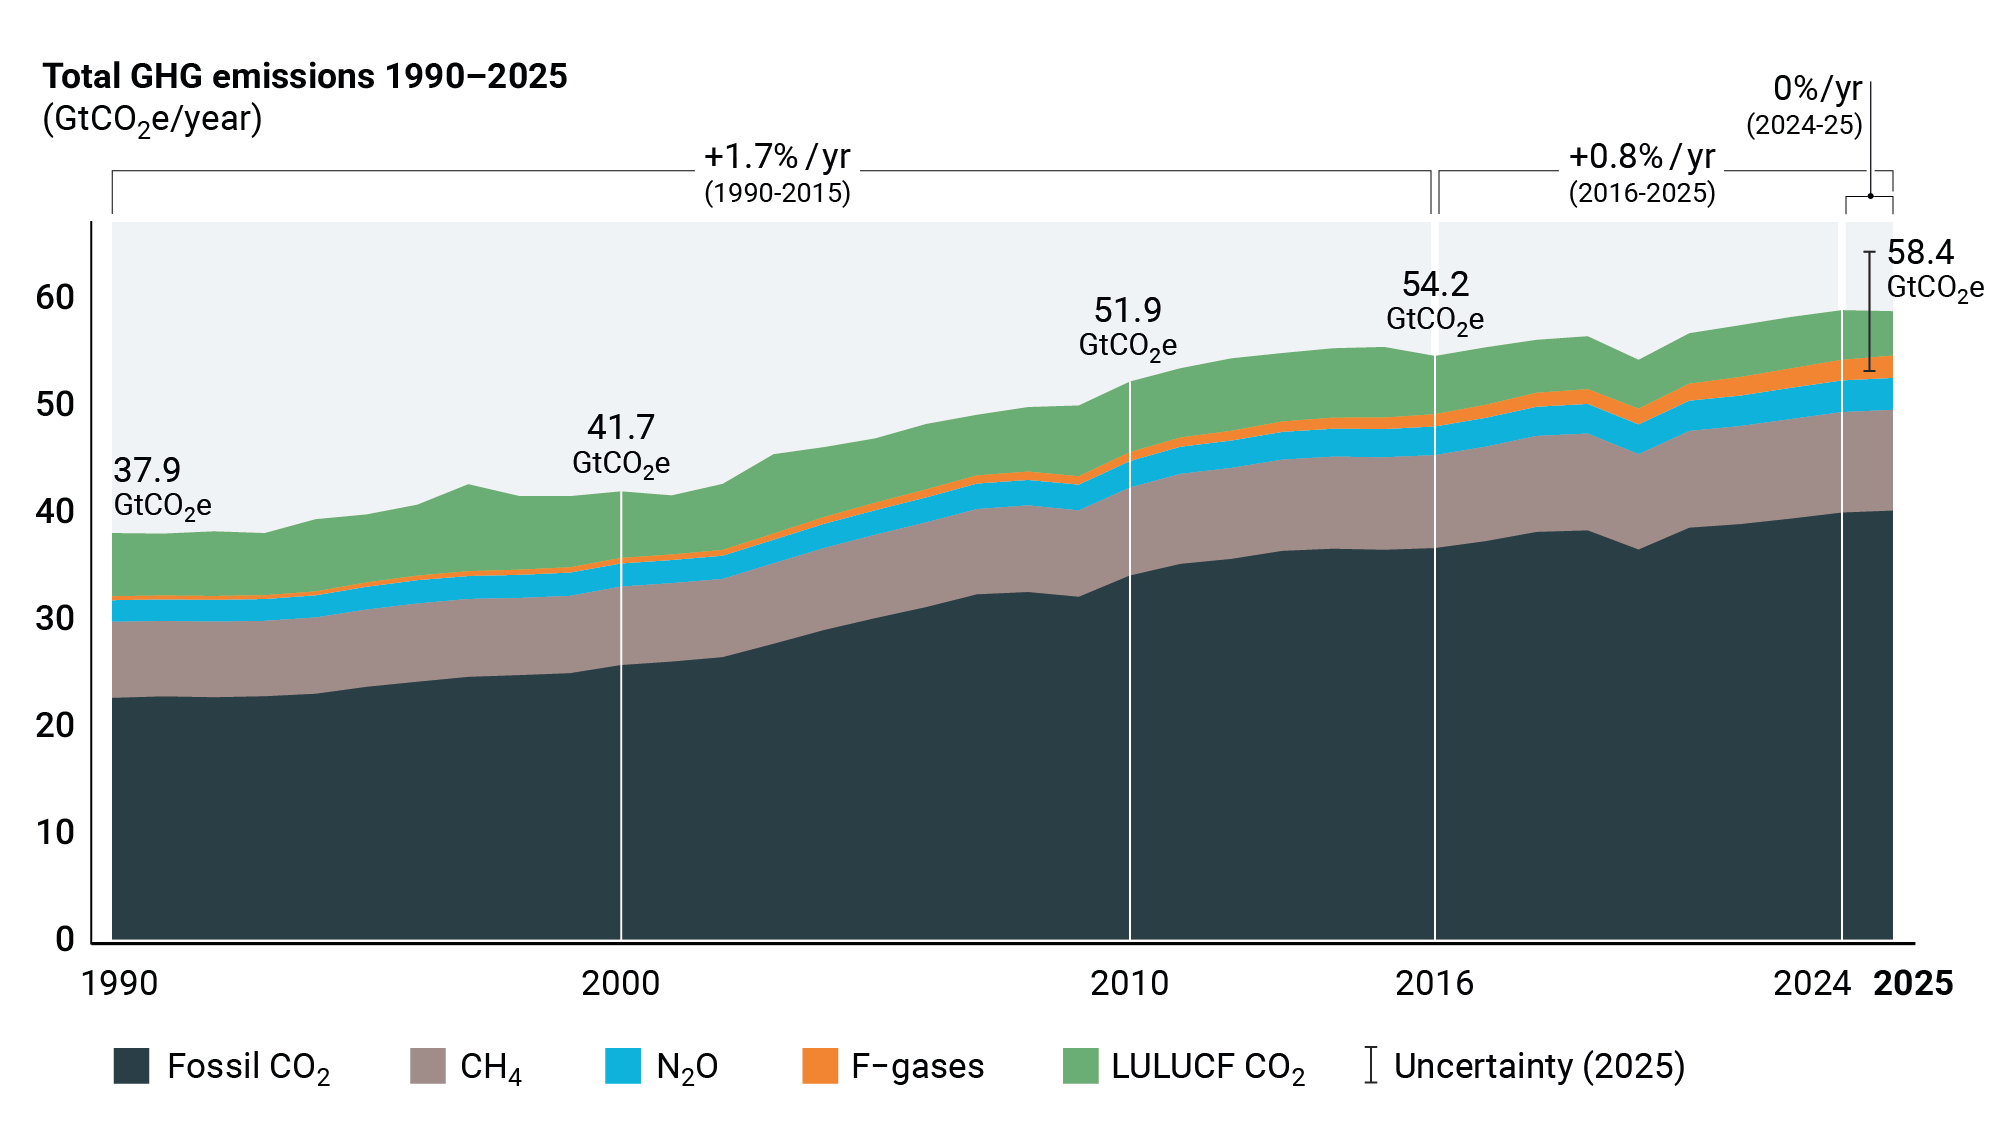
Compared to 2024, emissions from fossil fuels increased slightly, by between 0.4-1.1%, says the report. Emissions of both nitrous oxide and fluorinated gases increased by even higher rates, but since these comprise such a small part of total greenhouse gas emissions, “their contribution to the overall trend is relatively less significant”, it adds. Methane emissions remained steady over that time.
A reduction in the CO2 emissions from land use, land-use change and forestry (LULUCF) “slightly overcompensates” for the rise in emissions of fossil-fuel CO2 and other gases, according to the report. (For more on falling land-use emissions, see Carbon Brief’s explainer.)
The decrease in LULUCF emissions was “partially driven” by a decline in global wildfire emissions, particularly in Africa, South America and parts of south-east Asia. The report notes that these decreases were “likely connected to the ceasing of El Niño conditions”. The ongoing “super” El Niño is likely to cause LULUCF emissions to increase in 2026.
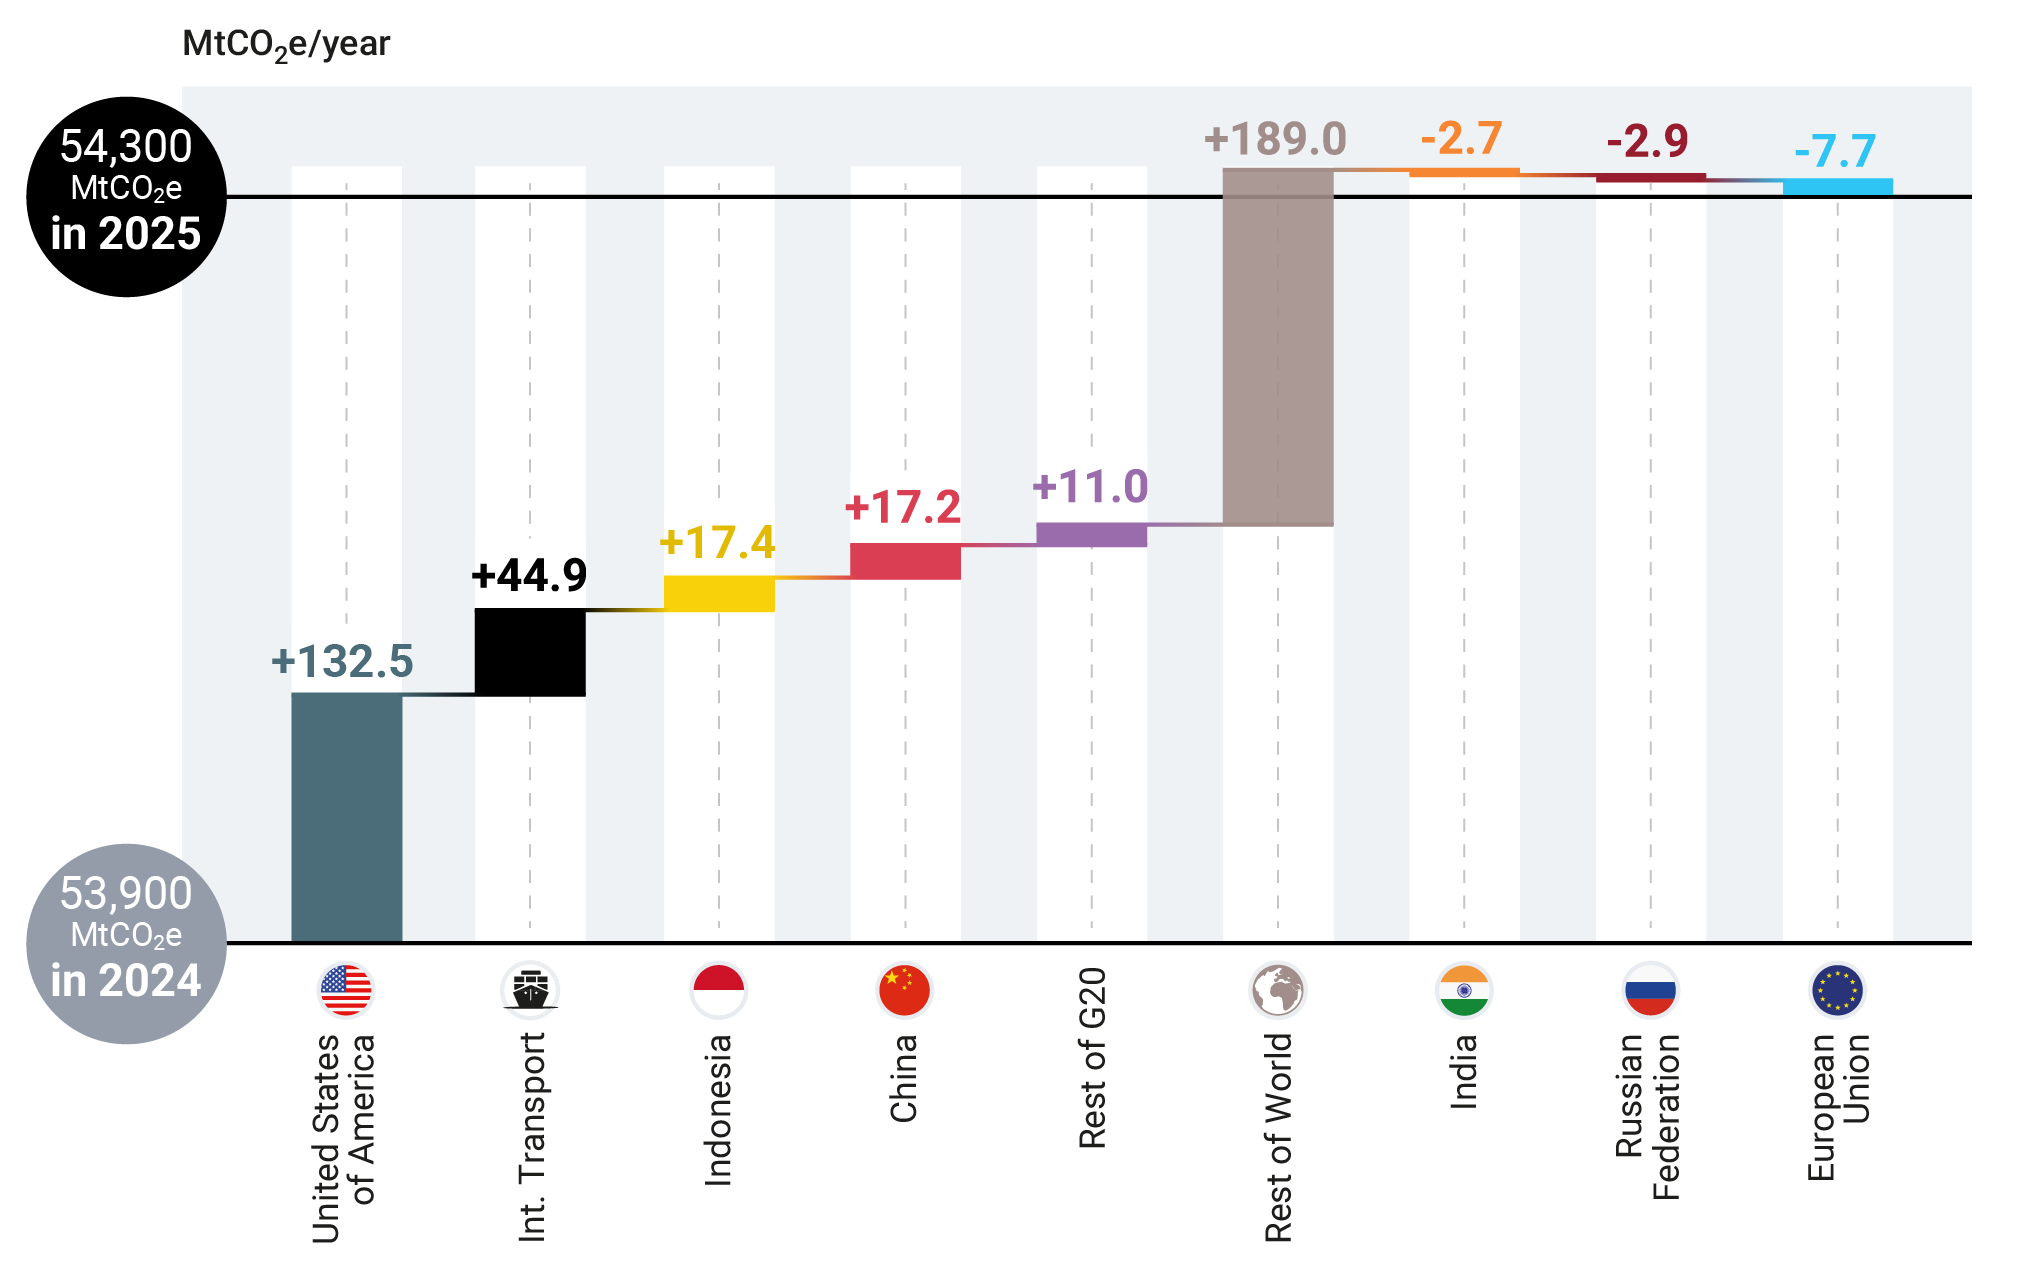
The report also examines countries’ contributions to the increase in greenhouse gas emissions – although here, it excludes LULUCF due to a lag in national-level emissions inventories for the sector.
Among the top six emitters, only the US saw a notable increase in 2025, says the report, whereas emissions in China, the EU, India, Russia and Indonesia were relatively flat. Emissions in the US grew by 133m tonnes of CO2e (MtCO2e) in 2025, due to increased electricity demand and a “rebound” of coal power. This growth in US emissions is likely due to a combination of market factors, including increased heating demand due to a colder winter, higher gas prices and overall increased electricity demand.
The changes for the six largest emitters, the rest of the G20 countries, international transport and the rest of the world can be seen in the chart below.
Across most sectors, progress towards decarbonisation has been “modest”, says the report. The most notable decreases have occurred in the power sector and the transport sector, due to the growth of solar power and electric vehicles. The report notes:
“There are emerging signs of transport sector electrification and decarbonisation, but at rates and levels that are not yet sufficient to drive emissions reductions at the global level.”
However, emissions from the transport sector have continued to grow, due to increased demand for international aviation and shipping.
The report notes that while electricity demand from data centres is “projected to double” by 2030, data centres at present account for less than 1% of total emissions.
New NDCs would reduce emissions ‘far from what is needed’
All countries were meant to submit new UN climate pledges for 2035, known as the third nationally determined contributions (NDCs) to the Paris Agreement, by February 2025. However, 95% of nations missed this deadline.
Many countries came forward with their third NDCs at a UN climate summit in New York in September 2025 and at the COP30 climate summit in Brazil in November 2025.
By the end of COP30, 122 – or 63% – of countries had produced their third NDCs.
The report says that figure had risen to 124 by 1 September 2026, with pledges now covering 75% of global emissions.
This is more than double the number of third NDCs available at the time of the 2025 emissions gap report – allowing a “more robust basis for assessing collective progress and ambition toward 2035”, says the report.
Although the first global stocktake of action towards the goals of the Paris Agreement called for countries to submit targets “covering all greenhouse gases”, there has only been a “modest” increase in the number of nations to do so, according to the report.
It says that eight countries included greenhouse gas targets for the first time in their third NDCs, bringing the total number parties with such targets up to 155.
The third NDCs “increasingly use more robust and verifiable target formulations”, such as standardised baselines, says the report.
However, they have not “meaningfully broadened the scope of sectors and gases covered by the targets”, it adds.
If the third NDCs were implemented in full, it would lower global emissions in 2035 by 3.5GtCO2e, compared to 2030 targets, says the report.
It says this is “far from the global reductions needed to get on track to achieving the long-term temperature goal of the Paris Agreement”.
Compared to the 2025 report, the projections for global emissions in 2035 as a result the third NDCs are about 3GtCO2e higher.
This is down to the formal withdrawal of the US from the Paris Agreement, as well as from “harmonising” the projections with the latest historical emissions data, says the rep