

Many right-leaning figures have tried to push the idea that the UK is an outlier on net-zero.
Conservative leader Kemi Badenoch has claimed that other countries are “not following us” in aiming to cut emissions to net-zero, while GB News owner Paul Marshall said in March that the UK is “pursuing a path of unilateral economic disarmament”.
Both are among those on the right of UK politics who have falsely claimed that the UK’s net-zero target is “unilateral” and that this is a reason why the goal should be abandoned.
However, these claims ignore that 140 of the world’s 198 countries (71%) have net-zero targets.
In fact, Iran and the US are the only two of the world’s top 20 carbon dioxide (CO2) emitters that lack a net-zero target, as shown in the map below.
If the UK were to scrap its net-zero target, as called for by both the opposition Conservatives and hard-right Reform UK, this is the group of major emitters it would be joining.

The latest assessment report from the Intergovernmental Panel on Climate Change (IPCC), the world’s foremost authority on climate science, said the only way to stop global warming was to reach net-zero CO2 emissions.
The UK was the first major economy to set a net-zero target in 2019.
Since then, almost all of the world’s major emitters have followed suit, with China announcing a net-zero target in 2020 and India, Saudi Arabia and Russia launching goals in 2021.
Around 74% of global emissions are now covered by some kind of national net-zero target, according to data from the Net Zero Tracker, a consortium tracking net-zero policies.
According to the Net Zero Tracker, 34 nations – including the UK – have set a net-zero target into law, signifying the highest possible level of commitment.
In addition, 63 nations have stated their goal in a policy document, 16 nations have made a net-zero “pledge” and 23 nations have a net-zero “proposal”. (Four nations have declared that they have already reached net-zero.)

The US, the world’s largest historical emitter when counting its cumulative climate impact since the start of the industrial revolution, had a net-zero target under former president Joe Biden. However, it was abandoned by the current Trump administration.
Despite this, some 18 regions and 43 cities in the US still have some form of net-zero commitment, according to the Net Zero Tracker.
John Lang, lead of the Net Zero Tracker, tells Carbon Brief:
“Ironically, of the world’s 20 largest emitters, only the US and Iran lack net-zero targets – precisely as the Iran crisis exposes the risks of dependence on fossil fuels and volatile oil markets.
“Arguing against net-zero is arguing for greater exposure to geopolitical instability and energy price shocks. The UK has already shown that cutting fossil-fuel dependence can go hand in hand with economic growth, reducing emissions by 54% since 1990 while almost doubling the size of the economy.”


The post Factcheck: US and Iran are world’s only major emitters without net-zero targets appeared first on Carbon Brief.
Factcheck: US and Iran are world’s only major emitters without net-zero targets

Energy bills in the UK have continued to soar in 2026, with intense debate raging about how to bring them down.
In October 2026, the cap on household energy bills reached its highest level in three years, rising by £60 amid high gas prices driven by the Iran war.
The cap is forecast to jump by as much as another quarter in January 2027, pushing annual energy bills towards £2,200.
Energy bills have not been that high since 2022 when, in the fallout of the Russian invasion of Ukraine, the UK government spent more than £60bn on supporting consumers through the crisis.
While expensive gas is behind the lion’s share of the rise in bills since 2020, policy costs and investment in the gas and electricity grids are also putting some pressure on prices.
This has sparked conflicting calls to continue the clean-energy transition to get off the “fossil-fuel rollercoaster”, to move more slowly – or to abandon climate goals in favour of more gas.
Below, Carbon Brief looks at the real drivers of high energy bills in the UK, what has been done to address them to date and what options are available to cut them going forward.
These include taking more policy costs off electricity bills, boosting flexibility or shifting to more efficient technologies with lower running costs, such as heat pumps and electric vehicles (EVs).
What is driving high energy bills?
In October 2026, UK household energy bills reached their highest levels since 2022, with the price cap for typical homes hitting £1,723 per year, up 47% in real terms since October 2020.
Industrial energy users also face high costs, particularly for their electricity.
For households, another sharp increase is now all but guaranteed under the price cap for January 2027, which is forecast to rise by around 25% from current levels.
Wholesale costs for electricity and gas make up 44% of the current cap of £1,723 per year, according to Carbon Brief analysis of figures from thinktank Nesta, shown in the figure below.
The wholesale cost of both electricity and gas is tied to gas prices, due to the marginal pricing system used in power markets in the UK and most other countries.
Network charges make up a further 24% of bills and operating costs are another 17%, whereas policy costs only account for 7% of the total.
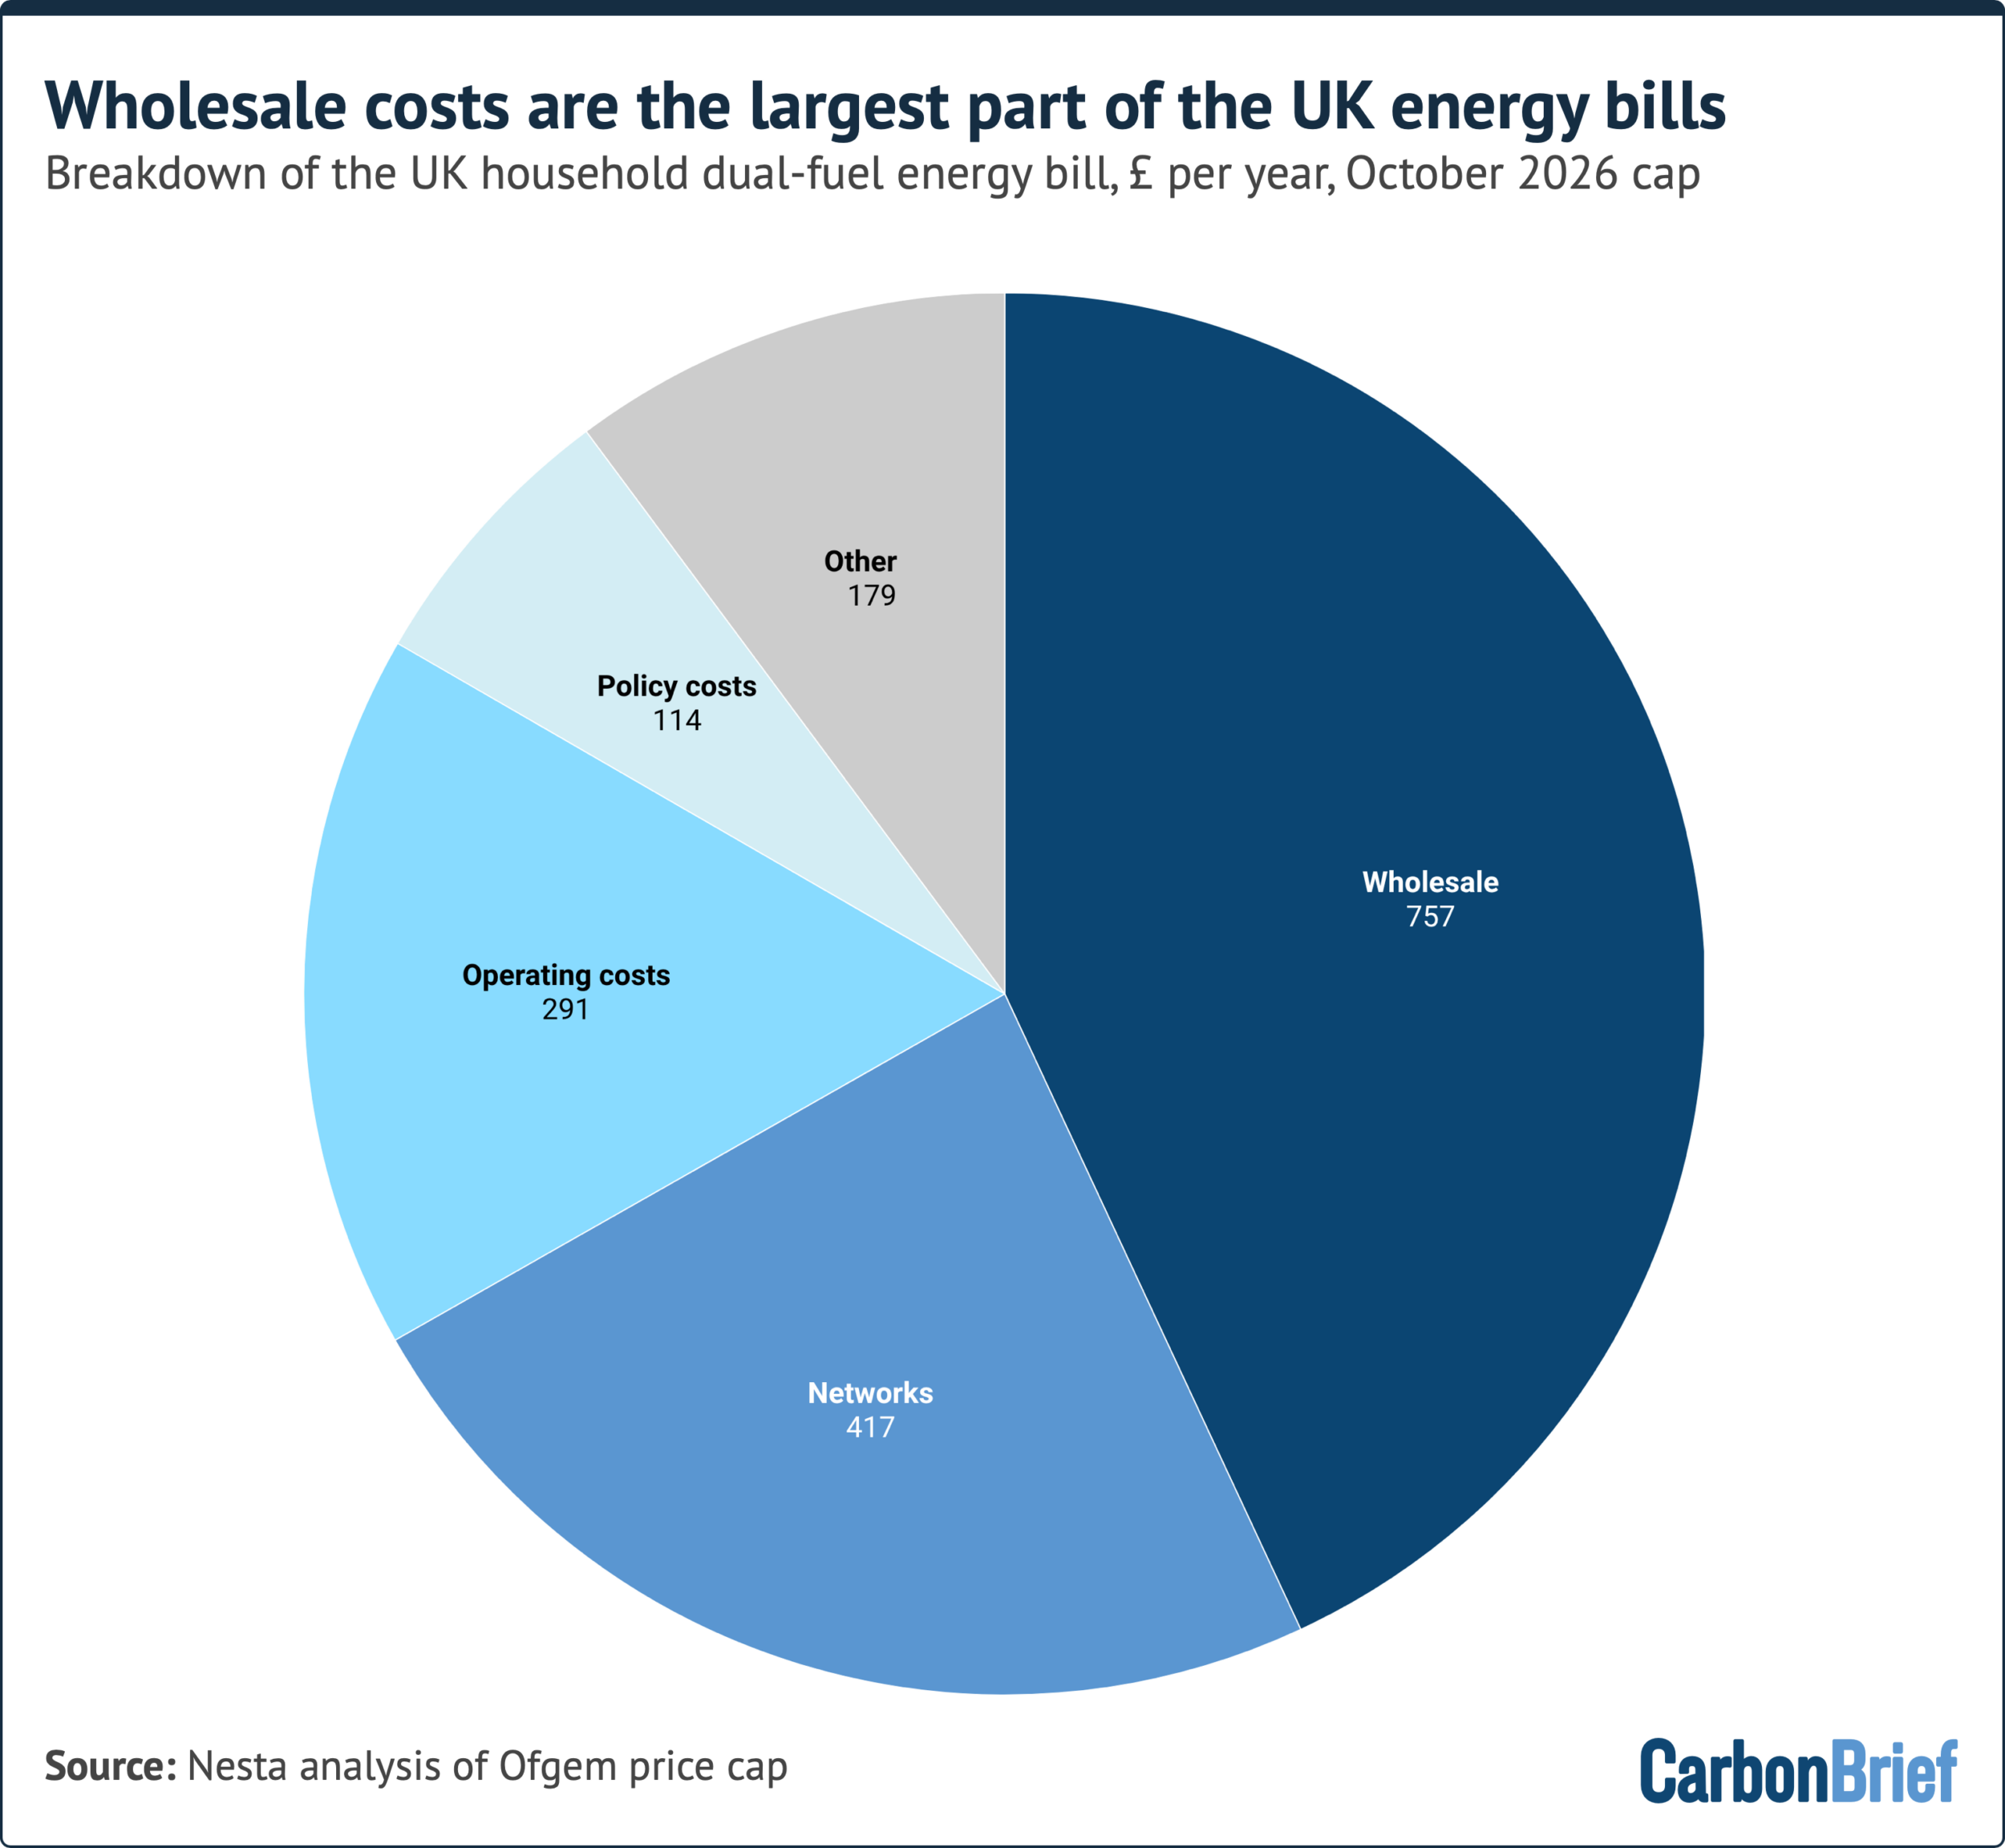
There has been increasing interest in the so-called “non-commodity costs” – those not related to wholesale energy – that now make up a significant portion of bills, as shown in the figure above.
Yet while these costs have been increasing – particularly those related to investing in energy networks – they are not the reason why energy bills have soared once again in recent months.
Indeed, Nesta analysis recently published by Carbon Brief shows that, contrary to widespread UK media and political narratives, a surge in wholesale costs driven by expensive gas is responsible for more than 80% of the rise in dual-fuel household energy bills since 2020, as shown below.
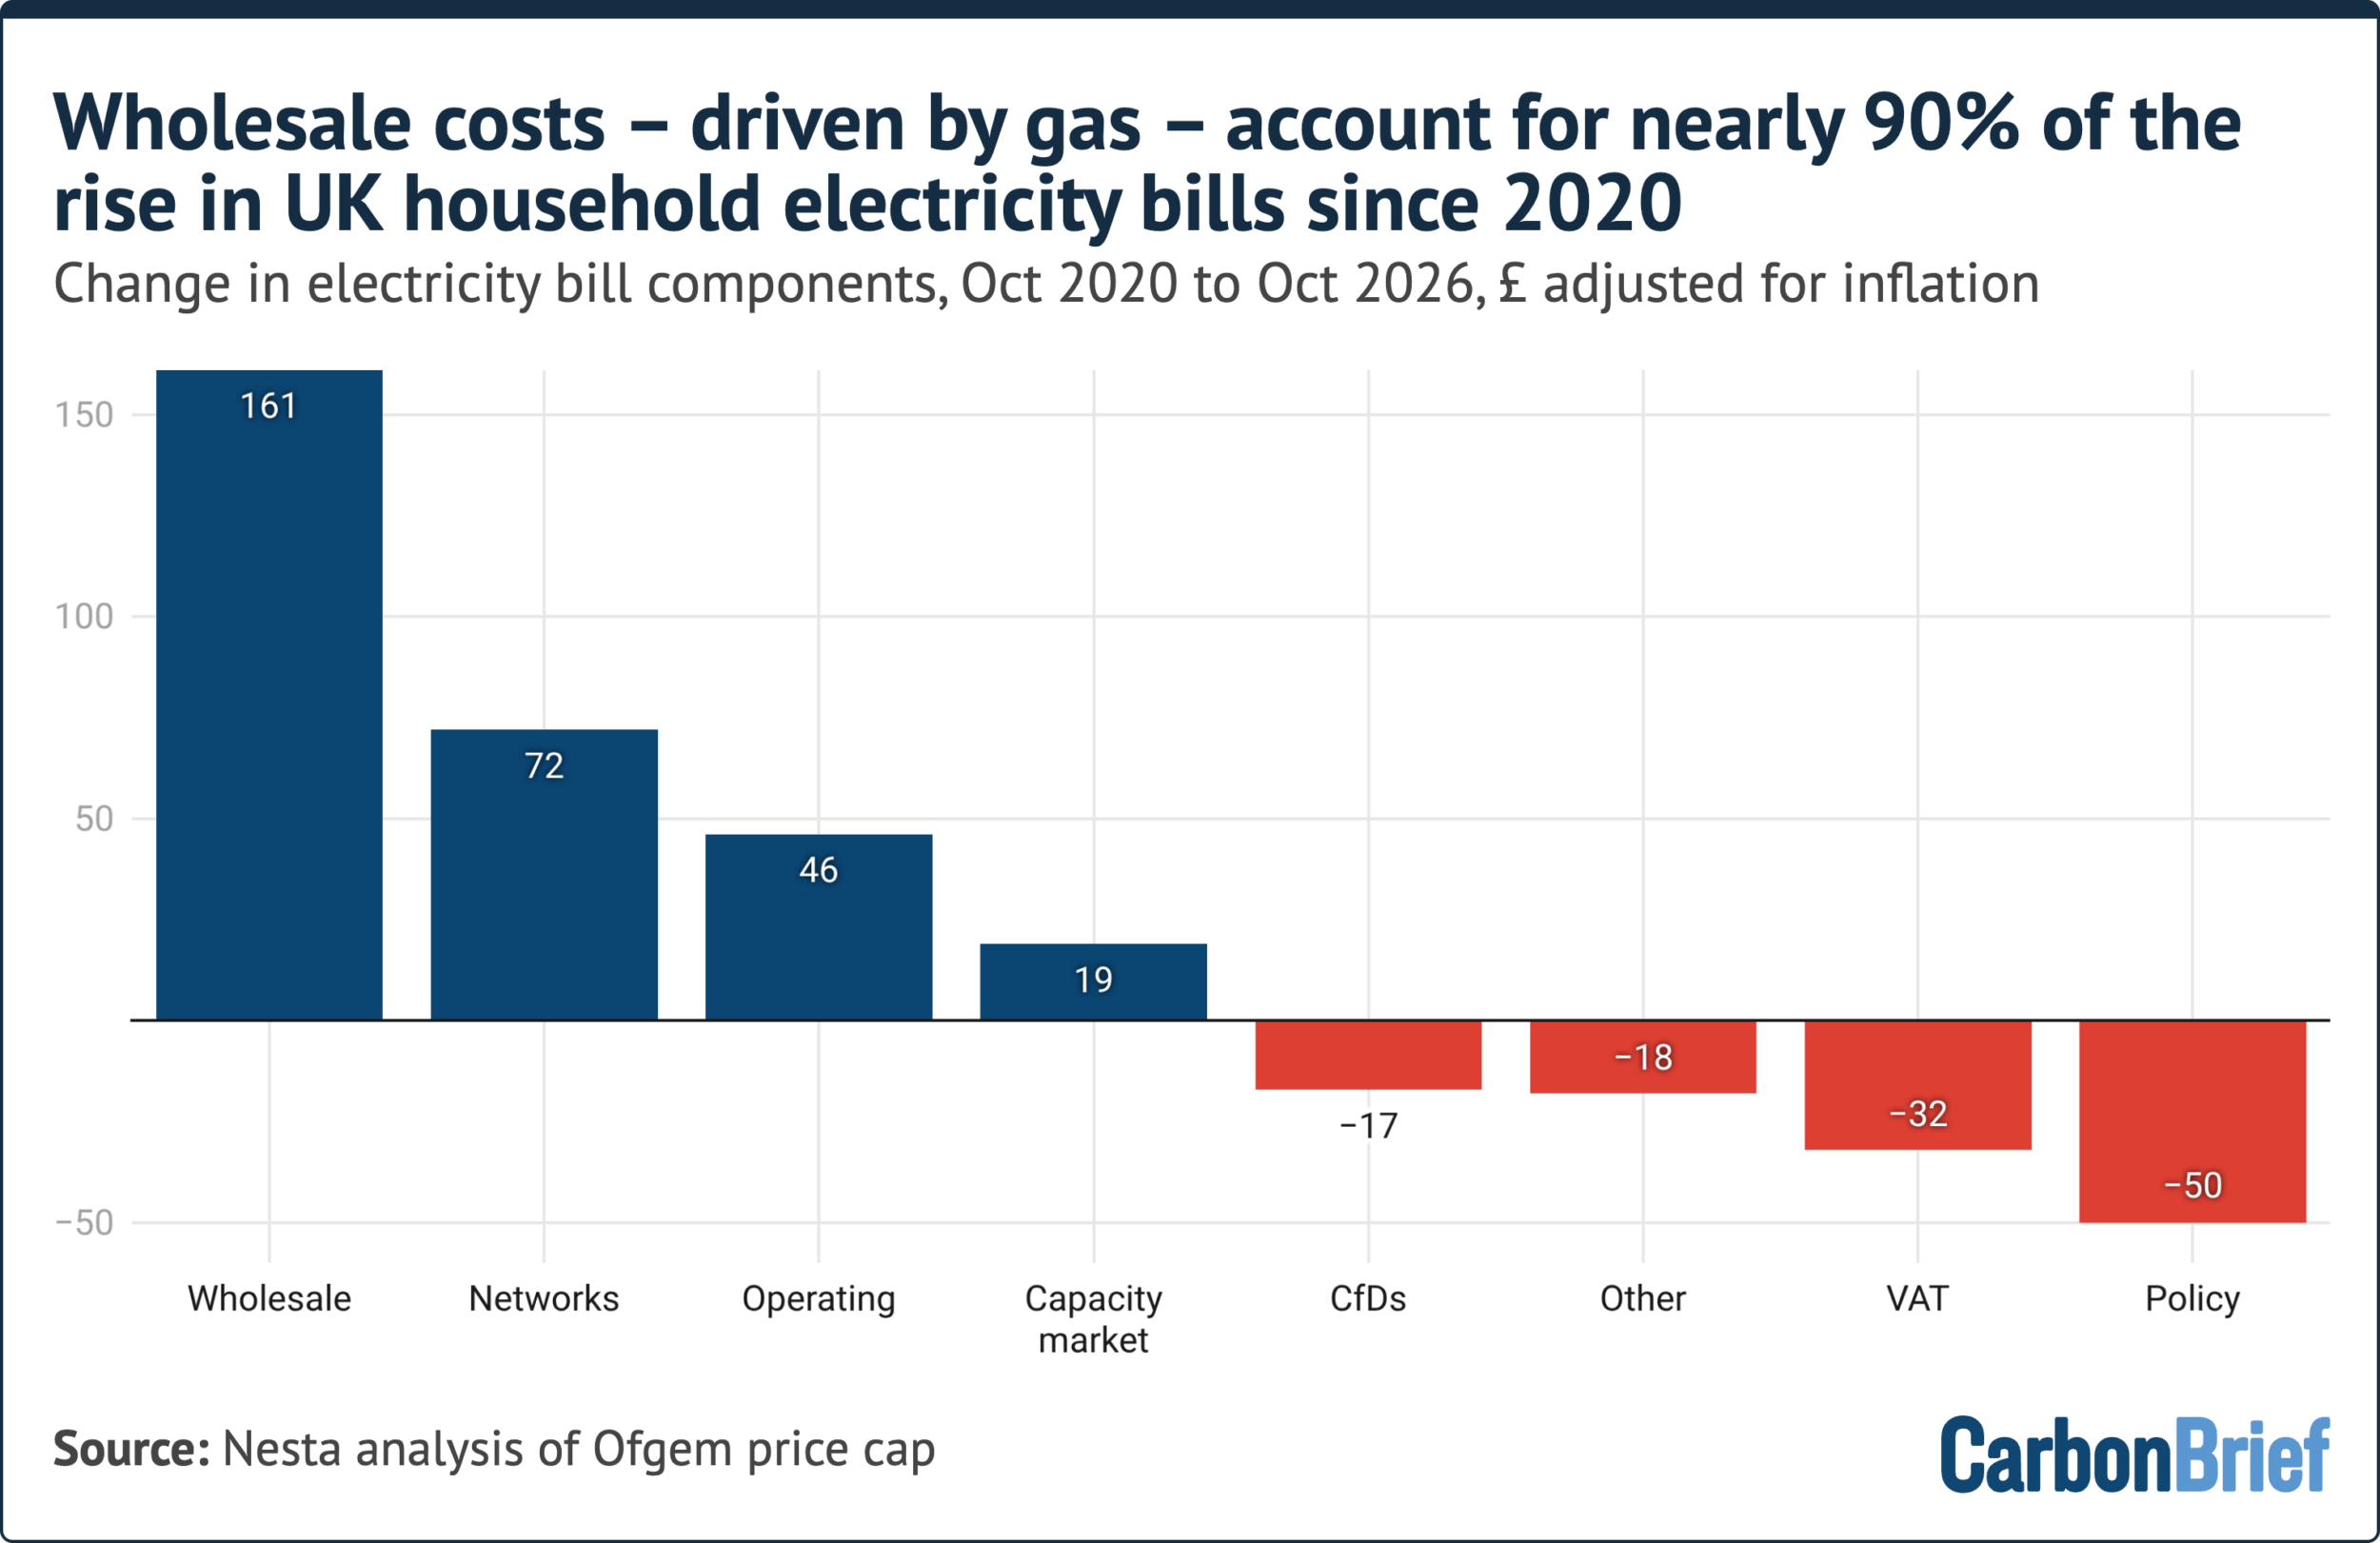
The second-largest driver of the rise in costs since 2020 is due to the cost of operating, maintaining and expanding gas and electricity networks, as shown in the figure above.
At the end of 2025, energy regulator Ofgem approved £29bn of upfront investment into the national gas and electricity grids, as well as the gas distribution network that connects to homes and businesses. This is part of a wider package of up to around £90bn of investment out to 2031.
As a result of these investment plans, network charges are expected to increase by around 50% between 2025 and 2030, from £222 a year to £330 for a typical dual-fuel household.
(This figure covers gas and electricity transmission and gas distribution, but not electricity distribution. A further package of increased investment in the electricity distribution network, for the period from 2028-2033, is due to be approved by Ofgem by the end of 2027.)