

Welcome to Carbon Brief’s DeBriefed.
An essential guide to the week’s key developments relating to climate change.
This week
Trump’s latest climate rollback
RULES REPEALED: The US Environmental Protection Agency (EPA) has begun dismantling Biden-era regulations limiting pollution from power plants, including carbon dioxide emissions, reported the Financial Times. Announcing the repeal, climate-sceptic EPA administrator Lee Zeldin labelled efforts to fight climate change a “cult”, according to the New York Times. Politico said that these actions are the “most important EPA regulatory actions of Donald Trump’s second term to date”.
WEBSITE SHUTDOWN: The Guardian reported that the National Oceanic and Atmospheric Administration (NOAA)’s Climate.gov website “will imminently no longer publish new content” after all production staff were fired. Former employees of the agency interviewed by the Guardian believe the cuts were “specifically aimed at restricting public-facing climate information”.
EVS TARGETED: The Los Angeles Times reported that Trump signed legislation on Thursday “seeking to rescind California’s ambitious auto emission standards, including a landmark rule that eventually would have barred sales of new gas-only cars in California by 2035”.
UK goes nuclear
NEW NUCLEAR: In her first spending review, UK chancellor Rachel Reeves announced £14.2bn for the Sizewell C new nuclear power plant in Suffolk, England – the first new state-backed nuclear power station for decades and the first ever under a Labour government, BBC News reported. The government also announced funding for three small nuclear reactors to be built by Rolls-Royce, said the Times. Carbon Brief has just published a chart showing the “rise, fall and rise” of UK nuclear.
MILIBAND REWARDED: The Times described energy secretary Ed Miliband as one of the “biggest winners” from the review. In spite of relentless negative reporting around him from right-leaning publications, his Department of Energy Security and Net Zero (DESNZ) received the largest relative increase in capital spending. Carbon Brief’s summary has more on all the key climate and energy takeaways from the spending review.
Around the world
- UN OCEAN SUMMIT: In France, a “surge in support” brought the number of countries ratifying the High Seas Treaty to just 10 short of the 60 needed for the agreement to become international law, according to Sky News.
- CALLING TRUMP: Brazil’s president Luiz Inácio Lula da Silva said he would “call” Trump to “persuade him” to attend COP30, according to Agence France-Presse. Meanwhile, the Associated Press reported that the country’s environmental agency has fast tracked oil and highway projects that threaten the Amazon.
- GERMAN FOSSIL SURGE: Due to “low” wind levels, electricity generation from renewables in Germany fell by 17% in the first quarter of this year, while generation from fossil-fuel sources increased significantly, according to the Frankfurter Allgemeine Zeitung.
- BATTERY BOOST: The power ministry in India announced 54bn rupees ($631m) in funding to build 30 gigawatt-hours of new battery energy storage systems to “ensure round-the-clock renewable energy capacities”, reported Money Control.
-19.3C
The temperature that one-in-10 London winters could reach in a scenario where a key Atlantic ocean current system “collapses” and global warming continues under “intermediate” emissions, according to new research covered by Carbon Brief.
Latest climate research
- A study in Science Advances found that damage to coral reefs due to climate change will “outpace” reef expansion. It said “severe declines” will take place within 40-80 years, while “large-scale coral reef expansion requires centuries”.
- Climatic Change published research which identified “displacement and violence, caregiving burdens, early marriages of girls, human trafficking and food insecurity” as the main “mental health” stressors exacerbated by climate change for women in lower and middle-income countries.
- The weakening of a major ocean current system has partially offset the drying of the southern Amazon rainforest, research published in Environmental Research has found, demonstrating that climate tipping elements have the potential to moderate each other.
(For more, see Carbon Brief’s in-depth daily summaries of the top climate news stories on Monday, Tuesday, Wednesday, Thursday and Friday.)
Captured
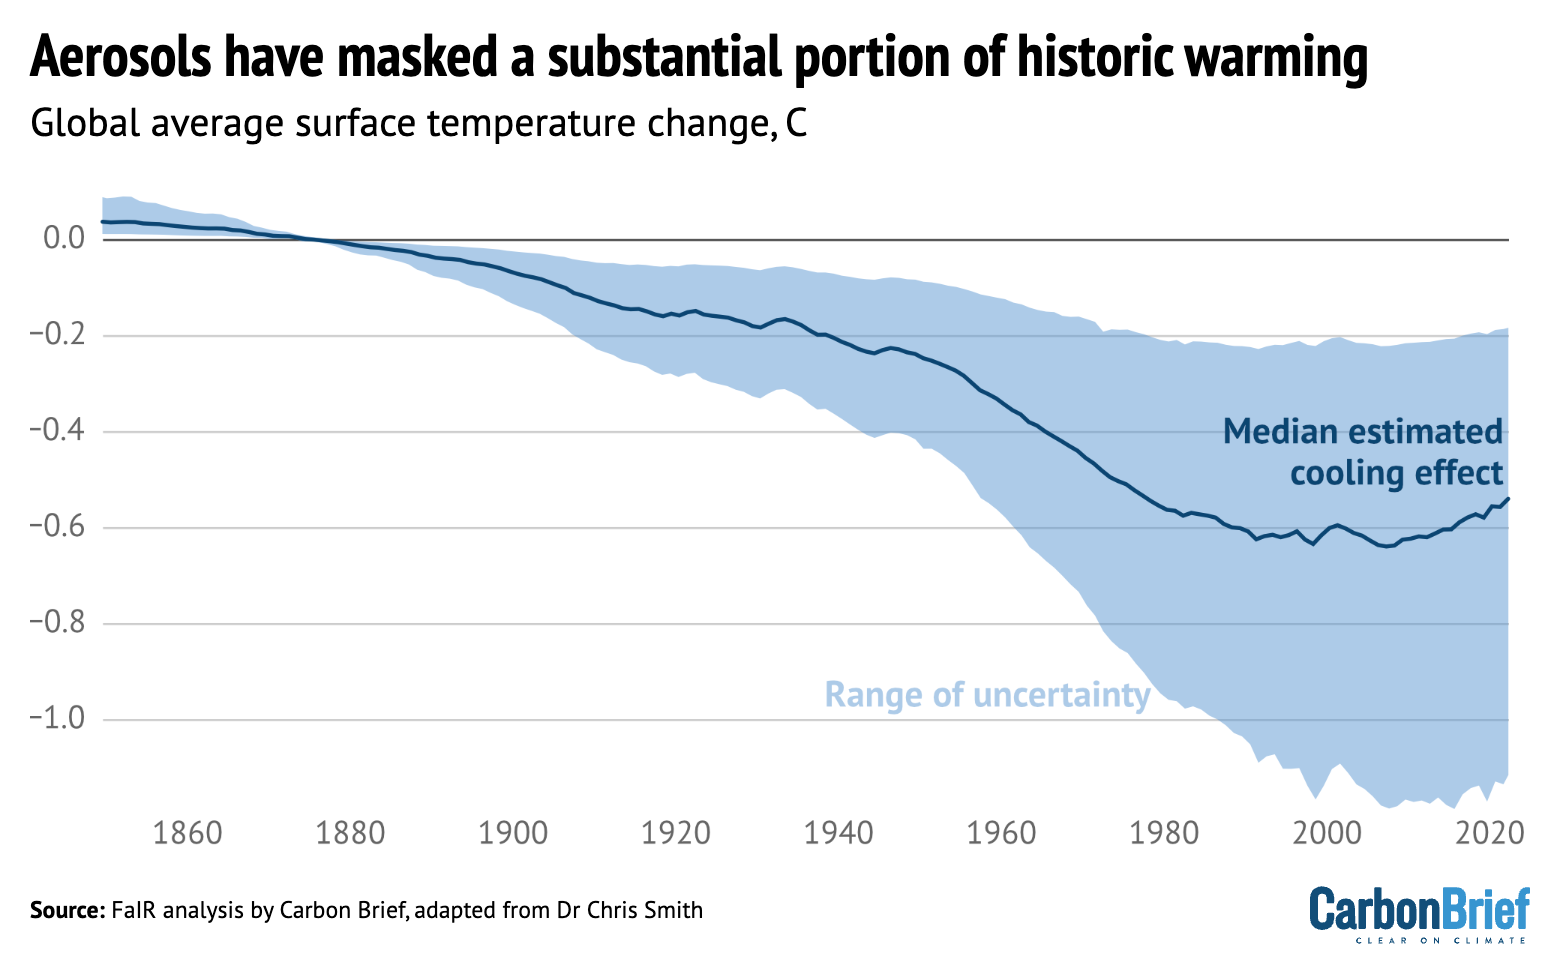
Aerosols – tiny light‑scattering particles produced mainly by burning fossil fuels – absorb or reflect incoming sunlight and influence the formation and brightness of clouds. In this way they have historically “acted as an invisible brake on global warming”. New Carbon Brief analysis by Dr Zeke Hausfather illustrated the extent to which a reduction in aerosol emissions in recent decades, while bringing widespread public health benefits through avoided deaths, has “unmasked” the warming caused by CO2 and other greenhouse gases. The chart above shows the estimated cooling effect of aerosols from the start of the industrial era until 2020.
Spotlight
How Carbon Brief turns complex research into visuals
This week, Carbon Brief’s interactive developer Tom Pearson explains how and why his team creates visuals from research papers.
Carbon Brief’s journalists will often write stories based on new scientific research or policy reports.
These documents will usually contain charts or graphics highlighting something interesting about the story. Sometimes, Carbon Brief’s visuals team will choose to recreate these graphics.
There are many reasons why we choose to spend time and effort doing this, but most often it can be boiled down to some combination of the following things.
Maintaining editorial and visual consistency
We want to, where possible, maintain editorial and visual consistency while matching our graphical and editorial style guides.
In doing this, we are trying to ease our audience’s reading experience. We hope that, by presenting a chart in a way that is consistent with Carbon Brief’s house style, readers will be able to concentrate on the story or the explanation we are trying to communicate and not the way that a chart might have been put together.
Highlighting relevant information
We want to highlight the part of a chart that is most relevant to the story.
Graphics in research papers, especially if they have been designed for a print context, often strive to illustrate many different points with a single figure.
We tend to use charts to answer a single question or provide evidence for a single point.
Paring charts back to their core “message”, removing extraneous elements and framing the chart with a clear editorial title helps with this, as the example below shows.

Ensuring audience understanding
We want to ensure our audience understands the “message” of the chart.
Graphics published in specialist publications, such as scientific journals, might have different expectations regarding a reader’s familiarity with the subject matter and the time they might be expected to spend reading an article.
If we can redraw a chart so that it meets the expectations of a more general audience, we will.
Supporting multiple contexts
We want our graphics to make sense in different contexts.
While we publish our graphics primarily in articles on our website, the nature of the internet means that we cannot guarantee that this is how people will encounter them.
Charts are often shared on social media or copy-pasted into presentations. We want to support these practices by including as much context relevant to understanding within the chart image as possible.
Below illustrates how adding a title and key information can make a chart easier to understand without supporting information.

When we do not recreate charts
When will we not redraw a chart? Most of the time! We are a small team and recreating data graphics requires time, effort, accessible data and often specialist software.
But, despite these constraints, when the conditions are right, the process of redrawing maps and charts allows us to communicate more clearly with our readers, transforming complex research into accessible visual stories.
Watch, read, listen
SPENDING $1BN ON CLIMATE: New Scientist interviewed Greg de Temmerman, former nuclear physicist turned chief science officer at Quadrature Climate Foundation, about the practicalities and ethics of philanthropic climate-science funding.
GENDER HURDLES: Research director Tracy Kajumba has written for Climate Home News about the barriers that women still face in attending and participating in COPs.
OCEAN HEATWAVES: The New York Times presented a richly illustrated look at how marine heatwaves are spreading across the globe and how they affect life in the oceans.
Coming up
- 16-26 June: Bonn climate talks, Bonn, Germany
- 16 June: 79th meeting of the World Meteorological Organization executive council, Geneva, Switzerland
- 17 June: International Energy Agency (IEA) Oil 2025 report launch
Pick of the jobs
- Inside Climate News, California environmental reporter | Salary: Unknown. Location: Southern California
- Natural Resources Wales, lead marine and energy policy advisor | Salary: £45,367-£50,877. Location: Wales
- Children’s Investment Fund Foundation, senior manager, climate | Salary: £82,000. Location: London/hybrid
- Green Party,social media and digital content officer | Salary: £33,211. Location: London/remote
DeBriefed is edited by Daisy Dunne. Please send any tips or feedback to debriefed@carbonbrief.org.
This is an online version of Carbon Brief’s weekly DeBriefed email newsletter. Subscribe for free here.


The post DeBriefed 13 June 2025: Trump’s ‘biggest’ climate rollback; UK goes nuclear; How Carbon Brief visualises research appeared first on Carbon Brief.

Drought and heatwaves occurring together – known as “compound” events – have “surged” across the world since the early 2000s, a new study shows.
Compound drought and heat events (CDHEs) can have devastating effects, creating the ideal conditions for intense wildfires, such as Australia’s “Black Summer” of 2019-20 where bushfires burned 24m hectares and killed 33 people.
The research, published in Science Advances, finds that the increase in CDHEs is predominantly being driven by events that start with a heatwave.
The global area affected by such “heatwave-led” compound events has more than doubled between 1980-2001 and 2002-23, the study says.
The rapid increase in these events over the last 23 years cannot be explained solely by global warming, the authors note.
Since the late 1990s, feedbacks between the land and the atmosphere have become stronger, making heatwaves more likely to trigger drought conditions, they explain.
One of the study authors tells Carbon Brief that societies must pay greater attention to compound events, which can “cause severe impacts on ecosystems, agriculture and society”.
Compound events
CDHEs are extreme weather events where drought and heatwave conditions occur simultaneously – or shortly after each other – in the same region.
These events are often triggered by large-scale weather patterns, such as “blocking” highs, which can produce “prolonged” hot and dry conditions, according to the study.
Prof Sang-Wook Yeh is one of the study authors and a professor at the Ewha Womans University in South Korea. He tells Carbon Brief:
“When heatwaves and droughts occur together, the two hazards reinforce each other through land-atmosphere interactions. This amplifies surface heating and soil moisture deficits, making compound events more intense and damaging than single hazards.”
CDHEs can begin with either a heatwave or a drought.
The sequence of these extremes is important, the study says, as they have different drivers and impacts.
For example, in a CDHE where the heatwave was the precursor, increased direct sunshine causes more moisture loss from soils and plants, leading to a drought.
Conversely, in an event where the drought was the precursor, the lack of soil moisture means that less of the sun’s energy goes into evaporation and more goes into warming the Earth’s surface. This produces favourable conditions for heatwaves.
The study shows that the majority of CDHEs globally start out as a drought.
In recent years, there has been increasing focus on these events due to the devastating impact they have on agriculture, ecosystems and public health.
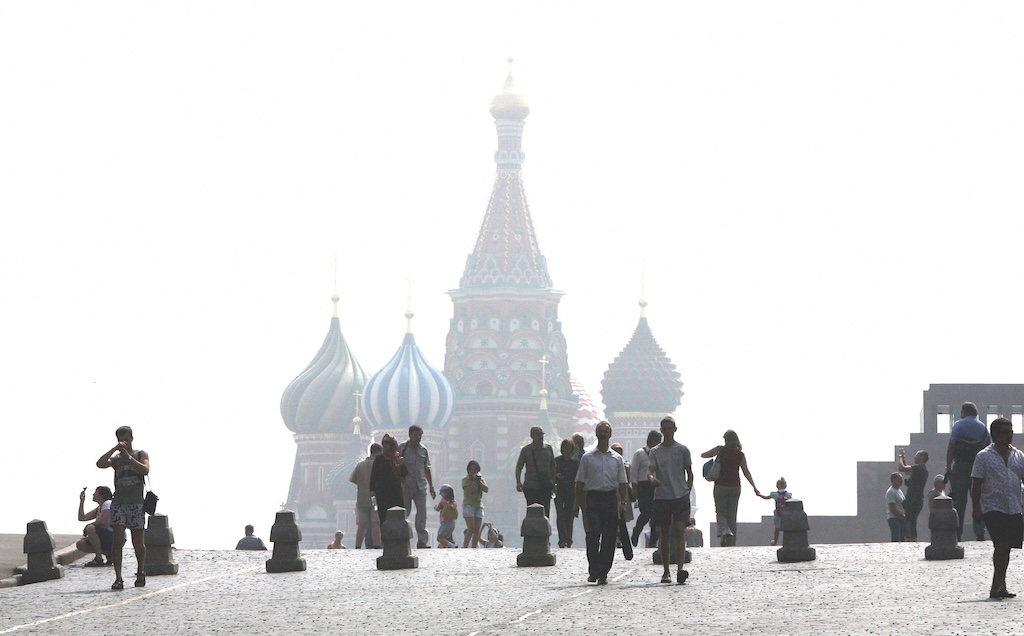
In Russia in the summer of 2010, a compound drought-heatwave event – and the associated wildfires – caused the death of nearly 55,000 people, the study notes.
The record-breaking Pacific north-west “heat dome” in 2021 triggered extreme drought conditions that caused “significant declines” in wheat yields, as well as in barley, canola and fruit production in British Columbia and Alberta, Canada, says the study.
Increasing events
To assess how CDHEs are changing, the researchers use daily reanalysis data to identify droughts and heatwaves events. (Reanalysis data combines past observations with climate models to create a historical climate record.) Then, using an algorithm, they analyse how these events overlap in both time and space.
The study covers the period from 1980 to 2023 and the world’s land surface, excluding polar regions where CDHEs are rare.
The research finds that the area of land affected by CDHEs has “increased substantially” since the early 2000s.
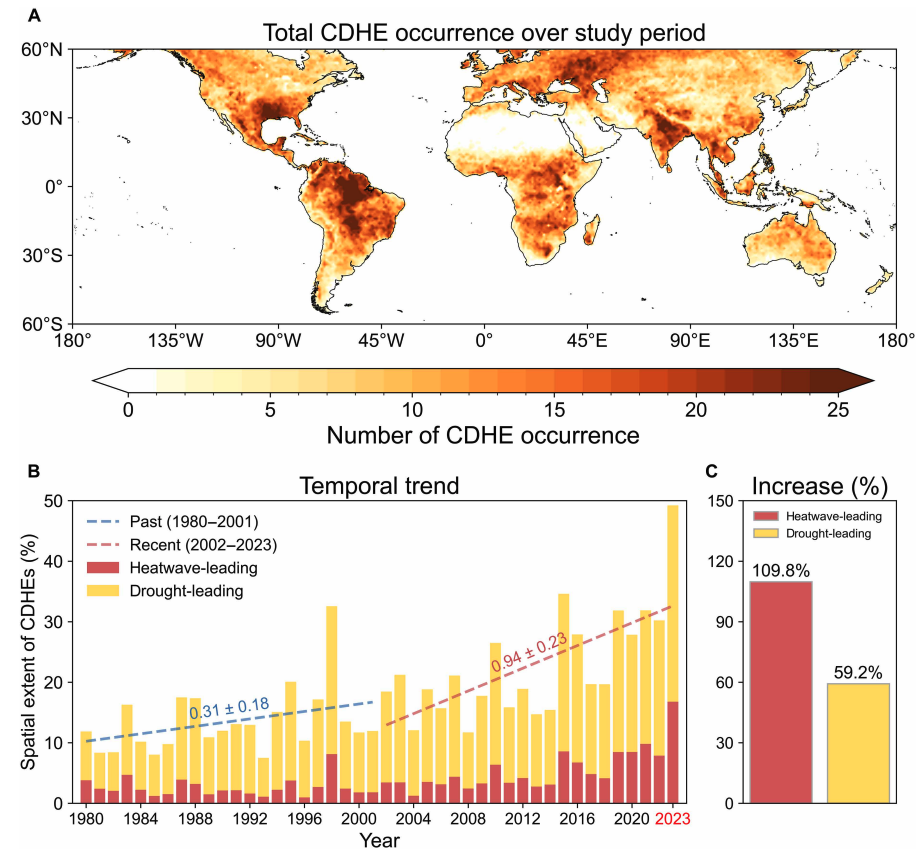
Heatwave-led events have been the main contributor to this increase, the study says, with their spatial extent rising 110% between 1980-2001 and 2002-23, compared to a 59% increase for drought-led events.
The map below shows the global distribution of CDHEs over 1980-2023. The charts show the percentage of the land surface affected by a heatwave-led CDHE (red) or a drought-led CDHE (yellow) in a given year (left) and relative increase in each CDHE type (right).
The study finds that CDHEs have occurred most frequently in northern South America, the southern US, eastern Europe, central Africa and south Asia.
Threshold passed
The authors explain that the increase in heatwave-led CDHEs is related to rising global temperatures, but that this does not tell the whole story.
In the earlier 22-year period of 1980-2001, the study finds that the spatial extent of heatwave-led CDHEs rises by 1.6% per 1C of global temperature rise. For the more-recent period of 2022-23, this increases “nearly eightfold” to 13.1%.
The change suggests that the rapid increase in the heatwave-led CDHEs occurred after the global average temperature “surpasse[d] a certain temperature threshold”, the paper says.
This threshold is an absolute global average temperature of 14.3C, the authors estimate (based on an 11-year average), which the world passed around the year 2000.
Investigating the recent surge in heatwave-leading CDHEs further, the researchers find a “regime shift” in land-atmosphere dynamics “toward a persistently intensified state after the late 1990s”.
In other words, the way that drier soils drive higher surface temperatures, and vice versa, is becoming stronger, resulting in more heatwave-led compound events.
Daily data
The research has some advantages over other previous studies, Yeh says. For instance, the new work uses daily estimations of CDHEs, compared to monthly data used in past research. This is “important for capturing the detailed occurrence” of these events, says Yeh.
He adds that another advantage of their study is that it distinguishes the sequence of droughts and heatwaves, which allows them to “better understand the differences” in the characteristics of CDHEs.
Dr Meryem Tanarhte is a climate scientist at the University Hassan II in Morocco, and Dr Ruth Cerezo Mota is a climatologist and a researcher at the National Autonomous University of Mexico. Both scientists, who were not involved in the study, agree that the daily estimations give a clearer picture of how CDHEs are changing.
Cerezo-Mota adds that another major contribution of the study is its global focus. She tells Carbon Brief that in some regions, such as Mexico and Africa, there is a lack of studies on CDHEs:
“Not because the events do not occur, but perhaps because [these regions] do not have all the data or the expertise to do so.”
However, she notes that the reanalysis data used by the study does have limitations with how it represents rainfall in some parts of the world.
Compound impacts
The study notes that if CDHEs continue to intensify – particularly events where heatwaves are the precursors – they could drive declining crop productivity, increased wildfire frequency and severe public health crises.
These impacts could be “much more rapid and severe as global warming continues”, Yeh tells Carbon Brief.
Tanarhte notes that these events can be forecasted up to 10 days ahead in many regions. Furthermore, she says, the strongest impacts can be prevented “through preparedness and adaptation”, including through “water management for agriculture, heatwave mitigation measures and wildfire mitigation”.
The study recommends reassessing current risk management strategies for these compound events. It also suggests incorporating the sequences of drought and heatwaves into compound event analysis frameworks “to enhance climate risk management”.
Cerezo-Mota says that it is clear that the world needs to be prepared for the increased occurrence of these events. She tells Carbon Brief:
“These [risk assessments and strategies] need to be carried out at the local level to understand the complexities of each region.”



The post Heatwaves driving recent ‘surge’ in compound drought and heat extremes appeared first on Carbon Brief.
Heatwaves driving recent ‘surge’ in compound drought and heat extremes
Greenhouse Gases
DeBriefed 6 March 2026: Iran energy crisis | China climate plan | Bristol’s ‘pioneering’ wind turbine
Welcome to Carbon Brief’s DeBriefed.
An essential guide to the week’s key developments relating to climate change.
This week
Energy crisis
ENERGY SPIKE: US-Israeli attacks on Iran and subsequent counterattacks across the Middle East have sent energy prices “soaring”, according to Reuters. The newswire reported that the region “accounts for just under a third of global oil production and almost a fifth of gas”. The Guardian noted that shipping traffic through the strait of Hormuz, which normally ferries 20% of the world’s oil, “all but ground to a halt”. The Financial Times reported that attacks by Iran on Middle East energy facilities – notably in Qatar – triggered the “biggest rise in gas prices since Russia’s full-scale invasion of Ukraine”.
‘RISK’ AND ‘BENEFITS’: Bloomberg reported on increases in diesel prices in Europe and the US, speculating that rising fuel costs could be “a risk for president Donald Trump”. US gas producers are “poised to benefit from the big disruption in global supply”, according to CNBC. Indian government sources told the Economic Times that Russia is prepared to “fulfil India’s energy demands”. China Daily quoted experts who said “China’s energy security remains fundamentally unshaken”, thanks to “emergency stockpiles and a wide array of import channels”.
‘ESSENTIAL’ RENEWABLES: Energy analysts said governments should cut their fossil-fuel reliance by investing in renewables, “rather than just seeking non-Gulf oil and gas suppliers”, reported Climate Home News. This message was echoed by UK business secretary Peter Kyle, who said “doubling down on renewables” was “essential” amid “regional instability”, according to the Daily Telegraph.
China’s climate plan
PEAK COAL?: China has set out its next “five-year plan” at the annual “two sessions” meeting of the National People’s Congress, including its climate strategy out to 2030, according to the Hong Kong-based South China Morning Post. The plan called for China to cut its carbon emissions per unit of gross domestic produc