

The amount of UK electricity generated from fossil fuels fell 22% year-on-year in 2023 to the lowest level since 1957, Carbon Brief analysis reveals.
The 104 terawatt hours (TWh) generated from fossil fuels in 2023 is the lowest level in 66 years. Back then, Harold Macmillan was the UK prime minister and the Beatles’ John Lennon and Paul McCartney had just met for the first time.
Electricity from fossil fuels has now fallen by two-thirds (199TWh) since peaking in 2008. Within that total, coal has dropped by 115TWh (97%) and gas by 80TWh (45%).
These declines have been caused by the rapid expansion of renewable energy (up six-fold since 2008, some 113TWh) and by lower electricity demand (down 21% since 2008, some 83TWh).
As a result, fossil fuels made up just 33% of UK electricity supplies in 2023 – their lowest ever share – of which gas was 31%, coal just over 1% and oil just below 1%.
Low-carbon sources made up 56% of the total, of which renewables were 43% and nuclear 13%. The remainder is from imports (7%) and other sources (3%), such as waste incineration.
Overall, the electricity generated in the UK in 2023 had the lowest-ever carbon intensity, with an average of 162g of carbon dioxide per kilowatt hour (gCO2/kWh).
This remains a long way from the government’s ambition for 95% low-carbon electricity by 2030 – just seven years from now – and a fully decarbonised grid by 2035.
Fossil falls
Historically, fossil-fuel generation rose steadily as the size of the UK’s economy expanded – and, relatedly, as demand for electricity grew.
The rise in demand for electricity paused during the late 1970s and 1980s, as the country’s economic situation and industrial relations worsened. Yet the upwards march soon resumed.
Electricity demand then started to “decouple” from economic growth in the early 2000s, leading to a peak in 2005. Since then, demand has dropped precipitously, falling from 396TWh in 2008 to 313TWh in 2023, as shown by the dark blue line in the figure below.
This reduction in demand of 83TWh (21%) is equivalent to more than three times the expected output of the Hinkley Point C nuclear power plant, which is currently being built in Somerset.
Demand reductions are the result of a poorly understood combination of more efficient appliances and lighting, high prices driven by expensive gas and changes in the structure of the UK as it shifts to an ever more service-led rather than manufacturing-heavy economy.
(In the medium- to long-term, electricity demand is expected to rise as transport and heating are increasingly electrified using electric vehicles and heat pumps.)
While electricity demand was falling, the UK was also starting to rapidly scale its renewable energy capacity, primarily from wind, but also from solar and bioenergy.
As a result, renewable electricity output climbed six-fold from 23TWh in 2008 to 135TWh in 2023, shown by the red line in the chart below.
The combined impact of falling demand (-83TWh) and rising renewables (+113TWh) has acted as a pincer on electricity generation from fossil fuels, squeezing it from two directions.
Having peaked at 303TWh in 2008, the UK got just 104TWh of electricity from fossil fuels in 2023 – as shown by the steep black line in the figure below – a two-thirds reduction in 15 years. This takes fossil-fuel generation to its lowest level since 1957.

In 1957, the Conservative party’s Harold Macmillan was elected UK prime minister in January following Anthony Eden’s resignation due to ill health.
That same year, the Central Electricity Generating Board was established ‘to keep the lights on’. It was responsible for electricity generation, transmission and bulk sales in England and Wales up until the electricity sector was privatised in the 1990s.
The world’s first commercial nuclear power station, at Calder Hall in Cumbria, had just opened its second unit, yet fossil fuels still supplied 97% of the UK’s electricity.
Also that year, the Suez canal was reopened, “Sputnik 1” – the first artificial satellite to orbit Earth – was launched by the Soviet Union and the UK government unveiled plans to allow women to join the House of Lords for the first time.
Shifting shares
For most of the past century, fossil fuels generated almost all of the UK’s electricity, as shown by the black line in the figure below. Fossil fuels – predominantly coal – made up 97% of the total in 1957, a figure that had barely changed for decades.
The rise of nuclear power (dark blue line) from the late 1950s onwards – after Calder Hall opened in 1956 – pushed the fossil fuel share downwards.
Yet electricity demand continued to grow and the earliest nuclear reactors were starting to shut down by the early 2000s, with only Sizewell B in Suffolk, in 1995, having replaced them.
With renewables still in their infancy, this meant that, in 2008, the UK was still getting 76% of its electricity from fossil fuels. Of this, 45% was from gas and 30% from coal.
Since then, fossil fuels’ share has dropped to a record-low 33% in 2023, being overtaken by renewables in the process (red line).
Renewables’ share reached a record high of 43% in 2023, with nuclear (13%, light blue line), imports (7%) and other sources (3%) making up the remainder.

The total share from low-carbon sources – renewables and nuclear – was 56% in 2023. This was down one point from the record 57% share in 2022, as a result of a drop in nuclear output.
The current government’s ambition is to get 95% of the country’s electricity from low-carbon sources by 2030, which would mean an increase of 39 percentage points in seven years.
To date, the fastest rate of increase has been 25 percentage points in seven years, achieved between 2010 (23% low-carbon) and 2017 (48%).
The aim is then to fully decarbonise the grid by 2035. The opposition Labour Party’s aim is even more ambitious, hoping to fully decarbonise the electricity grid already by 2030. This would be a 44 percentage point increase in seven years.
Renewable rise
The rise of renewables since 2008 has been nearly as steep as the fall for fossil fuels, as shown by the red line in the figure below.
Notably, however, since reaching 134TWh in 2020, renewables have effectively stood still, with output of 135TWh in 2023, matching the record 135TWh set in 2022.
This reflects the balance between continued increases in wind and solar capacity, variations in average weather conditions and reduced output in the past two years from bioenergy.
The 135TWh of renewable electricity in 2023 was made up of:
- 82TWh from wind (up 2TWh year-on-year, a 2% increase);
- 35TWh from bioenergy (down 5TWh and 13% from 2021 levels);
- 14TWh from solar (up 2% year-on-year);
- 5TWh from hydro (down 1TWh year-on-year, a 9% drop).
At the same time, coal has nearly disappeared from the UK electricity system, falling from 119TWh in 2008 to 4TWh in 2023 (down 115TWh, 97%), shown by the black line below.
Gas, meanwhile, is now down to levels rarely seen since the mid-1990s (grey line), falling from 178TWh in 2008 to just 98TWh in 2023 (down 80TWh, 45%).
Nuclear also continues to decline, reaching 41TWh in 2023, a 7TWh reduction year-on-year (15%) from already low levels, after Hinkley Point B in Somerset closed down and the remaining five stations were temporarily offline for planned maintenance outages.

Capacity for both onshore and offshore wind projects rose in 2023, by 0.6GW and 1.1GW, respectively.
Average wind speeds in the first 11 months of 2023 were well below the long-term average however, according to government figures, whereas 2022 had only been marginally below average. This muted overall generation growth over the last year somewhat.
A windy December helped boost overall generation figures for the year, with a new wind generation record provisionally set on 21 December according to National Grid ESO. Wind generation hit 21.8GW between 8:00 and 8:30 on 21 December, providing 56% of the generation mix.
Notably, only one offshore windfarm was completed in 2023 – the 1GW Seagreen development off the east coast of Scotland – whereas three projects totalling 3GW were commissioned in 2022.
In October 2023, Dogger Bank off the coast of Yorkshire sent power to the national grid for the first time. It will be the world’s largest offshore windfarm, at 3.6GW, when it is completed in 2026.
Nevertheless, the government’s ambition for 50GW of offshore wind by 2030 is in doubt after the latest auction for new renewable capacity failed to secure any additional projects.
For bioenergy, the 35TWh in 2023 was similar to the level delivered in 2022, but down from 40TWh in 2020 and 2021. Plant biomass – mainly woodchips – is around two-thirds of these annual totals.
The four wood-burning former coal units at the Drax plant in Yorkshire account for around one-third of power from bioenergy on their own. However, their output has been subdued in 2022 and 2023, with some reporting having raised questions about the incentives at play.
Meanwhile, electricity generation from solar power only increased by 2% in 2023, despite a surge in new capacity being connected to the grid.
The number of hours of sunshine during 2023 was roughly in line with the long-term average, government figures show, whereas 2022 had been unusually sunny.
According to figures from consultancy Rystad Energy cited by Drax Electric Insights, the UK’s solar capacity was expected to rise from 15GW at the start of 2023 to 18GW by the end of the year.
Recent growth in solar installations comes after an extended period of stagnation, with installed capacity having reached 13GW in 2018 and only climbing to 14GW in 2022.
Rystad Energy expects UK solar capacity to continue accelerating, topping 25GW in 2025.
The latest reduction in coal generation, down another 33% in 2023, came as three of the UK’s four remaining coal-fired power stations shut down.

West Burton in Nottinghamshire closed in March, then Drax in Yorkshire closed in April, followed by Kilroot in Northern Ireland at the end of September.
Only Ratcliffe in Nottinghamshire, operated by utility firm Uniper, remains operational. It plans to close in September 2024, ahead of the government’s ambition to end coal power by October 2024.
While the UK saw a major coal-to-gas transition in the 1990s “dash for gas”, recent reductions in coal use have been driven by renewables and reduced demand. These same forces have also been driving gas out of the mix.
The large drop in gas generation in 2023 of 27TWh (21%) reflects a combination of this longer-term trend with a one-off flip in the UK’s electricity imports.
The dip in the dark blue line for “oil, imports and other” in 2022 is due to the UK becoming a net electricity exporter that year for the first time ever.
Every year since the opening of the first “interconnector” linking the grids of the UK and France in 1986, the UK has been a net electricity importer – apart from 2022.
The switch in 2022 was due to widespread outages in the French nuclear fleet, with neighbouring countries including the UK picking up the slack.
In 2023, the UK reverted to being a net importer, buying 23TWh of electricity from countries including France, the Netherlands, Belgium and Norway. This was similar to 2021 (25TWh).
The switch from being a net exporter of 5TWh in 2022 to net imports of 23TWh in 2023 combined with steady output from renewables and falling demand to push down the need for fossil fuels.
The UK now has 8.4 gigawatts (GW) of interconnector capacity to link its electricity system with that of neighbouring countries. Some 4.4GW of this has been added in the past five years.
In addition, the 1.4GW Viking Link interconnector between the UK and Denmark was completed in late 2023, and started operating on 29 December.
Another 4.7GW has regulatory approval, with further projects totalling 5.6GW also planned.
Cleanest power
With fossil fuels reaching a record-low 33% share and coal down to 1% of the total, the UK saw its lowest-carbon electricity mix ever in 2023.
The carbon intensity of electricity – in other words, the amount of CO2 associated with each unit of electricity – fell to a record-low 162gCO2/kWh in 2023, a reduction of 18% year-on-year.
This continues a longer-term trend, shown in the figure below. In the early years of the series, the reductions in carbon intensity reflect a shift towards more efficient power plants.
The expansion of nuclear power in the 1970s and 1980s was followed by the “dash for gas”, which is lower-carbon than coal. From around 2008, the decline is due to the rise of renewables.

The government had earlier set a goal of reducing the carbon intensity of electricity generation to below 100gCO2/kWh by 2030. Since then, the UK’s 2050 climate target has been strengthened from an 80% cut in emissions to a 100% cut – reaching net-zero by that date.
If the government reaches its aim of 95% low-carbon electricity by 2030 then the carbon intensity of generation would fall to well-below 100gCO2/kWh. Just how far below would depend on the contribution from bioenergy and whether CO2 associated with imported electricity is counted.
The figure above counts bioenergy lifecycle emissions and imports towards the total.
Methodology
The figures in the article are from Carbon Brief analysis of data from DESNZ Energy Trends chapter 5 and chapter 6, as well as from BM Reports. The figures from BM Reports are for electricity supplied to the grid in Great Britain only and are adjusted to include Northern Ireland.
In Carbon Brief’s analysis, the BM Reports numbers are also adjusted to account for electricity used by power plants on site and for generation by plants not connected to the high-voltage national grid. This includes many onshore windfarms, as well as industrial gas combined heat and power plants and those burning landfill gas, waste or sewage gas.
The analysis of carbon intensity is based on the methodology published by National Grid ESO, but also takes account of fuel use efficiency for earlier years.
DESNZ historical electricity data, including years before 2009, is adjusted in line with other figures and combined with data on imports from a separate DESNZ dataset. Note that the data prior to 1951 only includes “major” power producers.


The post Analysis: UK electricity from fossil fuels drops to lowest level since 1957 appeared first on Carbon Brief.
Analysis: UK electricity from fossil fuels drops to lowest level since 1957

Drought and heatwaves occurring together – known as “compound” events – have “surged” across the world since the early 2000s, a new study shows.
Compound drought and heat events (CDHEs) can have devastating effects, creating the ideal conditions for intense wildfires, such as Australia’s “Black Summer” of 2019-20 where bushfires burned 24m hectares and killed 33 people.
The research, published in Science Advances, finds that the increase in CDHEs is predominantly being driven by events that start with a heatwave.
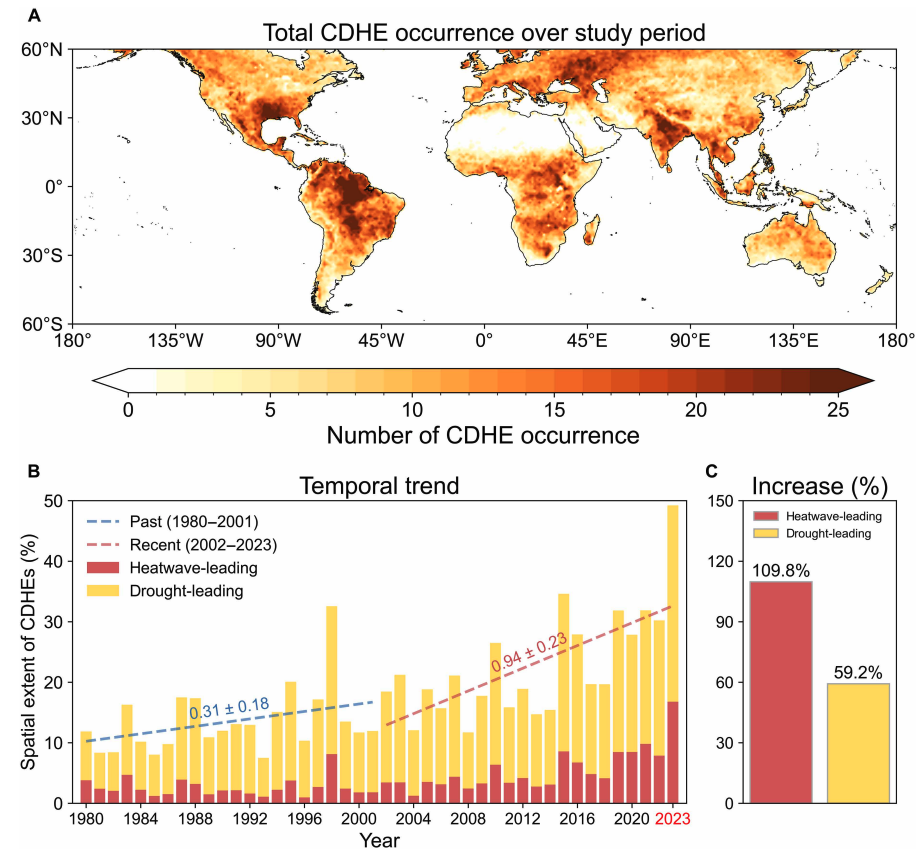
The global area affected by such “heatwave-led” compound events has more than doubled between 1980-2001 and 2002-23, the study says.
The rapid increase in these events over the last 23 years cannot be explained solely by global warming, the authors note.
Since the late 1990s, feedbacks between the land and the atmosphere have become stronger, making heatwaves more likely to trigger drought conditions, they explain.
One of the study authors tells Carbon Brief that societies must pay greater attention to compound events, which can “cause severe impacts on ecosystems, agriculture and society”.
Compound events
CDHEs are extreme weather events where drought and heatwave conditions occur simultaneously – or shortly after each other – in the same region.
These events are often triggered by large-scale weather patterns, such as “blocking” highs, which can produce “prolonged” hot and dry conditions, according to the study.
Prof Sang-Wook Yeh is one of the study authors and a professor at the Ewha Womans University in South Korea. He tells Carbon Brief:
“When heatwaves and droughts occur together, the two hazards reinforce each other through land-atmosphere interactions. This amplifies surface heating and soil moisture deficits, making compound events more intense and damaging than single hazards.”
CDHEs can begin with either a heatwave or a drought.
The sequence of these extremes is important, the study says, as they have different drivers and impacts.
For example, in a CDHE where the heatwave was the precursor, increased direct sunshine causes more moisture loss from soils and plants, leading to a drought.
Conversely, in an event where the drought was the precursor, the lack of soil moisture means that less of the sun’s energy goes into evaporation and more goes into warming the Earth’s surface. This produces favourable conditions for heatwaves.
The study shows that the majority of CDHEs globally start out as a drought.
In recent years, there has been increasing focus on these events due to the devastating impact they have on agriculture, ecosystems and public health.
In Russia in the summer of 2010, a compound drought-heatwave event – and the associated wildfires – caused the death of nearly 55,000 people, the study notes.

The record-breaking Pacific north-west “heat dome” in 2021 triggered extreme drought conditions that caused “significant declines” in wheat yields, as well as in barley, canola and fruit production in British Columbia and Alberta, Canada, says the study.
Increasing events
To assess how CDHEs are changing, the researchers use daily reanalysis data to identify droughts and heatwaves events. (Reanalysis data combines past observations with climate models to create a historical climate record.) Then, using an algorithm, they analyse how these events overlap in both time and space.
The study covers the period from 1980 to 2023 and the world’s land surface, excluding polar regions where CDHEs are rare.
The research finds that the area of land affected by CDHEs has “increased substantially” since the early 2000s.
Heatwave-led events have been the main contributor to this increase, the study says, with their spatial extent rising 110% between 1980-2001 and 2002-23, compared to a 59% increase for drought-led events.
The map below shows the global distribution of CDHEs over 1980-2023. The charts show the percentage of the land surface affected by a heatwave-led CDHE (red) or a drought-led CDHE (yellow) in a given year (left) and relative increase in each CDHE type (right).
The study finds that CDHEs have occurred most frequently in northern South America, the southern US, eastern Europe, central Africa and south Asia.
Threshold passed
The authors explain that the increase in heatwave-led CDHEs is related to rising global temperatures, but that this does not tell the whole story.
In the earlier 22-year period of 1980-2001, the study finds that the spatial extent of heatwave-led CDHEs rises by 1.6% per 1C of global temperature rise. For the more-recent period of 2022-23, this increases “nearly eightfold” to 13.1%.
The change suggests that the rapid increase in the heatwave-led CDHEs occurred after the global average temperature “surpasse[d] a certain temperature threshold”, the paper says.
This threshold is an absolute global average temperature of 14.3C, the authors estimate (based on an 11-year average), which the world passed around the year 2000.
Investigating the recent surge in heatwave-leading CDHEs further, the researchers find a “regime shift” in land-atmosphere dynamics “toward a persistently intensified state after the late 1990s”.
In other words, the way that drier soils drive higher surface temperatures, and vice versa, is becoming stronger, resulting in more heatwave-led compound events.
Daily data
The research has some advantages over other previous studies, Yeh says. For instance, the new work uses daily estimations of CDHEs, compared to monthly data used in past research. This is “important for capturing the detailed occurrence” of these events, says Yeh.
He adds that another advantage of their study is that it distinguishes the sequence of droughts and heatwaves, which allows them to “better understand the differences” in the characteristics of CDHEs.
Dr Meryem Tanarhte is a climate scientist at the University Hassan II in Morocco, and Dr Ruth Cerezo Mota is a climatologist and a researcher at the National Autonomous University of Mexico. Both scientists, who were not involved in the study, agree that the daily estimations give a clearer picture of how CDHEs are changing.
Cerezo-Mota adds that another major contribution of the study is its global focus. She tells Carbon Brief that in some regions, such as Mexico and Africa, there is a lack of studies on CDHEs:
“Not because the events do not occur, but perhaps because [these regions] do not have all the data or the expertise to do so.”
However, she notes that the reanalysis data used by the study does have limitations with how it represents rainfall in some parts of the world.
Compound impacts
The study notes that if CDHEs continue to intensify – particularly events where heatwaves are the precursors – they could drive declining crop productivity, increased wildfire frequency and severe public health crises.
These impacts could be “much more rapid and severe as global warming continues”, Yeh tells Carbon Brief.
Tanarhte notes that these events can be forecasted up to 10 days ahead in many regions. Furthermore, she says, the strongest impacts can be prevented “through preparedness and adaptation”, including through “water management for agriculture, heatwave mitigation measures and wildfire mitigation”.
The study recommends reassessing current risk management strategies for these compound events. It also suggests incorporating the sequences of drought and heatwaves into compound event analysis frameworks “to enhance climate risk management”.
Cerezo-Mota says that it is clear that the world needs to be prepared for the increased occurrence of these events. She tells Carbon Brief:
“These [risk assessments and strategies] need to be carried out at the local level to understand the complexities of each region.”