

China’s carbon dioxide (CO2) emissions fell by 1% in the second quarter of 2026, as oil consumption plummeted amid the strait of Hormuz crisis.
The country’s use of oil fell by 9% overall and by 16% for transport, after the disruptions to supply from the Gulf through the strait.
This guest post is by:
Lauri Myllyvirta, lead analyst at the Centre for Research on Energy and Clean Air
China’s total CO2 emissions fell despite a continued rebound in coal-fired power generation.
This is the first time that reductions in oil consumption have been responsible for a fall in CO2 emissions overall – in all previous cases, coal consumption has been the main driver.
Other key findings for the second quarter of 2026 include:
- Electric vehicles (EVs) and public transport have become key factors in China’s oil demand, enabling transportation levels to increase even as fuel use fell sharply.
- The effect of EVs on oil consumption was almost twice as large as would be expected based on the increase in the number of EVs on the road alone, as the usage of existing EVs surged.
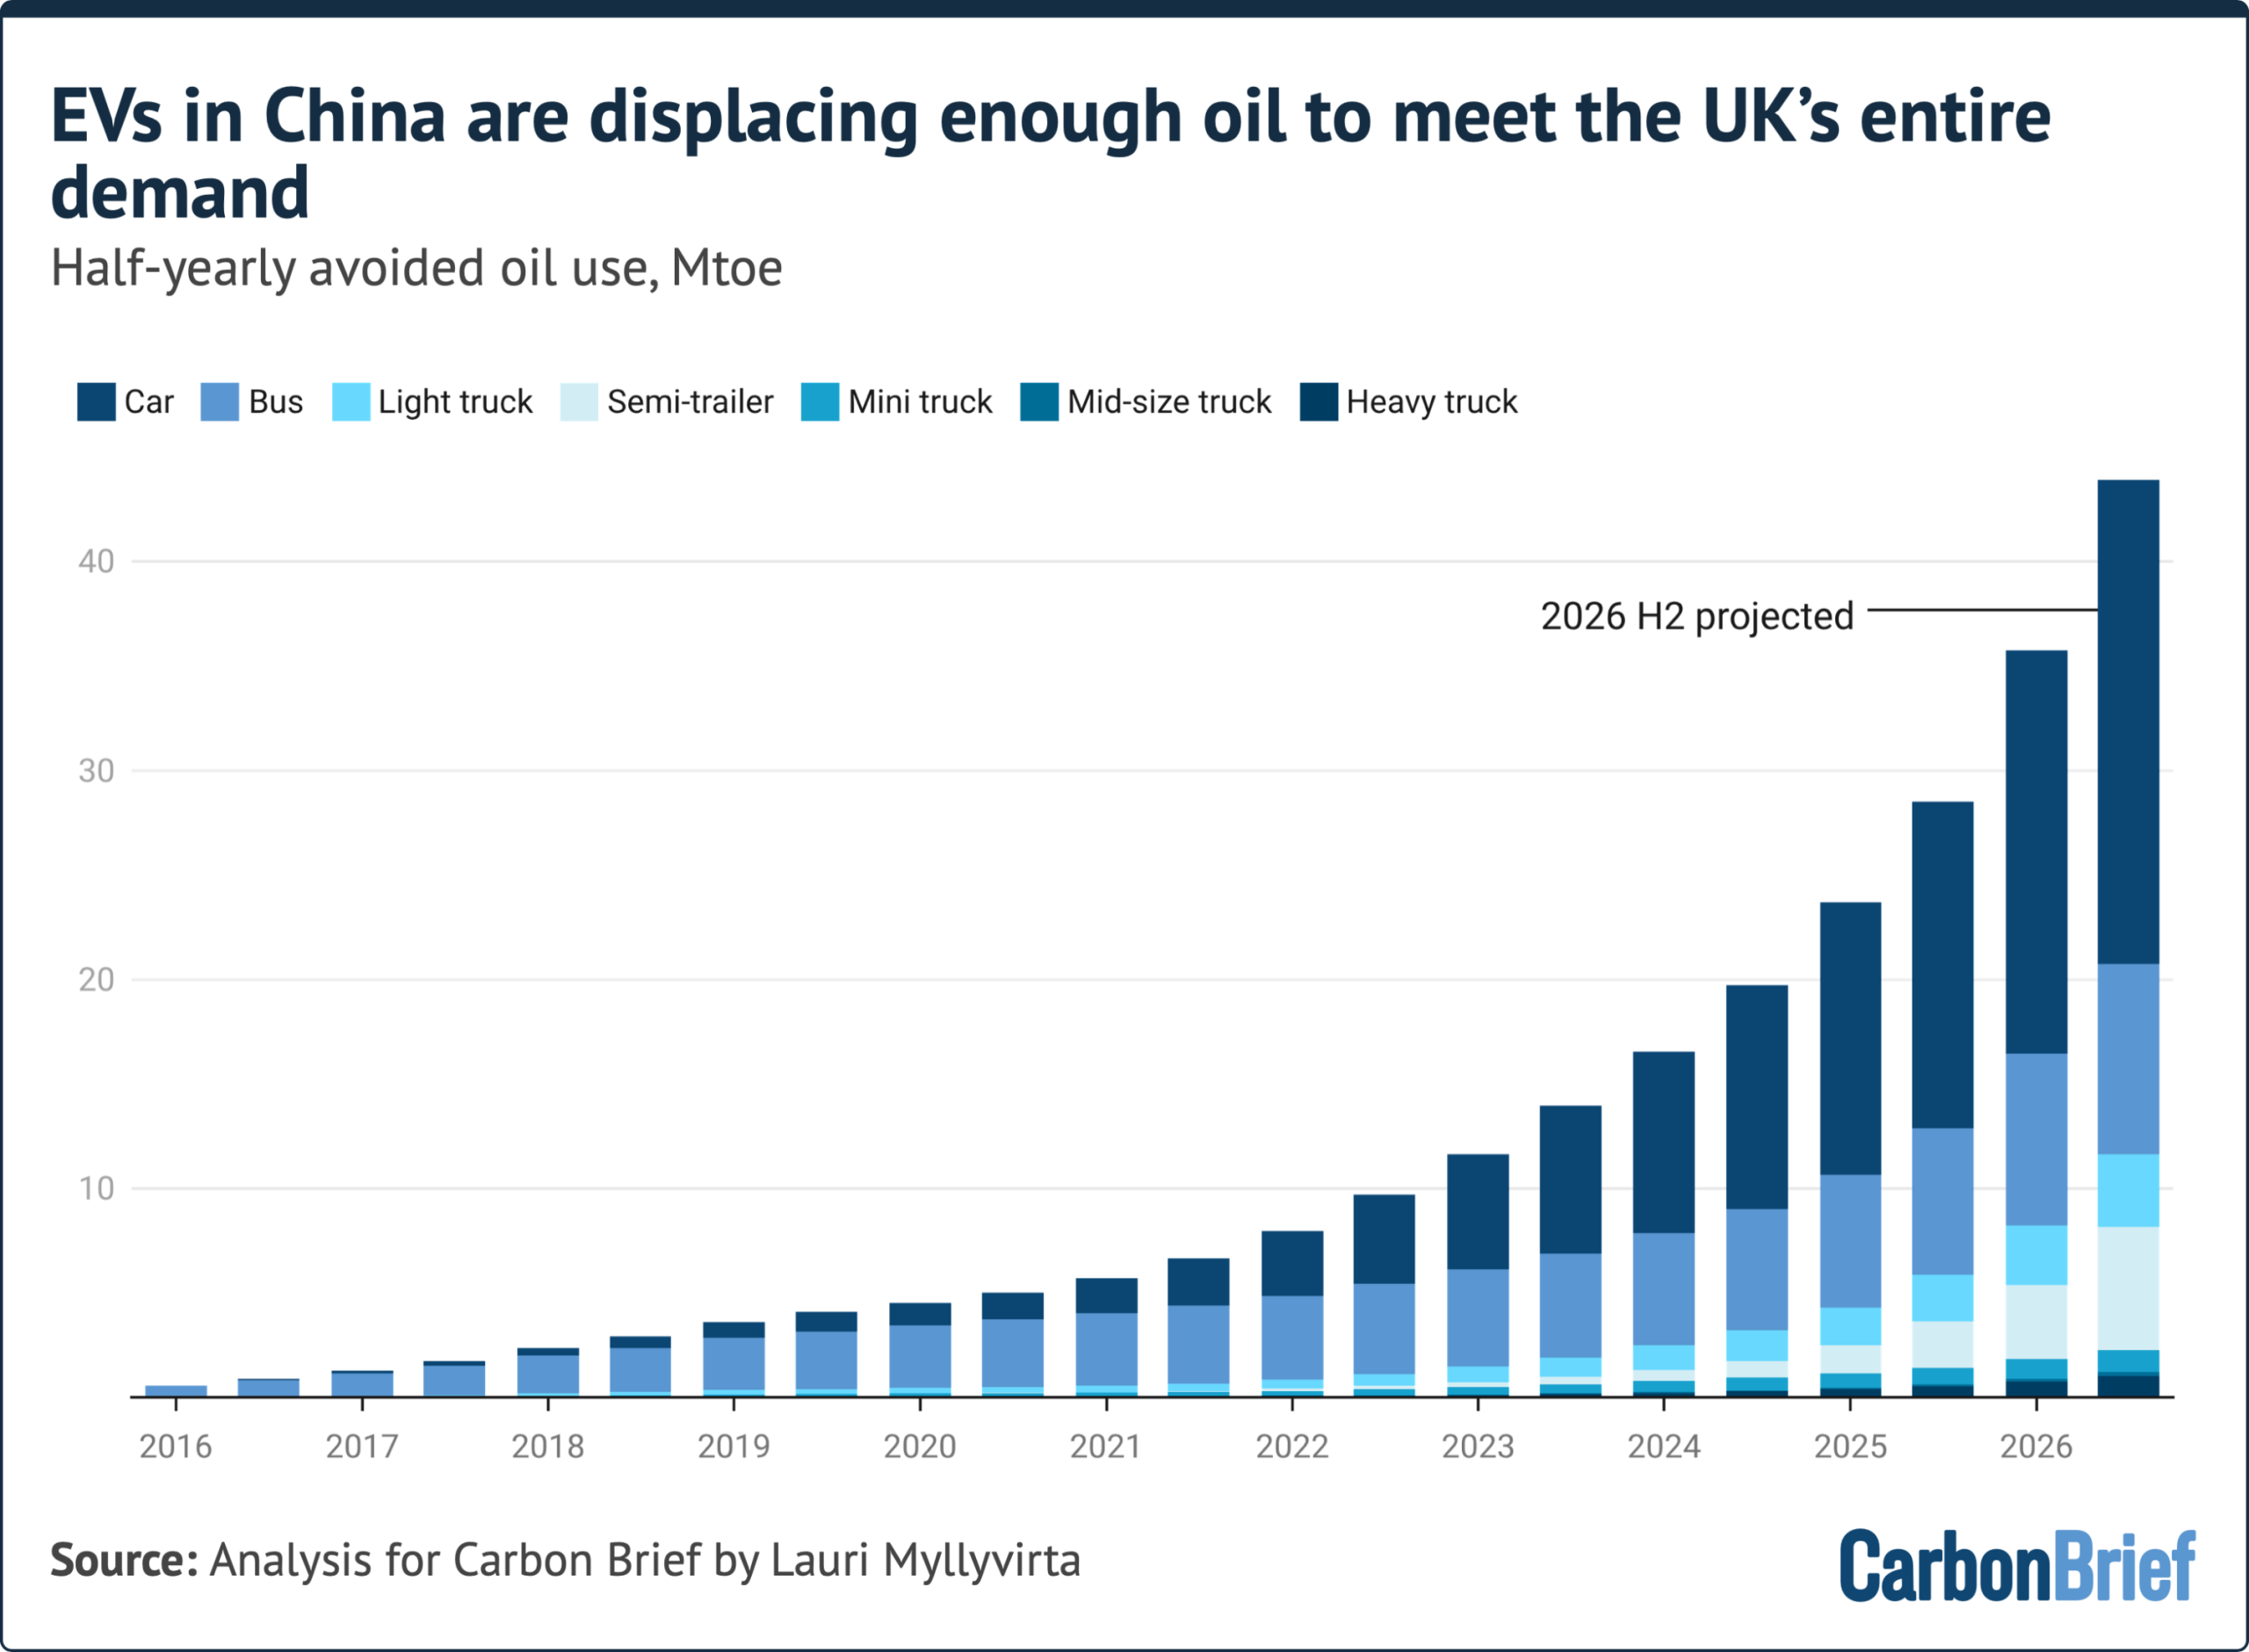
- Oil consumption displaced by EVs in China in the first half of 2026 exceeded the UK’s total oil consumption over a six-month period.
- These structural factors are not sufficient to account for the size of the fall in oil consumption, leaving behaviour changes as the other explanation.
- “Curtailment” of solar and wind output caused coal power to rise, despite strong hydro output, solar and wind capacity growth, as well as slower demand growth.
- Major increases in coal-power capacity and a power market that continues to favour coal limited the amount of coal generation displaced by new wind and solar capacity.
- Defying expectations of a boom, annual growth in coal use for chemicals production slowed down to 8%, from 15% in 2025 and 19% in the first quarter.
The second quarter of 2026 was a busy time for China’s government planners, with numerous energy-related five-year plan documents being released.
These plans list new measures to address solar and wind curtailment, as well as signalling a higher bar for the approval of new coal-power plants, but add few new quantitative targets.
After a 2% increase in the first quarter of 2026 and a 1% decline in the second, emissions are up marginally across the first half of the year, but they remain below their peak in 2023-24.
In addition, China is on track to add enough wind, solar, nuclear and hydropower this year to cover electricity demand growth, despite a slowdown in new capacity.
Given the structural pressures on oil demand, continued declines in real-estate construction and slower growth for coal-chemicals, China’s emissions could still fall this year. The emission trend remains a race between energy demand growth and clean-energy growth, both of which have slowed down this year.
Emissions still flat
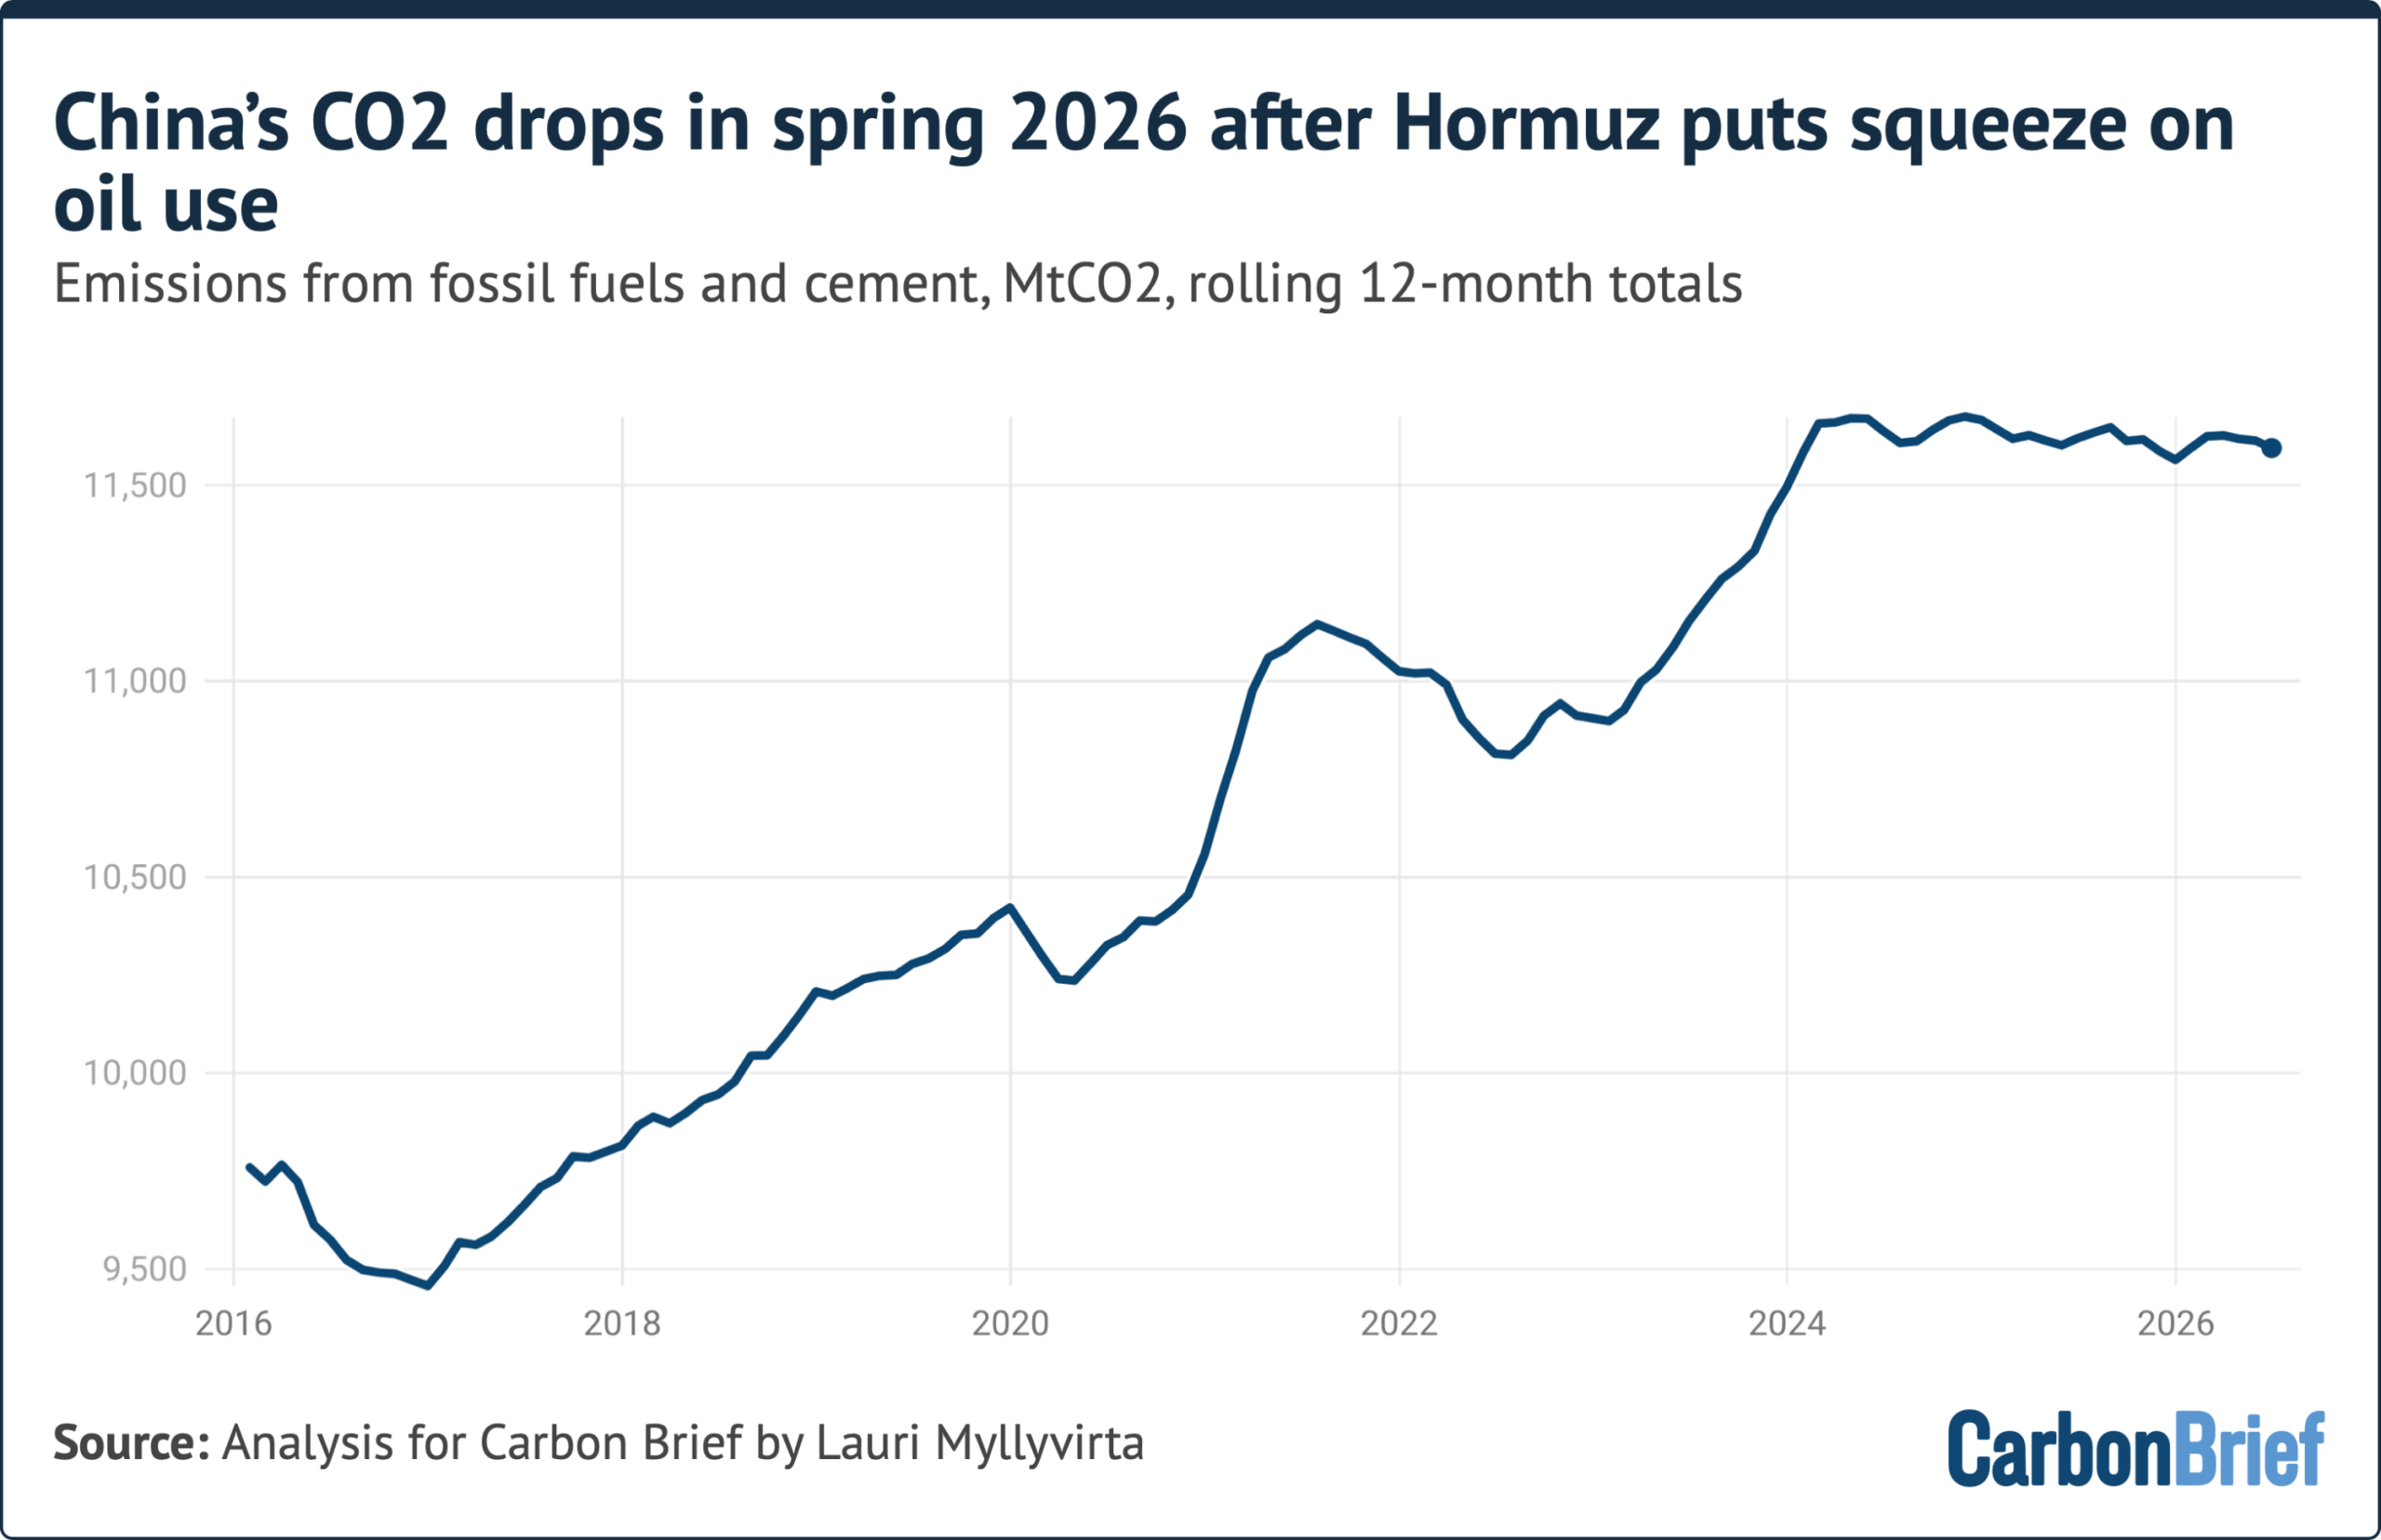
There has now been a plateau in China’s CO2 emissions from fossil fuels and cement for more than two years, following a peak in March 2024.
Previous analysis for Carbon Brief described this as a “flat or falling” trend, which extended until the end of 2025. There was then a 2% increase in emissions year-on-year in the first quarter of 2026, resulting from a rise in the amount of “wasted” wind and solar power.
The latest analysis shows that this was followed by another decline in the second quarter of this year, when China’s emissions fell by 1%, as shown in the figure below.
For further details see: About the data.
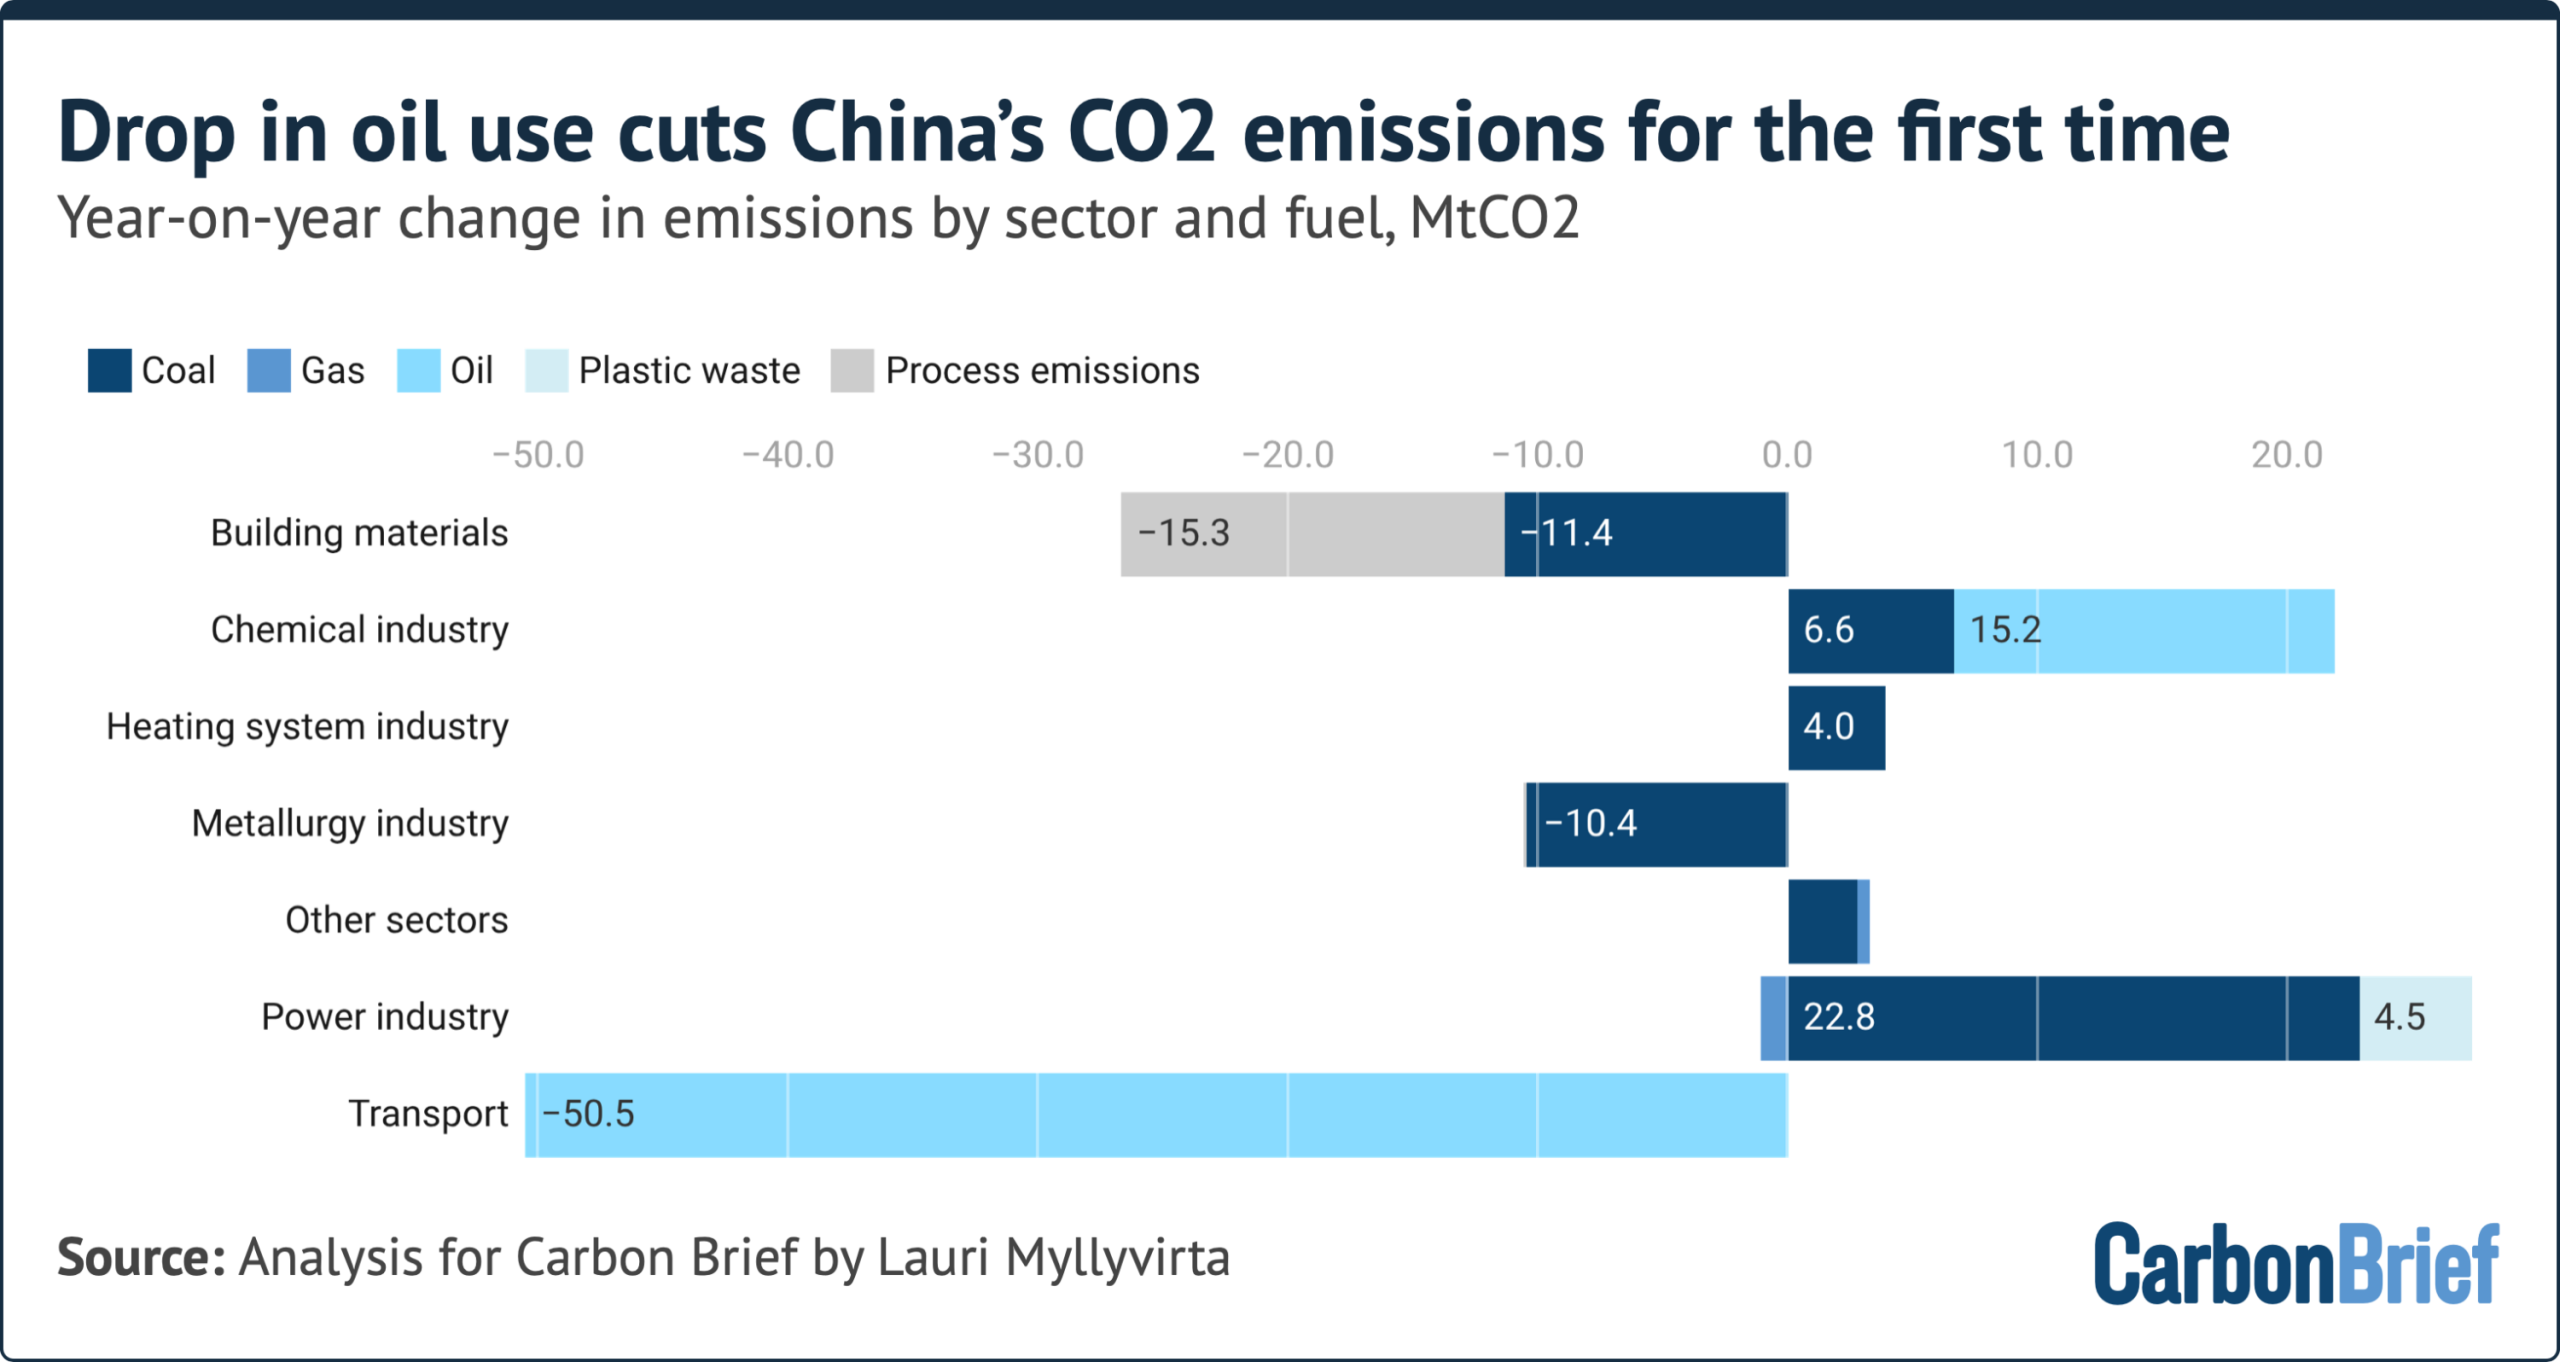
Notably, China’s emissions fell in the second quarter despite an increase in coal use. For the first time ever, a drop in oil use was sufficient to drive a decline in emissions overall.
Oil use plummeted while coal grew
Within the overall 1% decline in China’s emissions in the second quarter of 2026, there were divergent trends when looking sector by sector and fuel by fuel.
The largest fall in CO2 emissions came from the consumption of petrol, diesel and jet fuel, with oil consumption in industry also falling, as shown in the figure below.
For further details see: About the data.
Crude oil processing volumes fell 11% in the second quarter, but some of the fall was absorbed by drawing down oil product inventories, with Sinopec sales down 9%.
In total, China cut back oil imports by 32% in the second quarter. The million–barrel question has been how much of this was enabled by genuine reductions in oil consumption and how much by the drawdown of the country’s vast oil stockpile.
Energy mix numbers reported by the National Bureau of Statistics indicate that oil consumption fell by 3% in the first half of the year and around 9% in the second quarter. This shows that reduced consumption played a substantial role, while still leaving 60% of the fall in imports to be covered by the swing from building stockpiles to using them.
The sector with the largest increase in emissions during the second quarter of the year was power, where coal use grew 2.4% while gas-fired generation fell 1.2%. This was despite strong growth in wind and solar capacity over the preceding year, a significant rebound in hydropower generation, a small increase in nuclear power output and a slowdown in electricity consumption growth.
The explanation for the rise in emissions was – similar to the first quarter of 2026 – an increased amount of solar and wind generation being “wasted” due to the power market and grid not being adapted to increasing shares of variable renewable generation.
In other sectors, there was a fall in cement production, driven by falling construction volumes, which accelerated to 9% in the second quarter, from 8% in the first quarter. Crude steel output fell by 1% and pig-iron production by 3% in the second quarter.
Growth of coal use for chemical production slowed down in the second quarter, both compared with the previous quarter and the last year.
The rate of utilisation of installed coal processing capacity was already high before the current oil shock, so there was no headroom for production to increase even though rising oil prices made coal-chemicals more profitable. Oil-based chemical production also kept growing, with ethylene output up 17% and primary plastics production flat.
Coal use for heating continued to increase, with the sector’s coal consumption in the second quarter dominated by industrial heat, as there is little need for space heating at this time of year. Growth has continued despite the prominent drive for “zero-carbon industrial parks”, demonstrating the importance of the initiative for tackling industrial coal use.
What drove the fall in oil consumption?
The dramatic fall in China’s demand for oil imports during the Hormuz crisis has been widely hailed as the most important price stabilising factor for the global oil market.
To understand the implications for China’s oil consumption and CO2 emissions going forward, it is important to unpack what enabled this reduction in imports.
A significant contribution comes from ongoing, structural reductions in transport oil demand driven by electrification. Sinopec had forecast 6% and 5% drops in diesel and petrol consumption this year, respectively, already before the start of the war on Iran. Actual sales fell 9% in the first half of the year.
Transportation levels show a slowdown in growth, but no outright decline. Cross-regional passenger trips were 0.1% higher year-on-year in the second quarter, while urban passenger trips were 2.9% higher. Commercial freight tonnage increased 2.4%.
The exception is air travel, where passenger numbers fell 7% in May-June, after 7% growth in the first quarter. However, this sector plays a minor role in overall transport oil consumption in China.
The stable or growing transportation levels show that the shift to electric vehicles, rail, public transport and other clean transportation, rather than a fall in mobility, played the key role in reducing oil consumption.
The rise in fuel prices that accompanied the Hormuz crisis only accelerated the structural shifts in transportation that were already underway.
Electric heavy-truck sales rose about 77% in the second quarter, year-on-year, with June sales more than doubling and the market share of electric trucks exceeding 45% of all new sales.
The total number of EVs on the road at the end of the quarter grew 33% year-on-year. Some 12.1m EVs were added, of which 8.1m were electric-only battery EVs.
EV usage saw even more of a shift. Charging volumes increased 60% in the second quarter, indicating that EVs already on the road were utilised much more than before, at the expense of petrol and diesel vehicles, with plug-in hybrid drivers likely favouring electricity over fuel.
One factor enabling EV utilisation to grow was the increased use of electric taxis. Intense competition in the sector has pushed prices down at the same time as the use of private petrol vehicles has become more expensive.
Stronger subway and rail use also made a contribution. Rail-passenger traffic increased 5% in the first half of the year.
The fall in diesel demand has been particularly pronounced in the construction and mining sectors. The heavy machinery in the sectors is well-suited for electrification, in addition to which construction levels are also falling.
Based on reported growth in charging volumes, EVs helped avoid an estimated 19m tonnes of oil consumption (Mtoe) in the second quarter, up 50% year-on-year.
This took the total amount of oil displaced by EVs to 36 Mtoe in the first half of the year, as shown in the figure below, well exceeding, say, the total oil consumption of the UK over six months. Notably, trucks are the fastest-growing source of oil displacement, with avoided fuel use up 90% year-on-year in the first half of 2026.
For further details see: About the data.
The increase in avoided oil consumption due to EVs is equal to 4.5% of China’s oil imports in the same period in 2025. If EV sales and charging volumes continue their growth at the same rates in the second half of the year, avoided oil consumption will reach 80 mn tonnes, equal to the consumption of Mexico.
Estimated emissions avoided are 35 MtCO2, or 1.3% of China’s total CO2 emissions in the second quarter, after taking into account emissions from power generation for vehicle charging.
While the amount of oil displaced by the shift to EVs is significant – and is rising fast – the year-on-year increase in displaced oil still only accounts for a third of the drop in China’s oil consumption in the first half of the year, with the fall in consumption only accounting for half of the drop in imports. The remaining reduction is due to the shift from building to drawing down stockpiles, slower growth in chemical industry output, as well as behavioral adaptations by consumers and operational adaptations by businesses.
Coal power continued to rise despite clean-capacity growth
China saw record increases in solar and wind capacity over the past year. In addition, hydropower generation increased 9% in the second quarter of the year, compared with the same period in 2025, and there was a small 2% increase in nuclear-power output.
At the same time, the rate of power demand growth slowed down from 5.9% in the second quarter of 2025 to 5.2% in the same period in 2026.
Yet, power-sector emissions increased 3.0% in the first half of 2026, after falling 3.2% in the first half of 2025. Power generation from fossil fuels rose because of an increase in the amount of potential solar and wind generation that was wasted, as well as exceptionally poor wind conditions. Without those factors, coal-fired power generation and power-sector emissions would also have fallen in 2026.
Wind-power capacity has continued strong growth in 2026, with capacity additions in both the first and the second quarter of the year comfortably exceeding those in any year other than the record-setting 2025.
Solar power additions have slowed sharply from the rates seen in 2025, even falling behind 2024. Yet, they are in line with 2023, when more than 200 gigawatts (GW) was added by year-end.
Nuclear power development continues at pace, with eight new reactors approved in July and five reactors with 4.5GW total capacity expected to enter commercial operation this year. This includes China’s second commercial small modular reactor, Linglong One, with new policies paving the way for further development.
Reactor commissioning will pick up further next year: the government has approved 10 new reactor projects every year since 2022 and those projects will begin to come online. Meanwhile, 3GW of conventional hydropower was added, with a total of 6GW of projects targeting operation in 2026.
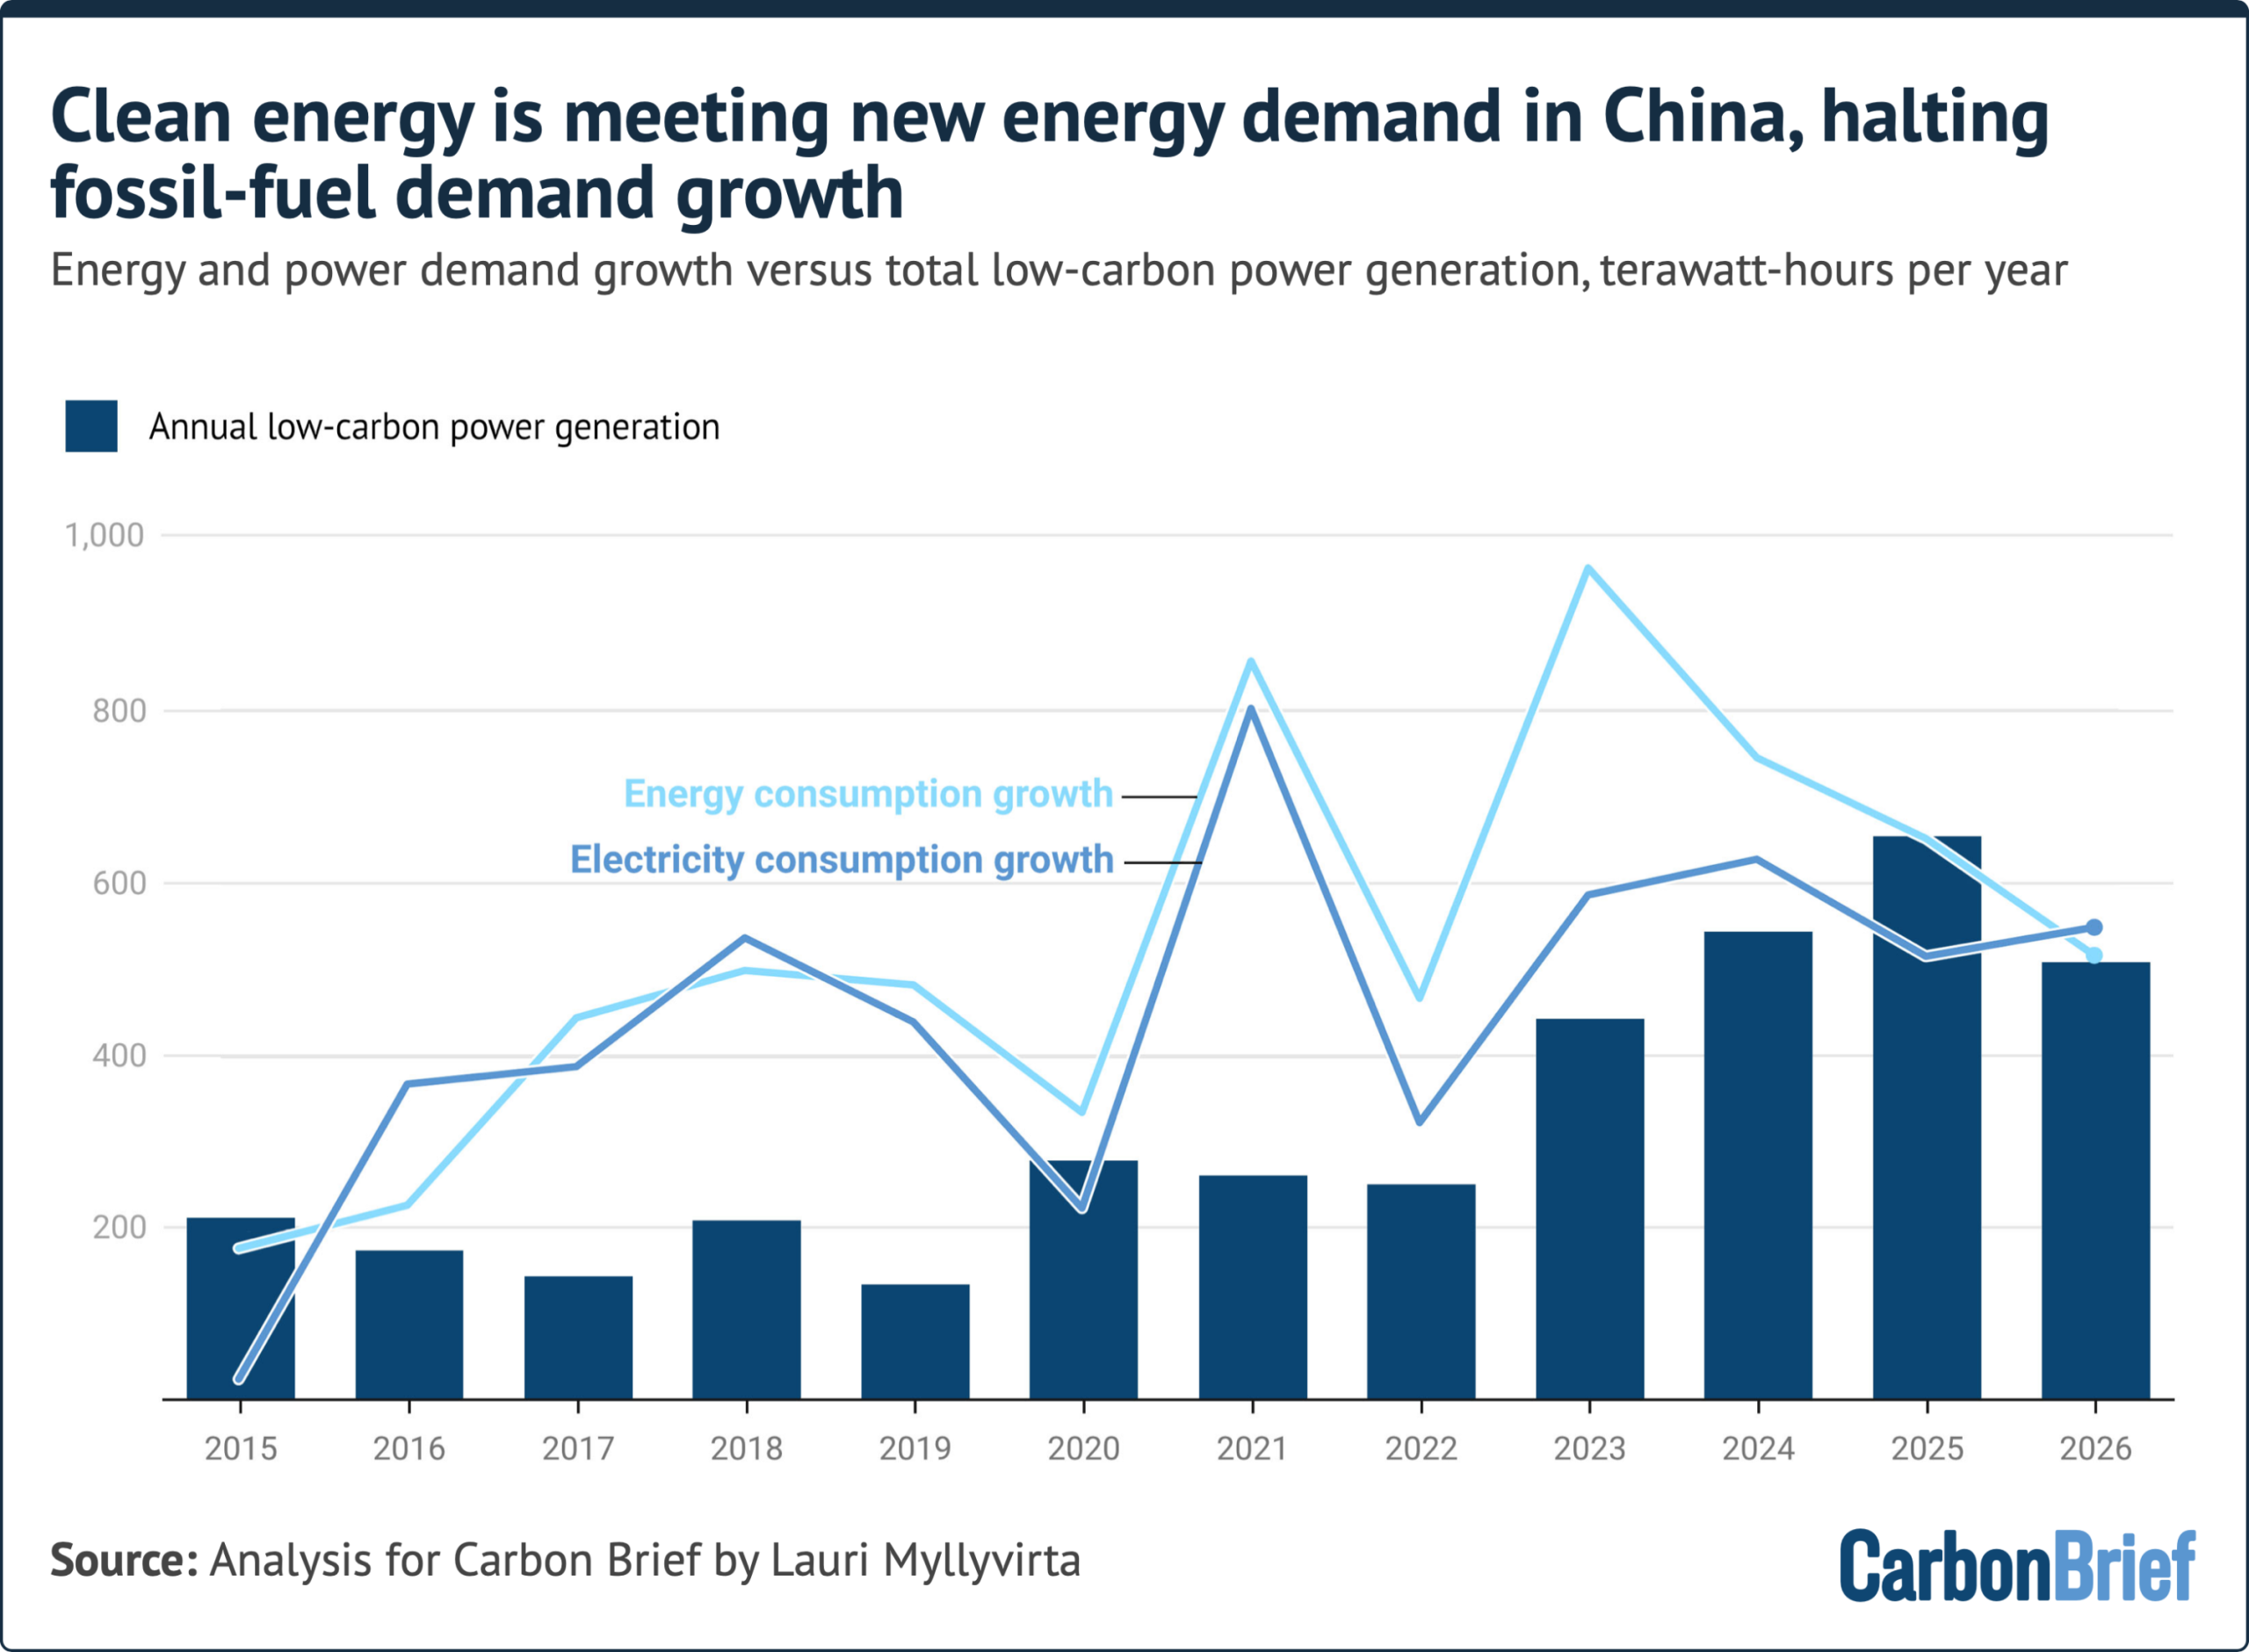
Taken together, this clean-energy growth puts China on track to add enough non-fossil generating capacity in 2026 to cover electricity demand growth of up to 5%, despite the slowdown in solar.
Power demand grew 5.3% in the first six months of 2026 and the energy regulator projects 5-6% for the whole year. This means that the increase in power-sector emissions seen in the first half would be reversed, once the obstacles to solar and wind sending their output to the grid are addressed – and once wind conditions revert to average levels.
Moreover, total energy demand growth has slowed down much more sharply than electricity demand, making it more feasible for clean-power generation growth to significantly exceed the increase in total energy consumption and to drive down fossil-fuel consumption.
For further details see: About the data.
The key reason for solar and wind curtailment in China is that neither the power-grid operating model nor the electricity market model require – or encourage – the flexible operation of coal-power plants, hydropower plants and inter-provincial transmission lines.
This situation has been exacerbated by a wave of new coal-power plants entering operation, with newly added capacity reaching 30GW in the first half of 2026, the highest level since 2016. Another 25GW started construction, while less than 3GW was retired.
The electricity prices paid to coal-fired generators are fixed months in advance, as are the volumes of electricity that will be transmitted through long-distance power lines.
This removes the incentive for plants to adjust their output in response to conditions. This could include variations in solar and wind supply, or changes in power demand.
As a result, there is limited ability for the grid to absorb variable renewable power. Furthermore, coal plants are entitled to “capacity payments”, which require them to be available to generate, but do not reward them for operating flexibly.
One solution to integrate more solar and wind into the grid is increasing energy storage capacity. Battery storage capacity continued to grow, with 17GW added in the first half of 2026, bringing total installed capacity to 153GW. This represents a slowdown in storage additions, however, down from 23GW in the first half of 2025.
Outlook for China’s CO2 emissions
The key developments affecting the outlook for China’s emissions in the second quarter include the effects of the Hormuz oil-and-gas crisis, the release of a long list of sectoral five-year plans and a slowdown in energy consumption growth.
The rise in oil prices has caused a stronger shift in China’s transportation sector than anyone anticipated, with EV deployment and use accelerating from an already high base. This trend is unlikely to be reversed. It has also proven the value of electrification to China’s energy security strategy.
The government is targeting a slight acceleration in the pace of electrification, aiming for electricity to make up 35% of energy end-use by 2030, up from 30% in 2025. This is a larger increase than achieved over the past five years, when the share of electricity rose from 26.5% in 2020 to 30% by 2025. The transportation sector plays a significant role in this, with a target for EVs to make up 30% of the vehicle fleet, up from 12% in 2025, and 25% of commercial vehicles.
Electrification both reduces emissions immediately and sets different sectors up for deep decarbonisation as electricity is much easier to produce without CO2 emissions than fuels. Faster transport sector electrification lowers the outlook for oil demand, increases the role of the sector in peaking and reducing emissions, plus means that more of China’s clean energy growth ends up displacing oil.
While transport emissions fell, power-sector emissions continued to rebound for the second quarter in a row. The increased coal-fired power generation and emissions can be attributed to increased solar and wind curtailment. Curtailment has emerged as the key obstacle to both continued rapid solar and wind capacity growth and full utilisation of existing capacity.
Several sectoral five-year plans published in recent months have laid out measures to improve solar and wind utilisation.
Long-distance transmission will continue to expand, helping to move wind and solar generation from remote “energy bases” to centres of demand. There is also a growing emphasis on local consumption of clean power. The power sector five-year plan, published in August, promotes direct purchases of clean electricity, smart microgrids, zero-carbon industrial parks and closer coordination between renewable resources and AI computing infrastructure
Yet the same plan further loosened the limits on the amount of wind and solar that can be curtailed.
The limit for curtailment was 5%, until it was relaxed to 10% in 2024 in provinces with good wind and solar resources. The new plan allows the limit to be increased further to 15% for some provinces, while keeping it at 5% and 10% for others.
Looking at the 2025 data on reported curtailment, very few provinces had higher rates than 15% – only Tibet for wind and Qinghai and Tibet for solar.
Unless the most lenient limit is only applied to those two provinces, it means the plan would allow for higher levels of curtailment.
This is also true of the national average target of “around” 10% curtailment, given reported rates in 2025 were 94% and 95% for wind and solar, respectively.
Notably, monthly data on curtailment has not been published in recent months, raising the possibility that the indicator is being revised. Reported data has understated actual curtailment by a wide margin, compared to implied curtailment.
If the curtailment indicator is revised, such that it captures more of the actual curtailment, then this could make the headline targets stronger than they appear, in comparison to previously reported numbers.
The new five-year plans also lowered the overall level of ambition on coal use. Chinese president Xi Jinping announced in 2021 that China would “gradually reduce coal consumption during the 15th five-year period”, covering 2026-30. However, the target now is for coal consumption to “enter a plateau” during those five years.
The five-year plans call for “reasonably controlling coal-power capacity and generation”, signaling a higher bar for the approval for new coal-power projects, after the government’s active promotion of new coal power in recent years. This could also imply more retirements of older coal plants. However, there is 204GW of coal-power capacity under construction, even after the wave of new coal-power plants starting operation in 2025 and in the first half of 2026, making the implementation of the “reasonable control” more challenging.
It is the first time that the government has vowed to control “coal-power generation” and not just “generation growth”, as the energy regulator did in 2021, but the significance of that distinction is unclear.
The renewable energy five-year plan also broadens the concept of system reliability, which was a key justification for new coal power during the previous five years. Rather than relying primarily on coal-fired power for system stability, it increasingly looks to other options.
Alternatives include storage, flexible demand, EVs, “virtual power plants” and smarter system operation to provide balancing services. The plan also puts an emphasis on increasing the contribution of renewable energy to meeting demand peaks.
Therefore, while coal remains an important backup resource in the plan, reliability is no longer framed as something that can only be provided by coal.
The Chinese government has published numerous other sectoral five-year plans since its overarching plan came out in March. These include plans for the energy sector (“new-type energy system”), power system, renewable energy, carbon peaking, coal, climate-change mitigation, and the environment (“Beautiful China”). Some clear priorities emerge from these plans: electrification, electric vehicles, energy storage, offshore wind and “green”” fuels.
The energy plan also substantially increased ambition on the development of conventional hydropower, despite ecological and social risks and potential for tensions with neighbouring countries. The capacity additions will largely only materialise after 2030, however.
At the same time, energy consumption growth has slowed down markedly after the surge during and immediately after the “zero-Covid” period, making it more feasible for clean energy to meet all incremental demand.
If this trend continues, then total CO2 emissions will begin to fall even as power-sector emissions continue to plateau.
About the data
Data for the analysis was compiled from the National Bureau of Statistics of China, National Energy Administration of China, China Electricity Council and China Customs official data releases, as well as from industry data provider WIND Information and from Sinopec, China’s largest oil refiner.
Electricity generation from wind and solar, along with thermal power breakdown by fuel, was calculated by multiplying power generating capacity at the end of each month by monthly utilisation, using data reported by China Electricity Council through Wind Financial Terminal.
Total generation from thermal power and generation from hydropower and nuclear power were taken from National Bureau of Statistics monthly releases.
Total primary energy consumption is converted to the electricity equivalent using the substitution method.
Monthly utilisation data was not available for biomass, so the annual average of 52% for 2023 was applied. Power-sector coal consumption was estimated based on power generation from coal and the average heat rate of coal-fired power plants during each month, to avoid the issue with official coal consumption numbers affecting recent data.
CO2 emissions estimates are based on National Bureau of Statistics default calorific values of fuels and emissions factors from China’s latest national greenhouse gas emissions inventory, for the year 2021. The CO2 emissions factor for cement is based on annual estimates up to 2024.
For oil, total oil consumption is calculated based on energy mix data for the first quarter and first half of the year released by the National Bureau of Statistics. Consumption of transport fuels – diesel, petrol and jet fuel – is estimated based on the sales growth reported by Sinopec for the first quarter and the first half of the year, with monthly disaggregation based on production minus net exports. The consumption of these three fuels is labeled as oil product consumption in transportation, as it is the dominant sector for their use. Apparent consumption of other oil products is calculated as the residual.
Estimated non-energy use of fossil fuels is subtracted from total chemical industry fossil fuel consumption, and process emissions are calculated based on fossil fuel consumption with carbon retained in products subtracted. Emissions from the incineration of plastics are based on a peer-reviewed estimate of plastics incineration in 2022, combined with growth rates in the overall power generation from waste-to-energy plants. Metals industry process emissions are calculated using industrial output data and IPCC default emission factors.
Oil consumption displaced by EVs is estimated using China Association of Automobile Manufacturers’ sales data, via Wind Financial Terminal. The data breaks down vehicle sales by type and powertrain: passenger cars, buses, vans, semis and trucks of different sizes, each split into battery-electric and plug-in hybrid, with assumptions about how far each vehicle type is driven per year and the fuel economy of the conventional vehicle it replaces.
Annual mileage and fuel-consumption assumptions are compiled from different sources, including the International Council on Clean Transportation. Each electric vehicle sol