

The UK’s greenhouse gas emissions fell by 5.7% in 2023 to their lowest level since 1879, according to new Carbon Brief analysis.
The last time UK emissions were this low, Queen Victoria was on the throne, Benjamin Disraeli was prime minister, Mosley Street in Newcastle became the first road in the world with electric lighting and 59 people died in the Tay Bridge disaster in Dundee.
Carbon Brief’s analysis, based on preliminary government energy data, shows emissions fell to just 383m tonnes of carbon dioxide equivalent (MtCO2e) in 2023. This is the first time they have dropped below 400MtCO2e since Victorian times.
Other key findings from the analysis include:
- The UK’s emissions are now 53% below 1990 levels, while GDP has grown by 82%.
- The drop in emissions in 2023 was largely due to an 11% fall in gas demand. This was due to higher electricity imports after the French nuclear fleet recovered, above-average temperatures and weak underlying demand driven by high prices.
- Gas demand would have fallen even faster, but for a 15% fall in UK nuclear output.
- Coal use fell by 23% in 2023 to its lowest level since the 1730s, as all but one of the UK’s remaining coal-fired power stations closed down.
- Transport was the single-largest sector in terms of emissions, followed by buildings industry, agriculture and electricity generation. The electricity sector likely dropped below agriculture for the first time.
While the 23MtCO2e reduction in 2023 was faster than the 14MtCO2e per year average needed to reach net-zero by 2050, it was mostly unrelated to deliberate climate action. The UK will need to address emissions from buildings, transport, industry and agriculture to reach its 2050 target.
The analysis is the latest in a long-running series of annual estimates from Carbon Brief, covering emissions during 2022, 2020, 2019, 2018, 2017, 2016, 2015 and 2014.
Lowest since 1879
The UK’s territorial greenhouse gas emissions – those that occur within the country’s borders – have now fallen in 25 of the 34 years since 1990.
(Consumption-based emissions, including CO2 embedded in imported goods and services, were increasing until 2007, but have since fallen at a similar rate to territorial emissions.)
Apart from brief rebounds after the global financial crisis and the Covid-19 lockdowns, UK emissions have fallen during every year for the past two decades.
The latest 23MtCO2e (5.7%) reduction in 2023 takes UK emissions down to 383MtCO2e, according to Carbon Brief’s new analysis.
This is the lowest since 1879 – outside the 1926 general strike – as shown in the figure below.

Having dropped to a then-record low for the modern era of 404MtCO2e during the height of Covid in 2020, UK emissions bounced back in 2021 as the economy reopened.
While emissions declined in 2022, they remained above 2020 levels. In 2023, however, emissions fell below the lows seen during Covid lockdowns, to levels not seen since Victorian times.
Accidental action
The biggest contributor to the drop in UK greenhouse gas emissions in 2023 was an 11% reduction in gas demand, which accounted for around two-thirds of last year’s overall decline. This took the UK’s gas demand to its lowest level since the 1980s.
However, the drop in 2023 was not primarily due to deliberate climate action.
The figure below shows the estimated actual drop in emissions in red, followed by contributions from a series of factors that decreased emissions, in blue, and other factors in grey.
The most significant factor was the UK returning to its long-term position as a net electricity importer in 2023, reducing demand for domestically generated power from gas by more than 20%.
This followed an anomalous year in 2022, when the UK was a net exporter for the first time ever, as a result of widespread outages in the French nuclear fleet.
Lower demand for gas power accounted for more than two-thirds of the fall in gas use overall.
Next, above-average temperatures reduced the need for heating, while continuing very high prices since Russia’s invasion of Ukraine caused weak underlying demand for gas.
Reflecting both of these factors, there was a 6% drop in domestic demand in 2023, accounting for a fifth of the overall decline in gas consumption. A similar 7% drop in commercial demand for gas accounted for another tenth of the total, with a 5% drop in industrial demand the remainder.
Finally, the figure shows that there was a small reduction in gas demand and associated CO2 emissions as a result of increased wind and solar generation.
The impact of rising wind and solar capacity in 2023 was muted by average windspeeds being below average and the average number of sun hours falling sharply compared with 2022.

The UK’s emissions would have fallen even further in 2023 if not for a 15% decline in the output of the nation’s nuclear fleet. This followed the closure in 2022, of the Hunterston B station in Scotland and the Hinkley Point B plant in Somerset, as well as maintenance outages.
The decline in 2023 means UK nuclear output fell to the lowest level since the early 1980s. Following the site closures in 2022, the UK only has five operational nuclear power plants remaining, all but one of which – Sizewell B in Suffolk – are due to close this decade.
Out of coal
After gas, the next-largest driver of falling UK emissions in 2023 was coal, accounting for around 14% of the overall drop in emissions.
The decline of coal use in the UK – for homes, railways, factories and power stations – is a major part of the long-term reduction in greenhouse gas emissions over the past 30 years.
Factors in this long-term decline include controls on domestic coal burning to limit air pollution, the end of steam railways, the shift from coal-based “town gas” to “natural” gas from the North Sea, the deindustrialisation of the 1970s and the “dash for gas” of the 1990s.
More recently, coal demand has dropped precipitously as the rapid build-out of renewable sources of electricity has combined with falling demand and carbon pricing that favours gas.
The figure below shows how UK coal demand surged during the industrial revolution before levelling off through the 20th century, barring general strikes in 1921 and 1926.
Coal demand has been falling steadily since the passage of the Clean Air Act in 1956, in response to London’s “great smog” of 1952. In 2023, UK coal demand fell by another 23% to the lowest level since the 1730s, when George II was on the throne and Robert Walpole was prime minister.

The recent reduction of coal demand is largely down to the demise of coal power, which made up around 40% of the UK’s electricity generation as recently as 2012. Coal power output has fallen by 97% over the past decade, accounting for 87% of the fall in UK coal demand overall.
In 2023, only 1% of the UK’s electricity came from coal, with three coal-fired plants closing down: the coal units at Drax in Yorkshire; Kilroot in Northern Ireland; and West Burton A in Lincolnshire.
As of the start of October 2023, only one coal plant remains – the Ratcliffe-on-Soar site in Nottinghamshire. Operator Uniper plans to close Ratcliffe in September 2024, ahead of the government’s deadline to end coal power by October 2024.
Sectoral shifts
The reductions in gas use for power and building heat, as well as the fall in coal use for power, further cemented the transport sector as the largest contributor to UK emissions in 2023.
This is shown in the figure below, which highlights how transport emissions have barely changed over the past several decades as more efficient cars have been offset by increased traffic.
The power sector was the largest contributor to the UK’s emissions until 2014. In 2023, it was likely only the fifth-largest below transport, buildings, industry and – for the first time – also agriculture.

As of 2023, transport emissions were only around 10% below 1990 levels and made up nearly a third of the UK’s overall total. There are now more than a million electric vehicles (EVs) on the UK’s road, which will have avoided around 2MtCO2e of annual emissions.
However, the government has also frozen or cut fuel duty every year since 2010, rather than increasing it in line with inflation, adding up to around 20MtCO2e to the UK’s total.
Emissions from buildings – chiefly for heating and cooling – are the second-largest contributor to the UK’s emissions, accounting for around a fifth of the total.
They were around one-third lower than 1990 levels in 2023, with improved insulation and boiler regulations making the UK’s buildings more efficient to heat.
Efficiency improvements dried up around a decade ago and the fall in building emissions since 2021 has been driven by high prices suppressing demand, rather than deliberate policy choices.
Industrial emissions made up an estimated tenth of the UK’s total in 2023, having fallen by two-thirds since 1990 and by a quarter in the past decade.
In common with many other developed economies, the UK shifted from heavy industry towards advanced manufacturing and services from the 1970s onwards. However, industrial energy efficiency improvements and a shift to lower-carbon fuels are also part of the picture.
Agricultural emissions have barely changed for decades, making up just over a tenth of the UK’s total in 2023 and having fallen just 12% since 1990 as livestock herds have shrunk.
There was a small decrease in farm emissions in 2022 as the energy crisis filtered through into surging prices for fertilisers. For the figure above, Carbon Brief assumes the reduced fertiliser use in 2022 continued in 2023, as fertiliser prices only eased in summer 2023.
Decoupling emissions
The drop in UK emissions in 2023 came as the economy flatlined, growing by just 0.4% on 2022 levels. The UK’s emissions are now 53% below 1990 levels while the economy has grown 82%.
This “decoupling” of emissions from economic growth is shown in the figure below. As noted above, this analysis is based on territorial emissions within the UK’s borders.
Consumption-based emissions including imported goods and services were climbing in the early part of this century. However, emissions cuts over the past two decades have been very largely driven by sectors that cannot easily be “outsourced”, particularly power and building heat.

The UK is now in a mild recession and the economy is only expected to grow by around 1% in 2024. Recent trends in the “emissions intensity” of the UK economy – the emissions per unit of GDP – and weak economic growth suggests that emissions could continue to fall in 2024.
On the other hand, gas and oil prices are easing to pre-crisis levels, while above-average temperatures may not continue for another year. Petrol demand rose by nearly 5% in 2023 as traffic continued to rebound from the pandemic – and jet fuel use similarly climbed by 16%.
Moreover, the one-off impact of the UK returning to net electricity imports has now unwound. As such, further emissions cuts in 2024 are far from guaranteed.
Target practise
While the UK has made rapid progress in cutting its territorial emissions since 1990, it remains only around halfway to reaching its net-zero target for 2050, as the chart figure shows.
Emissions fell by 23MtCO2e in 2023, according to Carbon Brief’s analysis. This is faster than the 14MtCO2e reduction needed every year for the next quarter-century to reach net-zero by 2050.

However, with only one coal-fired power station remaining and the power sector overall now likely only the fifth-largest contributor to UK emissions, the country will need to start cutting into gas power and looking to other sectors, if it is to continue making progress towards its targets.
This will mean expanding wind and solar capacity to reduce gas use, while retaining gas-fired power stations for periods of low wind and starting to build low-carbon alternatives, such as gas with carbon capture and storage, long-term energy storage or hydrogen-fired turbines.
Emissions from road transport and buildings will be key areas if the UK is to progress, which is why changes to government plans around electric vehicles and heat pumps could be problematic.
Similarly, a government decision to “carry forward” the “surplus” emissions cuts from earlier years – largely due to external events such as Covid – would severely weaken UK targets at a time when continued ambition is needed, to stay on track for medium- and long-term climate goals.
Methodology
The starting point for Carbon Brief’s analysis of UK greenhouse gas emissions is preliminary government estimates of energy use by fuel. These are published quarterly, with the final quarter of each year appearing in figures published at the end of the following February. The same approach has accurately estimated year-to-year changes in emissions in previous years (see table, below).

One large source of uncertainty is the provisional energy use data, which is revised at the end of March each year and often again later on. Emissions data is also subject to revision in light of improvements in data collection and the methodology used, with major revisions in 2021.
The table above applies Carbon Brief’s emissions calculations to the comparable energy use and emissions figures, which may differ from those published previously.
Another source of uncertainty is the fact that Carbon Brief’s approach to estimating the annual change in emissions differs from the methodology used for the government’s own provisional estimates. The government has access to more granular data not available for public use.
Carbon Brief’s analysis takes figures on the amount of energy sourced from coal, oil and gas reported in Energy Trends 1.2. These figures are combined with conversion factors for the CO2 emissions per unit of energy, published annually by the UK government. Conversion factors are available for each fuel type, for example, petrol, diesel, gas, coal for electricity generation.
For oil, the analysis also draws on Energy Trends 3.13, which further breaks down demand according to the subtype of oil, for example, petrol, jet fuel and so on. Similarly, for coal, the analysis draws on Energy Trends 2.6, which breaks down solid fuel use by subtype.
Emissions from each fuel are then estimated from the energy use multiplied by the conversion factor, weighted by the relative proportions for each fuel subtype.
For example, the UK uses roughly 50m tonnes of oil equivalent (Mtoe) in the form of oil products, around half of which is from road diesel. So half the total energy use from oil is combined with the conversion factor for road diesel, another one-fifth for petrol and so on.
Energy use from each fossil fuel subtype is mapped onto the appropriate emissions conversion factor. In some cases, there is no direct read-across, in which case the nearest appropriate substitute is used. For example, energy use listed as “bitumen” is mapped to “processed fuel oils – residual oil”. Similarly, solid fuel used by “other conversion industries” is mapped to “petroleum coke”, and “other” solid fuel use is mapped to “coal (domestic)”.
The energy use figures are calculated on an inland consumption basis, meaning they include bunkers consumed in the UK for international transport by air and sea. In contrast, national emissions inventories exclude international aviation and shipping.
The analysis, therefore, estimates and removes the part of oil use that is due to the UK’s share of international aviation. It draws on the UK’s final greenhouse gas emissions inventory, which breaks emissions down by sector and reports the total for domestic aviation.
This domestic emissions figure is compared with the estimated emissions due to jet fuel use overall, based on the appropriate conversion factor. The analysis assumes that domestic aviation’s share of emissions is equivalent to its share of jet fuel energy use.
In addition to estimating CO2 emissions from fossil fuel use, Carbon Brief assumes that CO2 emissions from non-fuel sources, such as land-use change and forestry, are the same as a year earlier. Remaining greenhouse gas emissions are assumed to change in line with the latest government energy and emissions projections.
These assumptions are based on the UK government’s own methodology for preliminary greenhouse gas emissions estimates, published in 2019.
Note that the figures in this article are for emissions within the UK measured according to international guidelines. This means they exclude emissions associated with imported goods, including imported biomass, as well as the UK’s share of international aviation and shipping.
The Office for National Statistics (ONS) has published detailed comparisons between various different approaches to calculating UK emissions, on a territorial, consumption, environmental accounts or international accounting basis.
The UK’s consumption-based CO2 emissions increased between 1990 and 2007. Since then, however, they have fallen by a similar number of tonnes as emissions within the UK.
Bioenergy is a significant source of renewable energy in the UK and its climate benefits are disputed. Contrary to public perception, however, only around one quarter of bioenergy is imported.
International aviation is considered part of the UK’s carbon budgets and faces the prospect of tighter limits on its CO2 emissions. The international shipping sector has a target to at least halve its emissions by 2050, relative to 2008 levels.


The post Analysis: UK emissions in 2023 fell to lowest level since 1879 appeared first on Carbon Brief.
Analysis: UK emissions in 2023 fell to lowest level since 1879

Climate Change
Climate change exposes 580 million children to 20 extra ‘heat-stress days’ every year
More than 40% of children under the age of 10 globally are already experiencing at least 20 additional “heat-stress days” due to climate change.
This is according to a new attribution study, published in Science Advances, which combines climate models with demographic data to assess the age groups and regions that are exposed to the most hot, humid days.
The study finds that children up to the age of nine already face more additional heat-stress days globally as a result of climate change than any other age group.
It adds that south Asia and west Africa are recording the greatest childhood exposure to dangerous levels of humid heat – largely because these regions have a rapidly growing population with the highest proportion of young children.
As the climate warms, children will continue to be more exposed to heat stress than any other age group, the paper warns.
The lead author of the study tells Carbon Brief that the findings should inform discussions about climate justice, noting that children in developing countries “have contributed the least to historical greenhouse gas emissions”.
Humid heat
High temperatures can be deadly. For example, the heatwaves that swept across Europe in the summer of 2026 have been linked to tens of thousands of “excess deaths”.
A prominent 2021 study found that children born in the 21st century will be exposed to more extreme weather events in their lifetimes than their parents and grandparents.
Four years later, a study conducted by scientists from the same team found that more than half of children born in 2020 – around 62 million people – will experience “unprecedented lifetime exposure” to heatwaves, even if warming is limited to 1.5C.
Now, the latest research from the same team finds that children already face greater exposure to dangerous levels of humid heat than adults as a result of human-caused climate change.
Extreme heat is particularly dangerous when combined with high humidity. In hot weather, the human body produces sweat to cool itself down. However, as humidity increases, sweating becomes less effective.
The study uses wet-bulb globe temperature – a measure of temperature that takes humidity and wind into account – to calculate heat stress. It defines a “heat-stress day” as any day with a wet-bulb globe temperature above 28C, as this is considered the threshold for “moderate heat stress”
The authors then use climate models to simulate global temperature patterns in the present-day climate. (The authors use the climate of 2023, in which human activity has caused 1.3C of warming, to represent the “present-day”.)
They then count the number of heat-stress days that each country records on average, per year. The authors then repeat this exercise, simulating a pre-industrial climate without human-caused warming.
By comparing the number of heat-stress days in the present-day climate with the number in a pre-industrial climate, the authors can determine how many extra heat-stress days were driven by climate change. They refer to these as “extra” or “attributable” heat-stress days.
The authors find that “low-latitude” countries, located in the tropics, record the most extra heat-stress days.
For example, the paper finds that people living in Côte d’Ivoire currently face 112 heat-stress days every year. It adds that around half of these are due to human-caused climate change.
In contrast, Germany sees only 0.1 heat-stress days per year in today’s climate on average, which is largely attributable to human-caused climate change.
Rosa Pietroiusti, a PhD student at Vrije Universiteit Brussel and lead author on the study, explains why this number may seem lower than expected.
She tells Carbon Brief that the paper “really focuses on humid heat, at levels that are relatively rarely felt in Europe”. She adds:
“Our data also doesn’t capture the urban heat island effect, due to the resolution of the data we use, which also would lead to underestimations of heat stress locally, and lead to a mismatch with what people are experiencing at local scales, particularly in cities.”
Inequality
Extreme heat affects some people more severely than others. Children, people over 65 and those with pre-existing medical conditions or certain disabilities are among the most vulnerable. This is because their bodies are less able to regulate their temperature.
The authors use gridded demographic data to determine the age structure of each country. From this, they calculate how many people from each age cohort are exposed to extra heat days as a result of climate change.
The research finds that globally, 583 million children under the age of 10 already live through at least 20 attributable heat days every year. This accounts for 44% of all children in this age bracket.
In comparison, 190 million people aged 60-69 face at least 20 attributable heat days per year, accounting for 30% of this age cohort.
The authors find that children face the greatest exposure to humid heat for two main reasons.
First, there are more young people alive today than older people, with 1.3 billion children aged under 10 in the world, compared to 0.6 billion people aged 60-69.
Second, they find that countries in Africa and Asia typically have rapidly growing populations with more young children. In contrast, many countries in the northern hemisphere – which are typically cooler – have older populations.
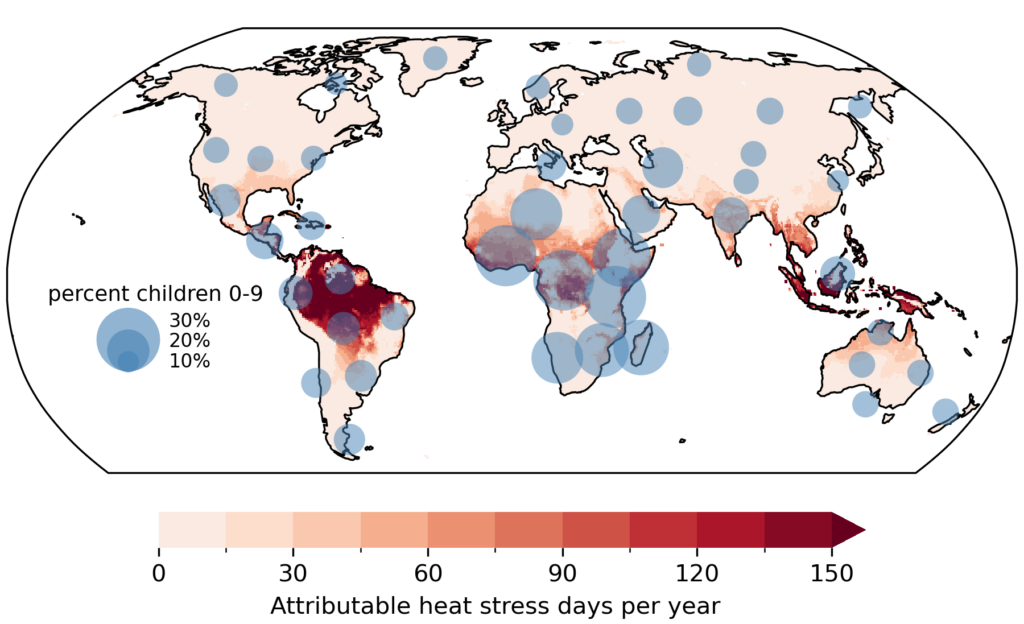
The map below shows how many extra stress heat days each country currently faces as a result of human-caused climate change. Darker reds indicate a higher number of attributable heat days. The blue circles show the percentage of the population under the age of 10, with larger circles indicating a higher percentage.
Warming world
The authors also repeat their analysis for a 1.5C and 2C warmer world. They use population estimates from the SSP2 scenario, which projects that the world’s population will peak at more than nine billion in the second half of the 21st century, with most growth occurring in low-latitude regions – especially in sub-Saharan Africa.
The research finds that, in today’s climate, 11% of all under 10s currently experience 100 or more extra heat-stress days per year due to climate change. In worlds warmed by 1.5C and 2C, the percentage rises to 13% and 23%, respectively.
In contrast, only 6% of all people aged 60-69 currently face 100 or more extra heat-stress days each year due to climate change. This number rises to 9% and 17% for 1.5C and 2C worlds, respectively.
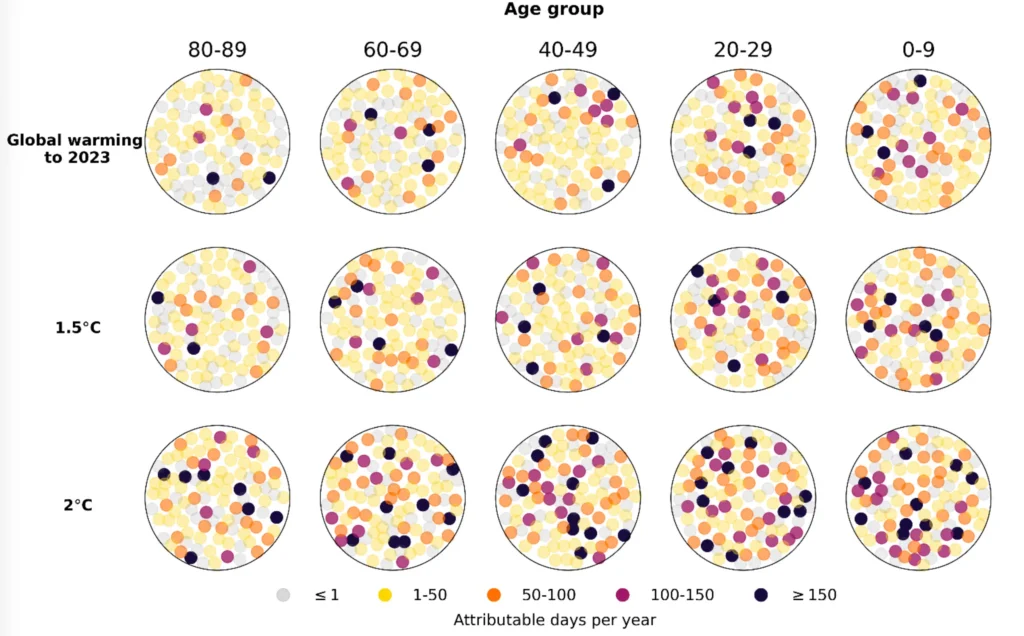
These results are shown in the plot below. The three rows represent the climates of 2023 (top), a 1.5C world (middle) and a 2C world (bottom). The columns show different age cohorts, from the oldest on the left to the youngest on the right.
Each circle contains 100 coloured dots, with each dot representing 1% of the age cohort.
The colour of the dot represents exposure to annual heat-stress day, with darker dots indicating more heat-stress days. Grey dots mean that people experience fewer than one extra heat-stress day per year due to human-caused climate change, while black dots mean more than 150 extra heat-stress days due to climate change.
The figure shows that higher warming levels expose more people to heat stress and that younger cohorts tend to be worst affected.
For example, the top-right circle represents heat stress for under 10s in the present-day climate. Three of these dots are coloured black, indicating that 3% faced at least 150 attributable heat-stress days in 2023.
Pietroiusti tells Carbon Brief the study uses wet-bulb temperature because it is a “well-established heat stress metric”. However, she notes that it was not “explicitly defined to focus on children”. She continues:
“A really important step forward in the research community would be to link up climate science and health science experts to do research on what metrics are really most representative of, for example, health impacts and educational impacts that children will be suffering.”
Vulnerability
Dr Qinqin Kong, a postdoctoral researcher at the departments of medicine and health policy at Stanford University, who was not involved in the study, praises its “robust” methodology.
He tells Carbon Brief that the research provides “a timely quantitative evidence for discussions of climate justice, children’s rights and intergenerational equity”.
However, Kong suggests that the paper “may overstate the contrast between children and the elderly and underestimate the relative burden of older adults”.
He says:
“The elderly may also be more vulnerable due to their social circumstances. Children often benefit from parental supervision and caregiving, whereas many older adults live alone, have limited mobility and face barriers to accessing cooling or emergency assistance during heat events.”
Kong also notes that “people and societies in the mid-latitudes [for example, across much of Europe and North America] are less adapted to heat”, which may make them vulnerable to its impacts.
For example, he says that Europe “shows substantially stronger relative risk of heat mortality likely due to less heat-acclimatised populations, lower air conditioning prevalence and urban designs that don’t favour heat dissipation”.
Similarly, Dr Daniel Vecellio – a researcher at the University of Nebraska, who was not involved in the study – tells Carbon Brief that children are an “understudied cohort”.
However, he says there is “reason for hope” because “children are typically pretty good behavioural adapters to extreme heat” and because people who are “chronically exposed to extreme heat” will “have a better chance at better acclimatisation”.
Pietroiusti tells Carbon Brief that global reporting on heatwaves is often skewed towards wealthier nations.
For example, she notes that large-scale databases of disasters, such as EM-DAT, often underrepresent heatwaves in Africa, due in part to a lack of news coverage and formal reporting. She adds:
“Studies like this, which start from the climate data, can start to fill some of these gaps.”
She adds that the paper should inform discussions about climate justice, noting that children in developing countries, who are most severely affected by the increase in heat-stress days, “have contributed the least to historical greenhouse gas emissions”.
Pietroiusti, R. et al. (2026) Age-specific exposure to human-induced increases in humid heat, Science Advances, doi:10.1126/sciadv.aeb3232



The post Climate change exposes 580 million children to 20 extra ‘heat-stress days’ every year appeared first on Carbon Brief.
Climate change exposes 580 million children to 20 extra ‘heat-stress days’ every year
The US is expected to resume its attempt to sink measures for a greener global shipping sector at closed-door talks between governments at the International Maritime Organization (IMO) in early September.
The US and oil-producing allies like Saudi Arabia want to weaken a proposed plan for cleaner fuels that aims to reduce planet-heating emissions from the industry, which relies heavily on dirty bunker fuels. Shipping currently represents 3% of global emissions.
Those that want a softer system are likely to back a Liberian proposal which expert analysis suggests would see emissions fall by only half at most by 2050, far short of the sector’s agreed climate goals.
After several years of debate, governments provisionally agreed in April 2025 on the “Net Zero Framework” (NZF), a series of emissions reduction targets for shipowners, backed up with financial rewards for meeting the targets and fees for missing them.
But in October 2025, after a high-profile intervention from US President Donald Trump and threats of sanctions and visa restrictions, the US convinced a majority of voting nations to postpone the adoption of the NZF for a year.
Ralph Regenvanu, climate minister for the Pacific nation of Vanuatu, called the delay “unacceptable” given the urgency of accelerating climate change.
After a round of low-profile talks in May, the first of three further sets of talks on how to clean up shipping will begin at the IMO’s riverside headquarters in London on Tuesday, culminating in a final public session in November.
Em Fenton, who follows the talks as senior director of climate diplomacy at Opportunity Green, an NGO focused on aviation and shipping, said governments should not be sidetracked by alternative proposals to the NZF, calling them “a distraction from a hard-fought multilateral compromise”.
“If countries want to deliver a just and fair maritime transition, there is really only one choice: back the NZF and stand together in solidarity against those who would tear it apart,” Fenton added.
Five proposals on the table
Governments will discuss five different proposals submitted in advance of next week’s meeting. The most ambitious of these is from the Pacific island nation of Tuvalu, which has proposed a levy on the entirety of a ship’s emissions rather than just those above a certain level, as the NZF envisions.
That had been the original demand of Pacific nations before the NZF was provisionally adopted in April 2025. At the time, Tuvalu’s transport minister Simon Kofe described the NZF as disappointing and not ambitious enough.
For this reason, six Pacific countries abstained in the vote on the NZF. While they supported the original plan for its adoption in October 2025, they have used the delay to push again for more ambition.
John Kautoke, advisor to a group of Pacific nations called 6PAC+, told Climate Home News that the NZF “cannot diminish its already inadequate ambition. If anything, the NZF must increase in ambition if we are going to renegotiate its parameters.”
-
New Zealand moves to protect business with law curtailing climate litigation
A new bill prevents corporations being sued for the climate damage their emissions cause, as the government says climate action should be handled at the national level not in court -
Indonesia’s nickel production cuts are not enough to create a sustainable industry
The government is restricting nickel production to push up prices but producing more sustainable nickel for a premium requires addressing the industry’s coal issue -
As marine heat breaks records, countries seek ocean roadmap at COP31
Africa and the EU are leading a push for COP31 to deliver a roadmap that lays out measures to protect fast-warming oceans


Analysis by the Institute of Marine Engineering, Science and Technology (IMarEST) suggests that, of the five proposals, only Tuvalu’s would meet the 2030 and 2040 emissions reduction targets for global shipping that were agreed by governments in 2023. Those were for cuts of 20% between 2008 and 2030, 70% by 2040 and then reaching net zero “by or around, i.e. close to 2050”.
Despite this, the UK, Australia, Canada and South Africa have formally proposed that governments adopt the NZF, which won support in a 63-13 vote among governments at the April 2025 talks. Trump’s US walked out halfway through.
According to IMarEst’s analysis, while the NZF proposal will not be enough to meet the industry’s targets, it will reduce emissions more cheaply than the Pacific proposal.
A proposal by Brazil – which fought hard for the NZF last October – suggests tweaking the framework to make meeting targets easier in the short term and harder in the long term.
While this compromise will make it more appealing to the owners of polluting ships and countries that support them, IMarEst estimates it would lead to higher cumulative emissions than either the NZF or Pacific proposals.
The NZF stipulates that fees for high-polluting shipowners should be be put into a Net Zero Fund and used to promote clean shipping fuels and a fairer transition. The Brazilian proposal would delay raising and spending these funds by two years, from 2029 to 2031.
Liberia’s proposal weakens emissions cuts
The US and Saudi Arabia are likely to swing behind a new proposal from Liberia, whose government makes millions of dollars a year selling the right for shipowners to register their vessels in the small West African nation via a US-based company.
This proposal would weaken the emissions reduction targets. IMarEst says it would cut the industry’s emissions at most by a half by 2050, falling far short of the target agreed in 2023 for international shipping to reach net zero “close to 2050”.
It would also replace the NZF’s fees for missing targets with a carbon trading system. As a result, there would be no Net Zero Fund and therefore less money available to incentivise green fuels and make the transition more equitable for poorer nations.
Pacific advisor Kautoke said that, as well as preventing shipping from reaching zero emissions by 2050, Liberia’s proposal would mean the Pacific “will not receive any support to deal with the disproportionately negative impacts created by the cost of the transition”.
“We get a double blow if we adopt the Liberian proposal,” he warned. “We get all the cost of a transition without any support, and we have an industry that continues to burn fossil fuels to an unforeseen point.”
Japanese proposal favours shipowners
Japan has submitted a late proposal to amend the NZF so that shipowners have more control over how the fees they would pay for emitting above a set threshold are spent.
University College London professor Tristan Smith has argued that this change means there will be no central mechanism to incentivise investments in clean fuels. He wrote on LinkedIn that under the system put forward by Japan, shipowners would be able to select which green projects their fees would go to. They could choose their own or those of a sister company or other shipowners, rather than funding broader just transition projects that would benefit marine workers or developing countries hit by rising shipping costs.
Despite its flaws, Smith added that Japan’s proposal “could still get taken seriously by some, given how appealing it may seem to shipowners who have consistently demanded control of revenues, and given how the US and other member states have pushed back against the IMO Net Zero Fund and [greenhouse gas] pricing.”
Tacit or explicit approval?
Next week, governments are expected to make statements saying which proposals – or which aspects of proposals – they prefer. Another set of talks will be held from November 23-27 before a potentially final round from November 30-December 4.
A new framework to tackle shipping emissions could be adopted at those talks if two-thirds of countries that are present and signed up to a regulation called Marpol Annex VI – endorsed by just over 100 states – vote in favour of it, as they did in April 2025.
The US and its allies are also trying to change the rules to make the next stage more difficult. Decisions that have been adopted at IMO meetings usually take effect automatically unless a certain number of countries object within a certain time period decided by governments, a system known as tacit approval.
But the US wants that to require explicit approval instead, so that any new emissions standard would not come into force unless enough governments – representing a certain percentage of the world’s shipping fleet – actively indicate support for it.
Critics say this change would give a small number of countries with large shipping registries the power to block implementation. Liberia has the world’s biggest shipping registry, run by an American company, followed by Panama and the Republic of the Marshall Islands.
Liberia and Panama have supported the US at the talks on the Net Zero Framework. The Marshall Islands has long been one of the most vocal supporters of climate action in shipping but, with its officials and shipping registry income vulnerable to US retaliation, did not sign on to the recent Pacific proposal vowing to strengthen the NZF if it is re-opened.
Brazilian negotiator Adriana de Medeiros Gabinio warned in April that the NZF’s opponents are trying to change the rules by which it comes into force as a “safety net to block” it.
The post Battle over cleaning up shipping set to resume at London talks appeared first on Climate Home News.
Battle over cleaning up shipping set to resume at London talks
SYDNEY, Wednesday 26 August 2026 — New 2026 Sustainability Reports released by supermarket giants Coles and Woolworths this week demonstrate the retailers are failing on their commitments to end deforestation in their supply chains.
Adele Chasson, Nature Policy Lead at Greenpeace Australia Pacific said:
“These so-called sustainability reports are revealing. Despite their public commitments in 2024 and 2025, neither Coles nor Woolworths have taken deforestation-linked beef off their shelves. Meanwhile, bulldozers continue to tear up forests and bushland, pushing wildlife closer to extinction and causing mass toxic runoff to flow into the Great Barrier Reef. Millions of native animals like koalas are losing their homes to beef pastures each year, while the big supermarkets put off action.
“Australians would be shocked to know that beef on the shelves of our biggest supermarkets could be pushing threatened species to the brink of extinction. Collectively Coles and Woolworths have made more than $2 billion in profits in the last year, profiting from the destruction of wildlife and precious Australian nature. Coles and Woolworths owe it to shoppers to deliver on their promises and end deforestation in their supply chains now.
“As big beef buyers, Coles and Woolworths have an essential role to play in keeping Australia’s unique forests standing. They can help stop the Great Barrier Reef from being poisoned by runoff and protect iconic forest wildlife by taking deforestation off their shelves. It’s time these big companies put their money where their mouths are and follow through on their promise of sourcing and supplying deforestation-free beef.”



-
Climate Change1 year ago
Guest post: Why China is still building new coal – and when it might stop
-
Greenhouse Gases1 year ago
Guest post: Why China is still building new coal – and when it might stop
-

 Greenhouse Gases2 years ago
嘉宾来稿:满足中国增长的用电需求 光伏加储能“比新建煤电更实惠”
-

 Climate Change2 years ago
嘉宾来稿:满足中国增长的用电需求 光伏加储能“比新建煤电更实惠”
-
Climate Change2 years ago
Bill Discounting Climate Change in Florida’s Energy Policy Awaits DeSantis’ Approval
-

 Renewable Energy10 months ago
Sending Progressive Philanthropist George Soros to Prison?
-
Greenhouse Gases1 year ago
嘉宾来稿:探究火山喷发如何影响气候预测
-

 Carbon Footprint2 years ago
US SEC’s Climate Disclosure Rules Spur Renewed Interest in Carbon Credits