

The global shift towards a clean-energy system is much more than just a technological switch – it is a profound transformation of markets, industries and societal behaviours.
This complex undertaking is often characterised by “non-linearity” and “feedback loops”, where small changes can go on to have disproportionately large impacts and where seemingly straightforward paths encounter unexpected roadblocks.
Interventions can be self-amplifying – leading to runaway change, or they can be self-defeating – when progress seems impossible to attain.
Our new policy brief sheds light on these intricate dynamics, which can be overlooked when governments use analytical frameworks based on standard economic thinking.
The brief sets out the most common archetypes of system change and behaviour, as well as the underlying feedback loops that drive them, with the aim of helping policymakers to understand the recurring patterns that can either accelerate or impede progress.
Governments that can recognise these patterns – as well as the ways they can be harnessed or sidestepped – are likely to be better equipped to manage structural change.
This article delves into three key examples from the policy brief, exploring how they are influencing the energy transition and what lessons can be drawn for effective policymaking.
Reinforcing feedback loops
At the heart of the energy transition lies a powerful engine: the reinforcing feedback loops inherent in the development and diffusion of many clean-energy technologies.
This virtuous cycle operates through several mechanisms.
First, “learning by doing”, which means that as more units of a technology, such as solar panels or wind turbines, are produced and deployed, manufacturers and developers become more efficient, processes are refined and costs fall.
Second, economies of scale kick in: as production volumes increase, unit costs decrease due to efficiencies in manufacturing and more developed supply chains.
Finally, wider deployment can trigger network effects and the emergence of complementary innovations. This means that as the adoption of a given technology grows, it can foster an ecosystem of supporting infrastructure, skilled labour and supporting technologies, which can further boost its attractiveness and viability.
Together, these three elements create a powerful reinforcing loop: initial investment drives innovation and cost reduction, which spurs increased demand, attracting further investment.
Solar photovoltaics (PV) and wind turbines are prime examples of this dynamic.
The astonishing growth of solar offers a particularly vivid illustration of the way in which reinforcing feedback loops can blindside experts and policymakers alike.
Solar growth has far exceeded projections made in the early 2000s. Indeed, the world’s actual installed capacity in 2020 was over 700 gigawatts (GW), more than ten times the level expected in outlooks published in 2006, as shown in the figure below.
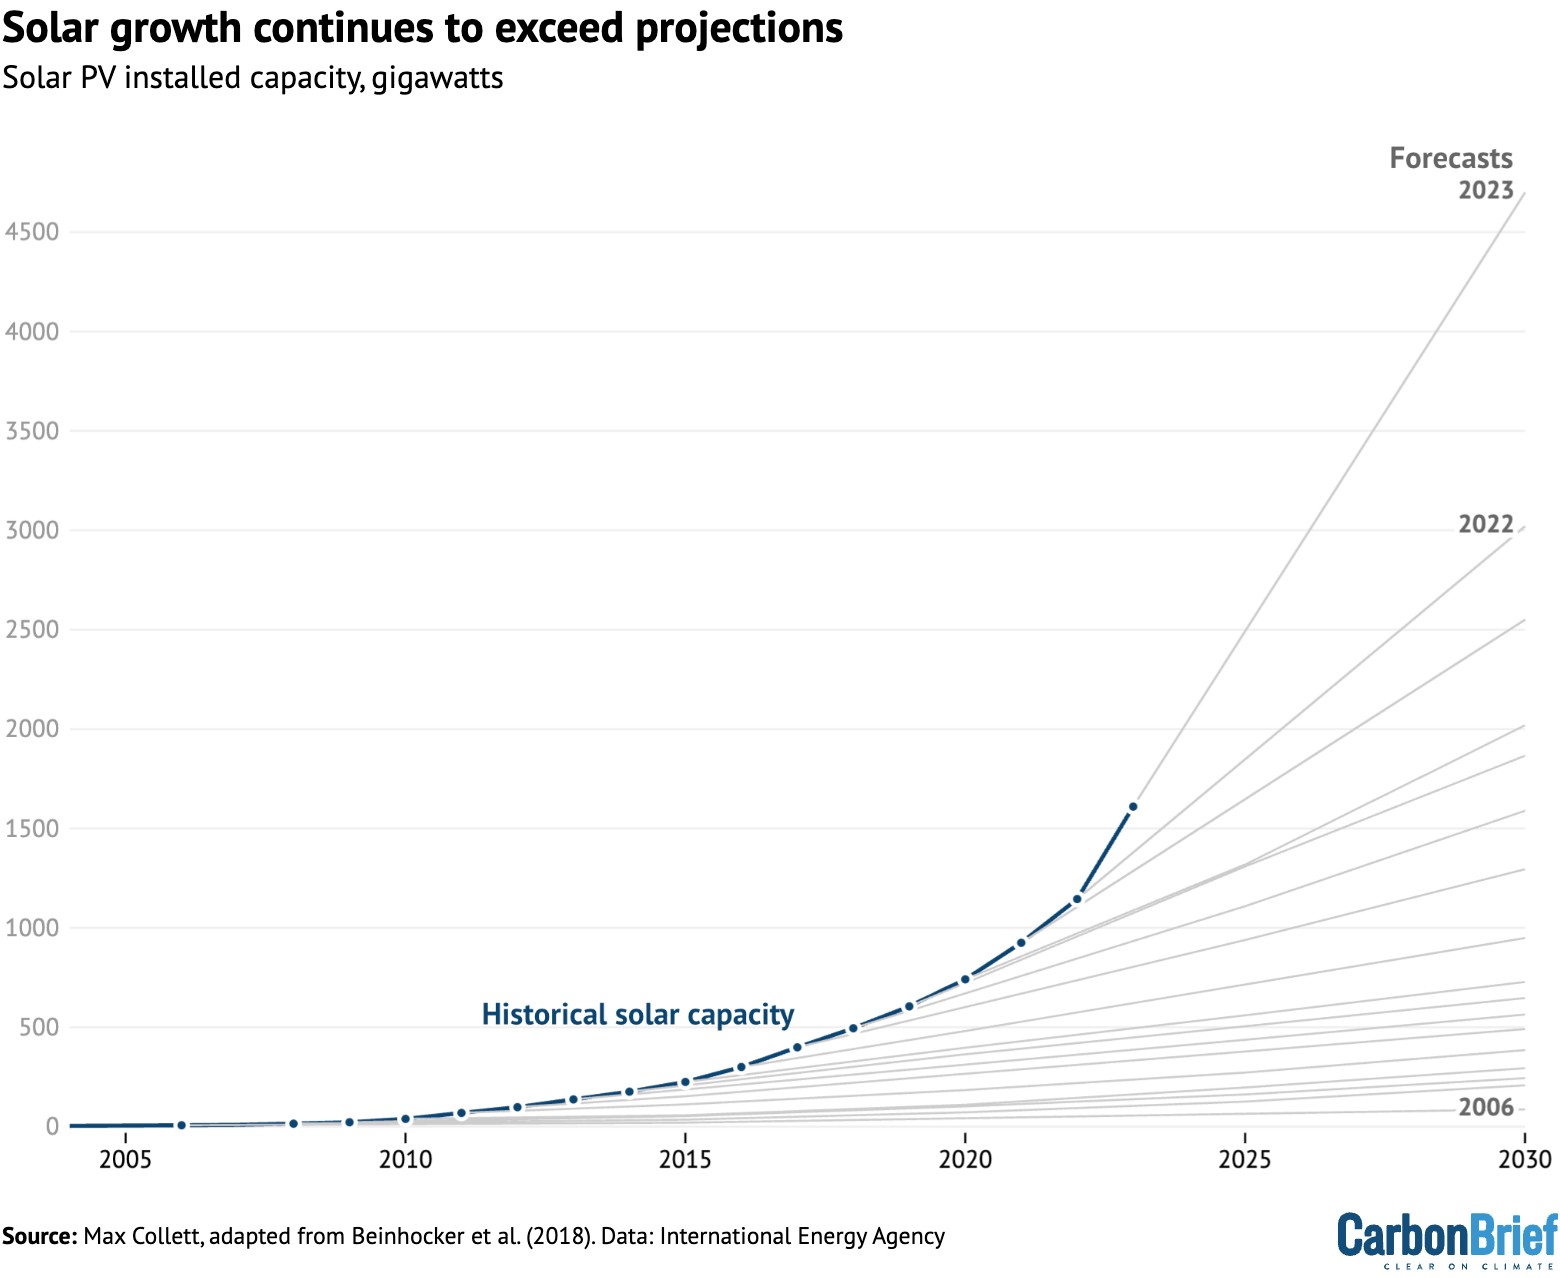
Global solar deployment has exceeded expectations due to disparate trends and drivers in individual markets that, together, all point in the same direction. China, for instance, met its 2030 target for wind and solar capacity six years ahead of schedule in 2024.
Batteries are also riding this wave, with costs plummeting by around 85% over the past decade as deployment, particularly in road transport, scales up.
However, not all clean-energy technologies benefit from this self-amplifying pattern.
Nuclear power and hydropower, for example, have historically not shown the same rapid cost declines, due to their large, complex and site-specific nature. This contrasts with the smaller, modular and replicable characteristics of technologies, such as solar PV.
This does not negate the potential role of such technologies, but it does mean that they are less likely to see disruptive, exponential and self-reinforcing growth.
There are a number of potential conclusions for policymakers.
Early in the transition, interventions such as feed-in tariffs and public procurement were crucial in kick-starting these reinforcing feedbacks for solar and wind.
As these technologies mature and become cost-competitive, the focus shifts to removing other barriers, such as streamlining permitting processes, investing in grid expansion and reforming markets so they are better able to integrate variable renewable output.
These same principles could now be applied to newly emergent clean-energy technologies. Policies that directly nurture these reinforcing loops, such as deployment subsidies and clean technology mandates, can be expected to be most effective in the initial stages.
Turning again to the example of solar energy, while such initial efforts appeared to be expensive, they paid off over time by unlocking future cost reductions and, thus, kick-starting the self-amplifying feedback loops that are now driving further progress.
This contrasts with the idea that carbon pricing is necessarily the most efficient policy for decarbonisation. It may well be helpful, but as it will not drive rapid early technology adoption, it is less likely to have a self-amplifying effect in the initial stages of the transition.
Renewable ‘cannibalisation’
While the growth of renewable energy is the driving force of the energy transition, another system dynamic, termed “renewable cannibalisation“, can act as a dampening feedback loop. This can potentially slow progress long before full decarbonisation is achieved
This cannibalisation process results in variable renewable energy (VRE) sources, such as solar and wind, receiving decreasing prices for the electricity they generate.
Essentially, the more solar and wind capacity that is connected to the grid, the more they undermine their own revenue. This happens through three main channels.
First, the merit order effect, whereby solar and wind, which have very low operating costs, push more expensive fossil-fuel generators out of the market when supply is abundant.
In markets with marginal pricing, this leads to lower wholesale electricity prices during periods of high renewable output. While this cuts prices for consumers – at least in the short term – these lower prices also reduce revenues for renewable generators, potentially undermining the economic case for further investment.
For example, in California, solar power unit revenues fell by $1.30 per megawatt hour (MWh) for each percentage point increase in solar penetration between 2013 and 2017.
Second, price volatility, where uncertainty over future trends in the generation mix and the balance between supply and demand can make long-term revenues difficult to predict.
This increased uncertainty can raise the cost of capital for new renewable projects, again acting as a brake on investment
The UK, for example, experienced this before the introduction of “contracts for difference” (CfDs), which helped stabilise revenue expectations for renewable developers.
Third, volume risk, where rising VRE capacity increases the likelihood of more frequent curtailment – periods when renewable generation exceeds demand or grid capacity, forcing generators to scale back output and lose potential revenue.
Curtailment in itself is nothing new, but the scale and frequency is changing. Recent analysis by University College London suggests that without significant flexibility or storage, UK renewable generation could exceed demand for more than 50% of the time by 2030.
The analysis found that installed wind and solar capacity is set to surge beyond current levels of electricity demand, as illustrated in the figure below, finding that this could “deter investment” in new projects if no action is taken to address the problem.
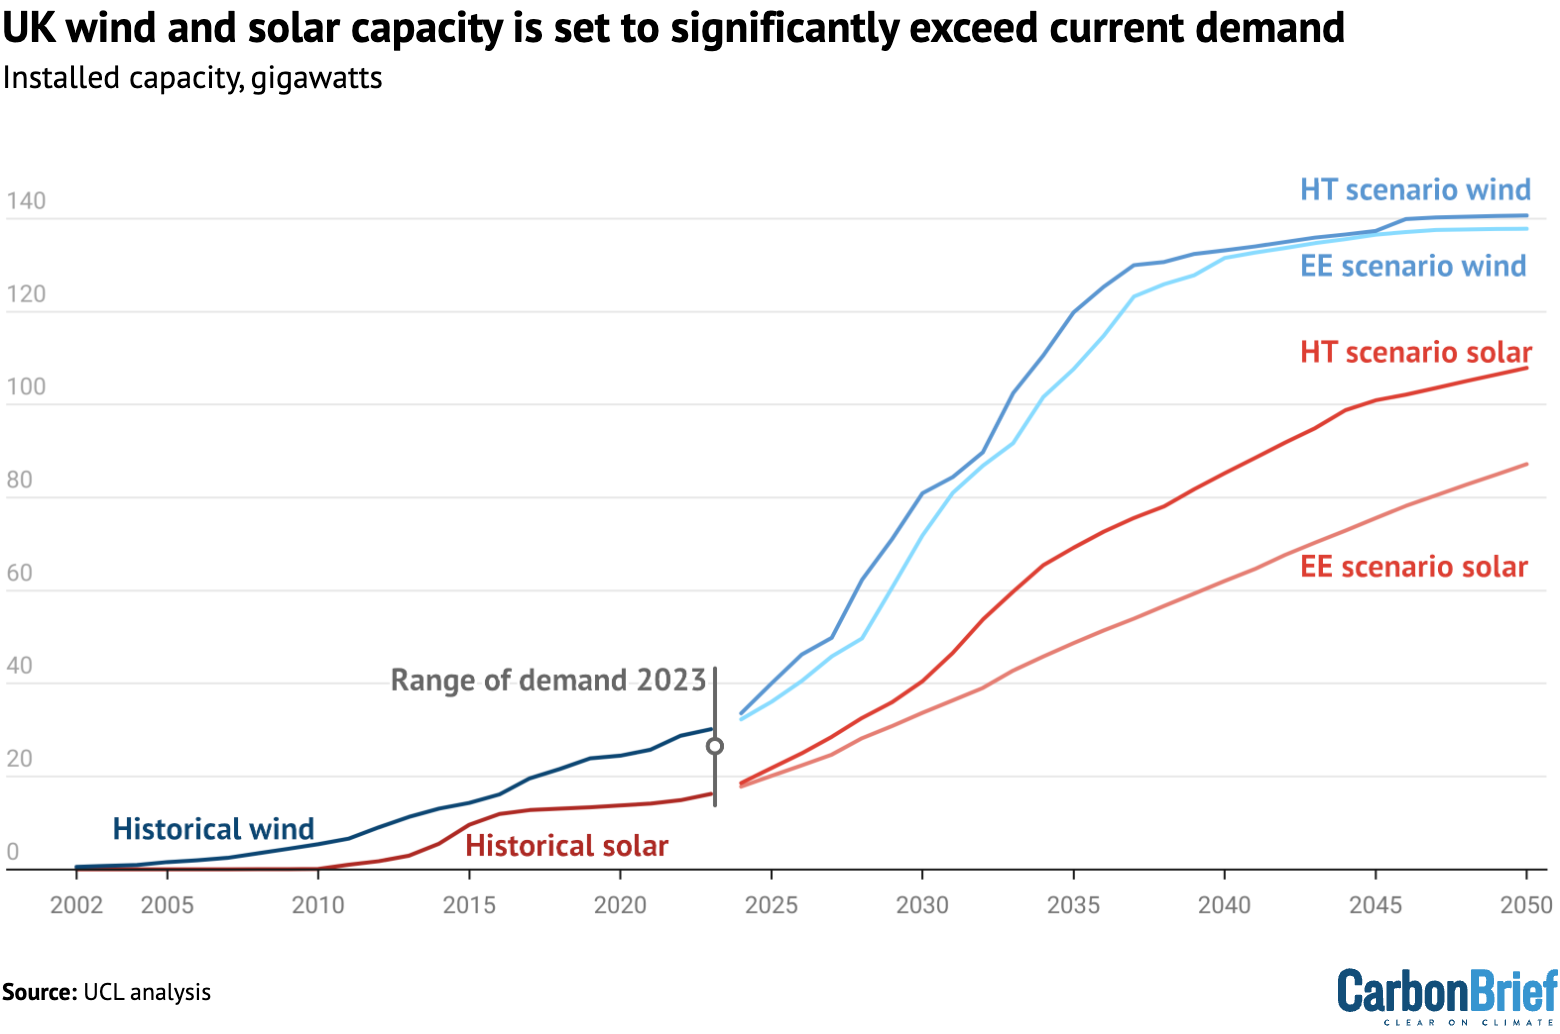
These dampening feedback loops illustrate a classic “limits to success” scenario. The very success of renewables, if unmanaged, can create conditions that hinder their continued expansion.
The policy implications here are nuanced. One solution is CfDs, which offer renewable generators a fixed price and have been effective in many countries at mitigating the merit order effect and price volatility, thus maintaining investment.
However, as VRE penetration becomes very high and surplus generation becomes a regular occurrence, other solutions are likely to be needed. This is because existing CfD designs often include clauses that stop payments when market prices drop below zero.
As a result, alternative CfD designs, guaranteeing revenues based on installed capacity or potential – rather than actual – electricity generation might be considered, for example, even though these have other drawbacks.
More fundamentally, our research suggests the solution to this challenge lies in fostering the co-evolution of renewables with technologies such as energy storage and green hydrogen production. These can absorb surplus generation and turn a problem into an opportunity.
Whereas, traditionally, it might be assumed that the market on its own can optimally allocate risk, research suggests that a redesign of market structures may be needed to enable investment and fully realise the cost-saving opportunities of the new technologies.
This is one of several sets of feedbacks discussed in a separate new report published today, looking at the power sector transition in China.
The power of connection
The energy transition is not a series of isolated changes in different sectors. Instead, it is an interconnected system, where progress in one area can catalyse shifts elsewhere. Shared technologies can create reinforcing feedbacks that accelerate decarbonisation across multiple fronts, generating cross-sector synergies.
The relationship between clean power and transport electrification is a powerful example of this. As batteries are deployed at scale in electric vehicles (EVs), their costs fall, enabling ever-wider deployment and further cost declines, as shown in the chart below.
This is due to the learning-by-doing and economies-of-scale feedbacks discussed above.
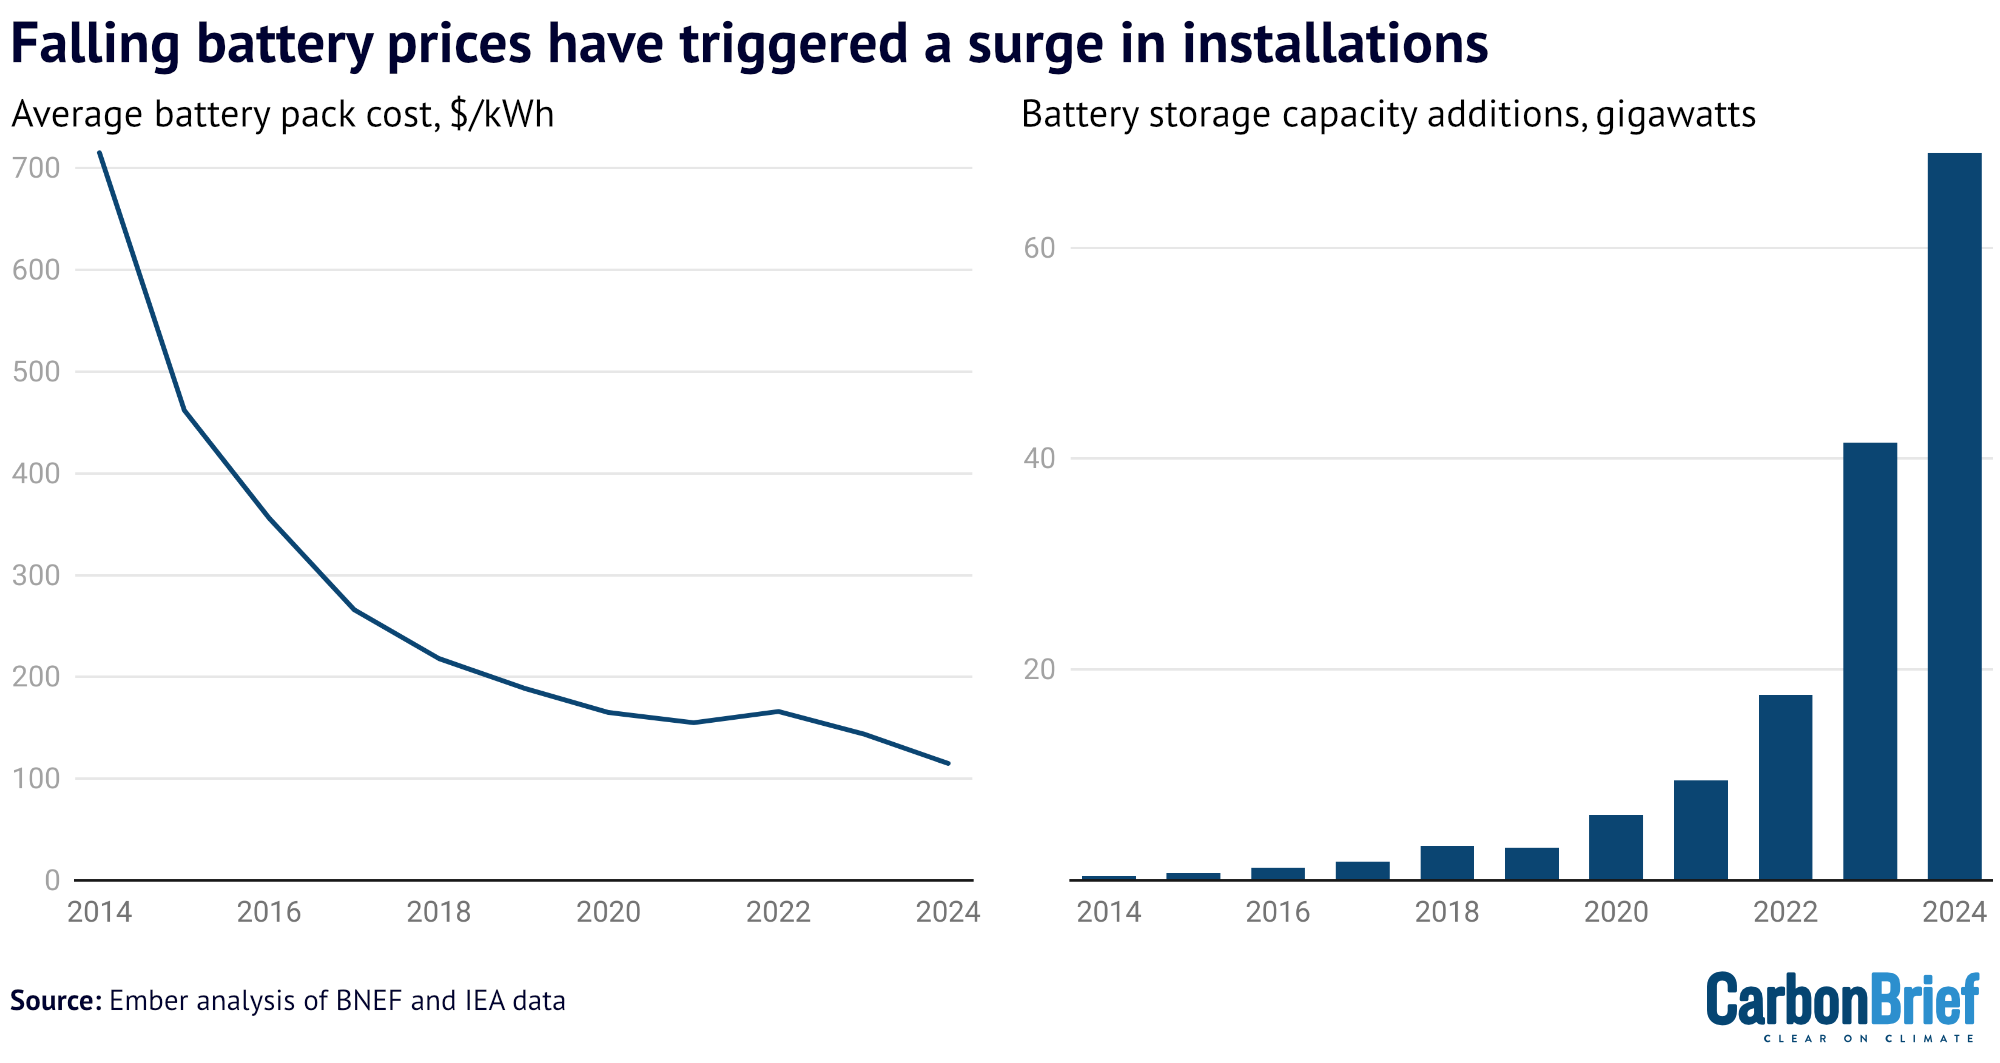
This cost reduction then makes batteries more viable for grid-scale energy storage, which, in tur, helps integrate more low-cost VRE into the power system.
Cheaper, cleaner electricity then further incentivises the electrification of transport, as well as heating and light industry. This increased electrification boosts demand for renewable power, driving further deployment and cost reductions in solar and wind. It also expands the potential for demand-side response, where consumers adjust their electricity use to help balance the grid.
A similar dynamic is anticipated for “green” hydrogen. As deployment in one anchor sector – perhaps fertilisers or refining – drives down the cost of electrolysers, it makes green hydrogen more competitive for other applications, such as shipping or even long-duration energy storage in the power sector.
Each sector’s adoption of green hydrogen contributes to the shared learning and cost reduction, benefiting all.
The policy implications of these cross-sector synergies could be significant. Their existence suggests, for example, that there is no need to wait for decarbonisation of the power sector to advance further, before beginning the electrification of transport, heating or industry.
This is in contrast to the argument that transport should only be electrified after cutting power sector emissions, since increased EV charging will drive up demand for gas- or coal-fired generation.
While there will be a marginal increase in emissions from plugging a new EV into the power grid, the insights described in our brief imply that it is still likely to be more effective to pursue the transition away from fossil fuels in multiple sectors in parallel, because it can activate beneficial cross-sector feedback loops that are greater than the sum of their parts.
As such, our research suggests that policymakers hoping to take advantage of cross-sector synergies could aim to deliberately strengthen technological linkages between different parts of the energy system. Examples include electricity tariffs and market structures that reward “smart” EV charging and vehicle-to-grid (V2G) services, encouraging industrial participation in demand-side response and promoting integrated home energy systems. These interactions can amplify the benefits of early investment in the transition.
Policy insights from system dynamics
Archetypes such as the self-reinforcing growth of clean technologies, the potential for renewable cannibalisation, the accelerating power of cross-sector synergies and seven others described in our new report paint a picture of a transition that is far from linear. Instead, we find that it is governed by complex interdependencies and feedback loops.
Consequently, our research suggests that policymakers will be much better equipped to manage and steer the transition, if they adopt a systems thinking approach.
Recognising these recurring patterns allows for the design of more robust and effective policies that anticipate challenges and leverage opportunities.
For instance, understanding the power of reinforcing feedback loops in technology diffusion underscores the value of early-stage support for nascent clean-energy technologies.
Conversely, anticipating the dampening effects of renewable cannibalisation highlights the likely benefits of combining renewable buildout with evolving market designs and strategic investments in flexibility solutions, such as storage and demand-side response.
Policymakers that understand and work with these dynamics are likely to be in a better position to spark self-amplifying changes – achieving maximum value for minimum effort – and to avoid self-defeating interventions that go nowhere.




The post Guest post: How ‘feedback loops’ and ‘non-linear thinking’ can inform climate policy appeared first on Carbon Brief.
Guest post: How ‘feedback loops’ and ‘non-linear thinking’ can inform climate policy

Drought and heatwaves occurring together – known as “compound” events – have “surged” across the world since the early 2000s, a new study shows.
Compound drought and heat events (CDHEs) can have devastating effects, creating the ideal conditions for intense wildfires, such as Australia’s “Black Summer” of 2019-20 where bushfires burned 24m hectares and killed 33 people.
The research, published in Science Advances, finds that the increase in CDHEs is predominantly being driven by events that start with a heatwave.
The global area affected by such “heatwave-led” compound events has more than doubled between 1980-2001 and 2002-23, the study says.
The rapid increase in these events over the last 23 years cannot be explained solely by global warming, the authors note.
Since the late 1990s, feedbacks between the land and the atmosphere have become stronger, making heatwaves more likely to trigger drought conditions, they explain.
One of the study authors tells Carbon Brief that societies must pay greater attention to compound events, which can “cause severe impacts on ecosystems, agriculture and society”.
Compound events
CDHEs are extreme weather events where drought and heatwave conditions occur simultaneously – or shortly after each other – in the same region.
These events are often triggered by large-scale weather patterns, such as “blocking” highs, which can produce “prolonged” hot and dry conditions, according to the study.
Prof Sang-Wook Yeh is one of the study authors and a professor at the Ewha Womans University in South Korea. He tells Carbon Brief:
“When heatwaves and droughts occur together, the two hazards reinforce each other through land-atmosphere interactions. This amplifies surface heating and soil moisture deficits, making compound events more intense and damaging than single hazards.”
CDHEs can begin with either a heatwave or a drought.
The sequence of these extremes is important, the study says, as they have different drivers and impacts.
For example, in a CDHE where the heatwave was the precursor, increased direct sunshine causes more moisture loss from soils and plants, leading to a drought.
Conversely, in an event where the drought was the precursor, the lack of soil moisture means that less of the sun’s energy goes into evaporation and more goes into warming the Earth’s surface. This produces favourable conditions for heatwaves.
The study shows that the majority of CDHEs globally start out as a drought.
In recent years, there has been increasing focus on these events due to the devastating impact they have on agriculture, ecosystems and public health.
In Russia in the summer of 2010, a compound drought-heatwave event – and the associated wildfires – caused the death of nearly 55,000 people, the study notes.

The record-breaking Pacific north-west “heat dome” in 2021 triggered extreme drought conditions that caused “significant declines” in wheat yields, as well as in barley, canola and fruit production in British Columbia and Alberta, Canada, says the study.
Increasing events
To assess how CDHEs are changing, the researchers use daily reanalysis data to identify droughts and heatwaves events. (Reanalysis data combines past observations with climate models to create a historical climate record.) Then, using an algorithm, they analyse how these events overlap in both time and space.
The study covers the period from 1980 to 2023 and the world’s land surface, excluding polar regions where CDHEs are rare.
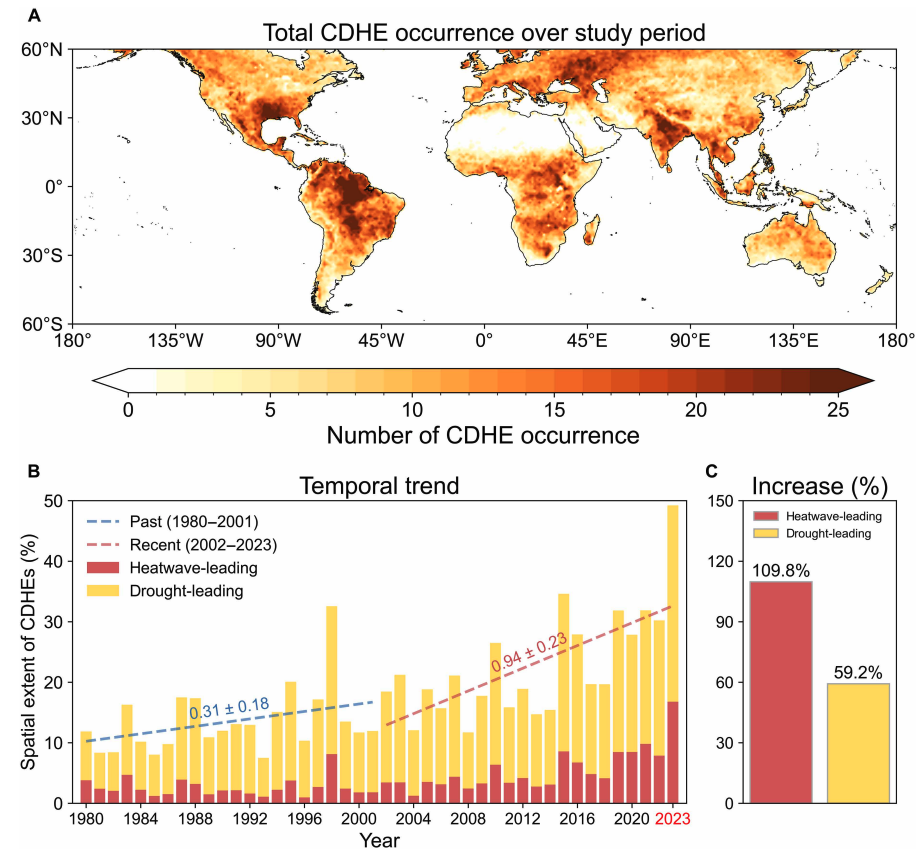
The research finds that the area of land affected by CDHEs has “increased substantially” since the early 2000s.
Heatwave-led events have been the main contributor to this increase, the study says, with their spatial extent rising 110% between 1980-2001 and 2002-23, compared to a 59% increase for drought-led events.
The map below shows the global distribution of CDHEs over 1980-2023. The charts show the percentage of the land surface affected by a heatwave-led CDHE (red) or a drought-led CDHE (yellow) in a given year (left) and relative increase in each CDHE type (right).
The study finds that CDHEs have occurred most frequently in northern South America, the southern US, eastern Europe, central Africa and south Asia.
Threshold passed
The authors explain that the increase in heatwave-led CDHEs is related to rising global temperatures, but that this does not tell the whole story.
In the earlier 22-year period of 1980-2001, the study finds that the spatial extent of heatwave-led CDHEs rises by 1.6% per 1C of global temperature rise. For the more-recent period of 2022-23, this increases “nearly eightfold” to 13.1%.
The change suggests that the rapid increase in the heatwave-led CDHEs occurred after the global average temperature “surpasse[d] a certain temperature threshold”, the paper says.
This threshold is an absolute global average temperature of 14.3C, the authors estimate (based on an 11-year average), which the world passed around the year 2000.
Investigating the recent surge in heatwave-leading CDHEs further, the researchers find a “regime shift” in land-atmosphere dynamics “toward a persistently intensified state after the late 1990s”.
In other words, the way that drier soils drive higher surface temperatures, and vice versa, is becoming stronger, resulting in more heatwave-led compound events.
Daily data
The research has some advantages over other previous studies, Yeh says. For instance, the new work uses daily estimations of CDHEs, compared to monthly data used in past research. This is “important for capturing the detailed occurrence” of these events, says Yeh.
He adds that another advantage of their study is that it distinguishes the sequence of droughts and heatwaves, which allows them to “better understand the differences” in the characteristics of CDHEs.
Dr Meryem Tanarhte is a climate scientist at the University Hassan II in Morocco, and Dr Ruth Cerezo Mota is a climatologist and a researcher at the National Autonomous University of Mexico. Both scientists, who were not involved in the study, agree that the daily estimations give a clearer picture of how CDHEs are changing.
Cerezo-Mota adds that another major contribution of the study is its global focus. She tells Carbon Brief that in some regions, such as Mexico and Africa, there is a lack of studies on CDHEs:
“Not because the events do not occur, but perhaps because [these regions] do not have all the data or the expertise to do so.”
However, she notes that the reanalysis data used by the study does have limitations with how it represents rainfall in some parts of the world.
Compound impacts
The study notes that if CDHEs continue to intensify – particularly events where heatwaves are the precursors – they could drive declining crop productivity, increased wildfire frequency and severe public health crises.
These impacts could be “much more rapid and severe as global warming continues”, Yeh tells Carbon Brief.
Tanarhte notes that these events can be forecasted up to 10 days ahead in many regions. Furthermore, she says, the strongest impacts can be prevented “through preparedness and adaptation”, including through “water management for agriculture, heatwave mitigation measures and wildfire mitigation”.
The study recommends reassessing current risk management strategies for these compound events. It also suggests incorporating the sequences of drought and heatwaves into compound event analysis frameworks “to enhance climate risk management”.
Cerezo-Mota says that it is clear that the world needs to be prepared for the increased occurrence of these events. She tells Carbon Brief:
“These [risk assessments and strategies] need to be carried out at the local level to understand the complexities of each region.”




The post Heatwaves driving recent ‘surge’ in compound drought and heat extremes appeared first on Carbon Brief.
Heatwaves driving recent ‘surge’ in compound drought and heat extremes
Greenhouse Gases
DeBriefed 6 March 2026: Iran energy crisis | China climate plan | Bristol’s ‘pioneering’ wind turbine
Welcome to Carbon Brief’s DeBriefed.
An essential guide to the week’s key developments relating to climate change.
This week
Energy crisis
ENERGY SPIKE: US-Israeli attacks on Iran and subsequent counterattacks across the Middle East have sent energy prices “soaring”, according to Reuters. The newswire reported that the region “accounts for just under a third of global oil production and almost a fifth of gas”. The Guardian noted that shipping traffic through the strait of Hormuz, which normally ferries 20% of the world’s oil, “all but ground to a halt”. The Financial Times reported that attacks by Iran on Middle East energy facilities – notably in Qatar – triggered the “biggest rise in gas prices since Russia’s full-scale invasion of Ukraine”.
‘RISK’ AND ‘BENEFITS’: