

新研究显示,中国来自农业机械的碳排放快速增长,可能会“阻碍”该国实现净零排放的目标。
这项发表在《自然-食品》(Nature Food)期刊上的研究发现,自1985年以来,中国农业机械CO2(二氧化碳)排放量增加了大约七倍。
研究人员利用政府发布的不同时期农机数量统计数据,计算了1985年至2020年期间CO2排放量及其他空气污染物的变化。
他们发现,自1985年以来,农业机械的CO2排放量平均每年增长近6%。
研究指出,按照中国实现2060年净零排放目标的路径,若农业机械化程度按“预期趋势”继续提升,其相关排放在2050年可能占中国总排放量的21%。
作者表示,这可能会使中国实现减排目标更加困难,并导致空气质量“恶化”。
然而,研究还发现,如果广泛采用由可再生能源驱动的农业机械,有望减少65%至70%的相关排放。
一位未参与该研究的专家对Carbon Brief表示,尽管该研究“具有价值”,但农业机械不太可能在总排放量中占到如此高的比例。
“如果中国在减少其他排放源方面取得了快速进展……那么我预计在农业机械的脱碳方面也会取得显著成效。”她说。
农机相关排放
粮食系统大约占人类温室气体排放的三分之一。
这一数字涵盖了与粮食生产相关的所有排放——从因森林砍伐或土地使用变化导致的排放,到奶牛打嗝或粪便释放的甲烷。
这项新研究的数据来自《中国统计年鉴》,后者提供了各种社会经济指标的年度统计数据。研究者从中提取了中国农业机械的数量与功率、机械所用的燃料属性、耕地面积、人口等信息。
除了CO2排放量外,研究者还计算了三种与农业机械相关的空气污染物排放量:PM2.5(细颗粒物)、NOx(氮氧化物)和THC(总烃)。
研究者将农业机械分为四类:小型拖拉机、大型拖拉机、田间管理机械和收割机械。然后,他们计算了每类机械在每一年的CO2、PM2.5、NOx和THC排放量。
下图展示了1985年至2020年研究期间的CO2排放量。图中柱状表示不同类型农业机械的排放量:收割机械(浅蓝色)、田间管理机械(粉色)、小型拖拉机(浅绿色)和大型拖拉机(深绿色)。

他们发现,农业机械CO2排放总量已从1985年的约23MtCO2(1MtCO2=百万吨二氧化碳),增长到2020年的近160MtCO2,年均增长率为5.7%。
这相当于2020年中国总排放量的约1.5%。虽然比例不高,但作者指出,这一排放量实际上超过了部分国家的年排放总量,如荷兰、菲律宾和尼日利亚。
尤其是,大型拖拉机所带来的排放量自2005年以来平稳增长,作者将此归因于“一系列推动大型机械化的政策”。
未参与该研究的中山大学教授覃章才表示,该研究将农业机械排放从更广泛的食品系统中拆分出来“提供了独特的视角”。覃教授表示,该做法“使政策制定者能够在不影响农业生产力的情况下,设计有针对性的干预措施”。
区域分布
研究者还将排放数据细化到省级层面,发现不同地区农业机械排放量差异很大。排放量最低省份仅有约0.1MtCO2,而排放最高的省份则达到17.5MtCO2。
他们发现,中国东部和东北的五个省份——山东、河南、黑龙江、河北和安徽,占农业机械排放总量的40%以上。这些省份合计拥有全国三分之一的耕地面积和约46%的农机总动力。
然而,即使在这些高排放地区之间,机械类型的构成也存在差异,有些省份更依赖大型拖拉机,有些则以田间管理机械为主。
未参与该研究的《Our World in Data》副主编汉娜·里奇(Hannah Ritchie)博士表示,这种次国家级排放分析是该研究的关键进展之一。
里奇博士解释说:“这种排放估算的空间分辨率极具价值,因为在中国这样幅员辽阔的国家,各地排放差异显著。它还为未来在不同机械化程度和低碳技术采纳率下的潜在排放路径,提供了重要的洞见。”
增长因素
研究人员确定了四个推动排放增加的社会经济因素:人口增长、人均耕地面积变化、机械化水平以及排放强度。
下图展示了由排放强度(深蓝色)、机械化水平(浅蓝色)、人均耕地面积(黄色)和人口(橙色)的变化所导致的CO2排放量变化(黑色)。
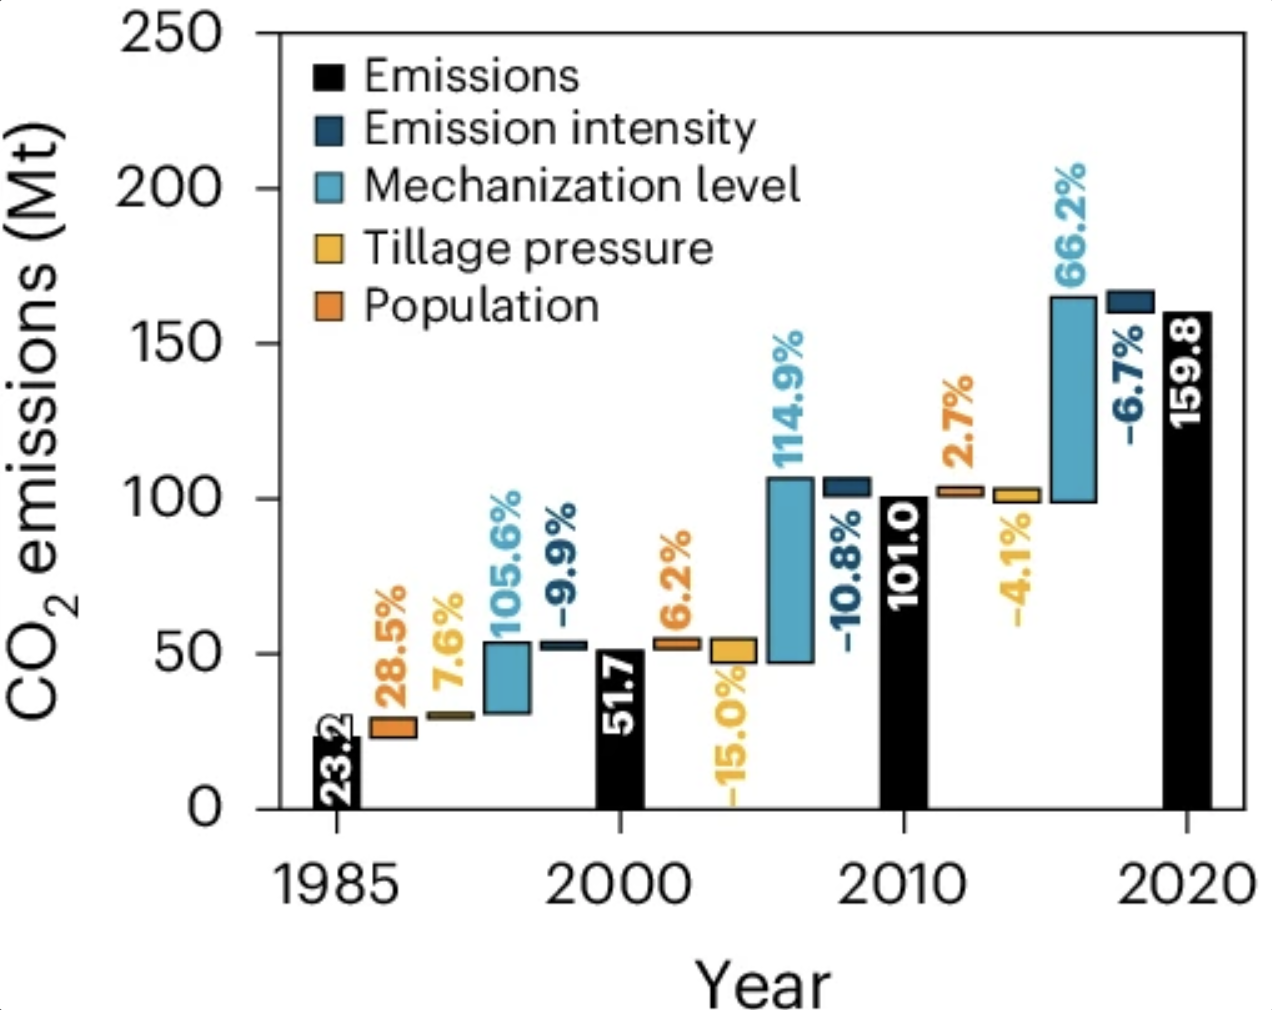
论文指出,在这些因素中,机械化水平的提升“主导”了排放变化。仅这些变化就导致1985年至2000年间排放量增加了约100%。
研究指出,人口增长也是研究区间早期农业机械排放量增长的重要驱动力,但自2000年以来,这一因素的影响有所减弱。
相比之下,作者指出,排放强度的上升总体上反而促使排放减少;而“耕作压力”在研究初期推动了排放上升,但自2000年起则转而起到抑制排放的作用。
碳排放目标
作者指出,根据现行政策,中国致力于“到2035年主要农作物生产实现全过程机械化”。
因此,他们警告称,若农业机械化持续增长且未加遏制,可能会对中国实现“双碳”目标构成挑战。(“双碳”目标指的是中国承诺在2030年前实现碳达峰,并在2060年前实现碳中和。)
作者指出,有效减排需在短期和长期分别采取不同策略,并强调从短期可用性来看,“生物燃料和天然气将在未来十年发挥重要作用”。
作者还认为,从长远来看,可再生能源以及绿氢“具有最大的减排潜力”。
此前研究表明,使用自动化设备、电动拖拉机和可再生能源可以减少90%的农业排放。
里奇表示,她“对农业机械的相对(排放量占比)在2050年能达到20%持一定怀疑态度”。
她补充道:“这基于一个假设,即这些排放大多不会减少,而其他大多数行业排放迅速下降。但如果中国在减少其他排放源,包括卡车等更大型的道路运输排放和其他农业排放方面取得快速进展……那么我预计在农业机械的脱碳方面也会取得显著成效。”


The post 中国农机排放量上升或“阻碍”净零目标实现 appeared first on Carbon Brief.
https://www.carbonbrief.org/translations-rising-emissions-from-farm-equipment-could-hinder-chinas-net-zero-goals/

Drought and heatwaves occurring together – known as “compound” events – have “surged” across the world since the early 2000s, a new study shows.
Compound drought and heat events (CDHEs) can have devastating effects, creating the ideal conditions for intense wildfires, such as Australia’s “Black Summer” of 2019-20 where bushfires burned 24m hectares and killed 33 people.
The research, published in Science Advances, finds that the increase in CDHEs is predominantly being driven by events that start with a heatwave.
The global area affected by such “heatwave-led” compound events has more than doubled between 1980-2001 and 2002-23, the study says.
The rapid increase in these events over the last 23 years cannot be explained solely by global warming, the authors note.
Since the late 1990s, feedbacks between the land and the atmosphere have become stronger, making heatwaves more likely to trigger drought conditions, they explain.
One of the study authors tells Carbon Brief that societies must pay greater attention to compound events, which can “cause severe impacts on ecosystems, agriculture and society”.
Compound events
CDHEs are extreme weather events where drought and heatwave conditions occur simultaneously – or shortly after each other – in the same region.
These events are often triggered by large-scale weather patterns, such as “blocking” highs, which can produce “prolonged” hot and dry conditions, according to the study.
Prof Sang-Wook Yeh is one of the study authors and a professor at the Ewha Womans University in South Korea. He tells Carbon Brief:
“When heatwaves and droughts occur together, the two hazards reinforce each other through land-atmosphere interactions. This amplifies surface heating and soil moisture deficits, making compound events more intense and damaging than single hazards.”
CDHEs can begin with either a heatwave or a drought.
The sequence of these extremes is important, the study says, as they have different drivers and impacts.
For example, in a CDHE where the heatwave was the precursor, increased direct sunshine causes more moisture loss from soils and plants, leading to a drought.
Conversely, in an event where the drought was the precursor, the lack of soil moisture means that less of the sun’s energy goes into evaporation and more goes into warming the Earth’s surface. This produces favourable conditions for heatwaves.
The study shows that the majority of CDHEs globally start out as a drought.
In recent years, there has been increasing focus on these events due to the devastating impact they have on agriculture, ecosystems and public health.
In Russia in the summer of 2010, a compound drought-heatwave event – and the associated wildfires – caused the death of nearly 55,000 people, the study notes.

The record-breaking Pacific north-west “heat dome” in 2021 triggered extreme drought conditions that caused “significant declines” in wheat yields, as well as in barley, canola and fruit production in British Columbia and Alberta, Canada, says the study.
Increasing events
To assess how CDHEs are changing, the researchers use daily reanalysis data to identify droughts and heatwaves events. (Reanalysis data combines past observations with climate models to create a historical climate record.) Then, using an algorithm, they analyse how these events overlap in both time and space.
The study covers the period from 1980 to 2023 and the world’s land surface, excluding polar regions where CDHEs are rare.
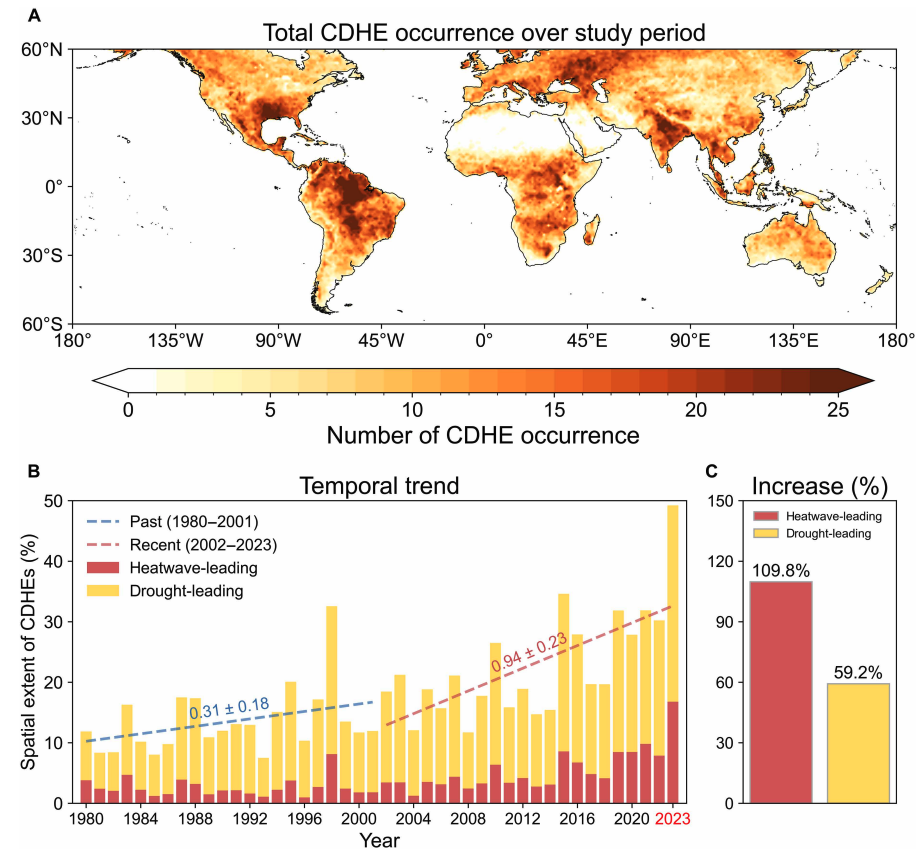
The research finds that the area of land affected by CDHEs has “increased substantially” since the early 2000s.
Heatwave-led events have been the main contributor to this increase, the study says, with their spatial extent rising 110% between 1980-2001 and 2002-23, compared to a 59% increase for drought-led events.
The map below shows the global distribution of CDHEs over 1980-2023. The charts show the percentage of the land surface affected by a heatwave-led CDHE (red) or a drought-led CDHE (yellow) in a given year (left) and relative increase in each CDHE type (right).
The study finds that CDHEs have occurred most frequently in northern South America, the southern US, eastern Europe, central Africa and south Asia.
Threshold passed
The authors explain that the increase in heatwave-led CDHEs is related to rising global temperatures, but that this does not tell the whole story.
In the earlier 22-year period of 1980-2001, the study finds that the spatial extent of heatwave-led CDHEs rises by 1.6% per 1C of global temperature rise. For the more-recent period of 2022-23, this increases “nearly eightfold” to 13.1%.
The change suggests that the rapid increase in the heatwave-led CDHEs occurred after the global average temperature “surpasse[d] a certain temperature threshold”, the paper says.
This threshold is an absolute global average temperature of 14.3C, the authors estimate (based on an 11-year average), which the world passed around the year 2000.
Investigating the recent surge in heatwave-leading CDHEs further, the researchers find a “regime shift” in land-atmosphere dynamics “toward a persistently intensified state after the late 1990s”.
In other words, the way that drier soils drive higher surface temperatures, and vice versa, is becoming stronger, resulting in more heatwave-led compound events.
Daily data
The research has some advantages over other previous studies, Yeh says. For instance, the new work uses daily estimations of CDHEs, compared to monthly data used in past research. This is “important for capturing the detailed occurrence” of these events, says Yeh.
He adds that another advantage of their study is that it distinguishes the sequence of droughts and heatwaves, which allows them to “better understand the differences” in the characteristics of CDHEs.
Dr Meryem Tanarhte is a climate scientist at the University Hassan II in Morocco, and Dr Ruth Cerezo Mota is a climatologist and a researcher at the National Autonomous University of Mexico. Both scientists, who were not involved in the study, agree that the daily estimations give a clearer picture of how CDHEs are changing.
Cerezo-Mota adds that another major contribution of the study is its global focus. She tells Carbon Brief that in some regions, such as Mexico and Africa, there is a lack of studies on CDHEs:
“Not because the events do not occur, but perhaps because [these regions] do not have all the data or the expertise to do so.”
However, she notes that the reanalysis data used by the study does have limitations with how it represents rainfall in some parts of the world.
Compound impacts
The study notes that if CDHEs continue to intensify – particularly events where heatwaves are the precursors – they could drive declining crop productivity, increased wildfire frequency and severe public health crises.
These impacts could be “much more rapid and severe as global warming continues”, Yeh tells Carbon Brief.
Tanarhte notes that these events can be forecasted up to 10 days ahead in many regions. Furthermore, she says, the strongest impacts can be prevented “through preparedness and adaptation”, including through “water management for agriculture, heatwave mitigation measures and wildfire mitigation”.
The study recommends reassessing current risk management strategies for these compound events. It also suggests incorporating the sequences of drought and heatwaves into compound event analysis frameworks “to enhance climate risk management”.
Cerezo-Mota says that it is clear that the world needs to be prepared for the increased occurrence of these events. She tells Carbon Brief:
“These [risk assessments and strategies] need to be carried out at the local level to understand the complexities of each region.”



The post Heatwaves driving recent ‘surge’ in compound drought and heat extremes appeared first on Carbon Brief.
Heatwaves driving recent ‘surge’ in compound drought and heat extremes
Greenhouse Gases
DeBriefed 6 March 2026: Iran energy crisis | China climate plan | Bristol’s ‘pioneering’ wind turbine
Welcome to Carbon Brief’s DeBriefed.
An essential guide to the week’s key developments relating to climate change.
This week
Energy crisis
ENERGY SPIKE: US-Israeli attacks on Iran and subsequent counterattacks across the Middle East have sent energy prices “soaring”, according to Reuters. The newswire reported that the region “accounts for just under a third of global oil production and almost a fifth of gas”. The Guardian noted that shipping traffic through the strait of Hormuz, which normally ferries 20% of the world’s oil, “all but ground to a halt”. The Financial Times reported that attacks by Iran on Middle East energy facilities – notably in Qatar – triggered the “biggest rise in gas prices since Russia’s full-scale invasion of Ukraine”.
‘RISK’ AND ‘BENEFITS’: Bloomberg reported on increases in diesel prices in Europe and the US, speculating that rising fuel costs could be “a risk for president Donald Trump”. US gas producers are “poised to benefit from the big disruption in global supply”, according to CNBC. Indian government sources told the Economic Times that Russia is prepared to “fulfil India’s energy demands”. China Daily quoted experts who said “China’s energy security remains fundamentally unshaken”, thanks to “emergency stockpiles and a wide array of import channels”.
‘ESSENTIAL’ RENEWABLES: Energy analysts said governments should cut their fossil-fuel reliance by investing in renewables, “rather than just seeking non-Gulf oil and gas suppliers”, reported Climate Home News. This message was echoed by UK business secretary Peter Kyle, who said “doubling down on renewables” was “essentia