

Countries’ climate plans would cut global emissions only half as much by 2035 as the UN projected a year ago, its annual assessment showed, after the US exit from the Paris Agreement and weaker new pledges worsened the outlook.
Taking into account the nationally determined contributions (NDCs) of 154 countries, which cover about 71% of global emissions, and current policies in the rest of the world, global emissions would fall to about 6% below 2019 levels by 2035. Last year’s update, based on 113 countries, put the figure at 12%.
According to the Intergovernmental Panel on Climate Change, emissions need to go down by 60% over the same period to limit global warming to 1.5C – a threshold that is now inevitably going to be breached, at least temporarily.
The latest NDCs put the world on course for between 2.1C and 3.2C of warming by the end of the century, depending on what countries do beyond 2035. That is slightly higher than the 1.9C–3.0C range that the UN climate body estimated in last year’s update, published during COP30.
-
Early speakers’ list suggests few powerful leaders will attend COP31
Just 77 heads of state or government are scheduled to address the COP31 climate summit in Antalya, a third less than the COP28 peak -
Paris Agreement committee names three countries snubbing it over NDCs
More than 30 countries have failed to submit an NDC, but only three have repeatedly ignored the committee’s efforts to engage with them


US exit worsens picture
A major factor is the US, the world’s second-largest emitter. Last year’s UN assessment included the pledge to cut emissions by between 61% and 66% by 2035, made under the administration of former President Joe Biden.
But, since the US has officially left the Paris Agreement, its NDC has been excluded from the tally and its emissions projections have now been derived from current policies, which point to far higher levels of pollution.
US emissions grew significantly last year as a result of growing electricity demand and the policies of President Donald Trump’s administration, which has rolled back support for clean energy and backed the burning of fossil fuels.
Weak new NDCs
Another reason for weaker emission reduction projections is that the approximately 40 new NDCs submitted since last year’s update have been less ambitious than the earlier UN modelling had hoped for.
India, the world’s third-largest emitter, submitted its NDC in April. Its plan would let emissions climb to 6.3 billion tonnes by 2035, almost 64% above 2023 levels, according to analysis by Climate Action Tracker (CAT). Its targets are weaker than India’s current policies and it could meet them as early as 2030.
-
Turkish giant sponsoring COP31 cut climate goals then cashed in on oil boom
COP31 sponsors should be screened for “climate integrity”. Yet Koç Holding has become a top partner while its oil refiner runs flat out and its climate targets slip -
Early speakers’ list suggests few powerful leaders will attend COP31
Just 77 heads of state or government are scheduled to address the COP31 climate summit in Antalya, a third less than the COP28 peak -
UK approves gas drilling despite admitting blow to “climate leadership” status
The government accepts that approving the Jackdaw field will weaken its climate reputation and downplays the legal weight of the International Court of Justice opinion

Saudi Arabia’s plan, submitted at the end of last year, sets no 2035 target, but has only a 2040 goal to reduce, avoid or remove 335 million tonnes a year against an undisclosed baseline. CAT rates it “critically insufficient”, estimating 2035 emissions at between 13% below and 18% above 2019 levels.
About 30 countries, including Egypt, Vietnam and Argentina, have still not produced an updated NDC, which all governments should have submitted more than a year and a half ago.
UN climate chief Simon Stiell said this year’s assessment report demonstrates again that collective progress remains insufficient, that global transitions are very uneven and that many countries face substantial barriers to delivering their targets and pledges.
He added that COP31 in Türkiye can help address some of the key gaps highlighted in this year’s reports, through ambitious outcomes on emission-cutting efforts, adaptation, climate finance and just transitions, as well as presidency-led initiatives on electrification, curbing methane emissions and progressing towards zero waste.
The post National climate plans now promise half the emission cuts expected by UN appeared first on Climate Home News.
National climate plans now promise half the emission cuts expected by UN

Greenland has now marked the 30th consecutive year where it lost more ice than it gained.
This guest post is by:
Dr Martin Stendel, climate scientist at the Danish Meteorological Institute (DMI), part of the Polar Portal
Prof Ruth Mottram, climate scientist at DMI and honorary professor at Aarhus University
Over the 12-month period to August 2026, the world’s second-largest ice sheet lost around 135bn tonnes of ice.
This major ice loss came as the region experienced a relatively cool start to summer and less surface melt than in previous years.
In other words, it was not an “extreme” year for weather in Greenland – and, yet, the ice sheet ended firmly in the red.
Three decades of continuous ice loss in Greenland is significant, given that scientists typically need 30 years of data to separate the “fingerprint” of human-caused climate change from natural variations in the climate.
In Greenland, the direction of travel has been the same – downward – every single year for 30 years.
These latest figures come as a new report highlights that ice melting processes seen for decades in Greenland are increasingly being replicated in Antarctica.
Greenland, therefore, is not only the largest present-day source of ice-driven sea level rise – but offers a preview of what is in store for the world’s largest ice sheet.
(For our previous analyses of Greenland’s ice cover, see coverage in 2025, 2024, 2023, 2022, 2021, 2020, 2019, 2018, 2017, 2016 and 2015.)
Surface mass balance
One way that scientists track the health of the Greenland ice sheet is by tracking changes to its “surface mass balance”.
This is the difference between ice gains from snowfall and losses from melt at the surface of Greenland’s ice sheet.
Greenland’s annual ice cycle runs from 1 September through to the end of August. The surface mass balance at the end of this period has, to date, always been positive, because the surface accumulates more snow than it loses from melting ice.
The ice sheet typically gains mass during the colder months of autumn, winter and spring. Then, as temperatures increase from around mid-June, the ice sheet begins to lose more ice through surface melt than it gains from snow.
(Greenland also loses ice when icebergs break off – or “calve” – into the sea, as well when the front of glaciers melt when they meet warm sea water. These losses are included in the “total mass balance” – see below.)
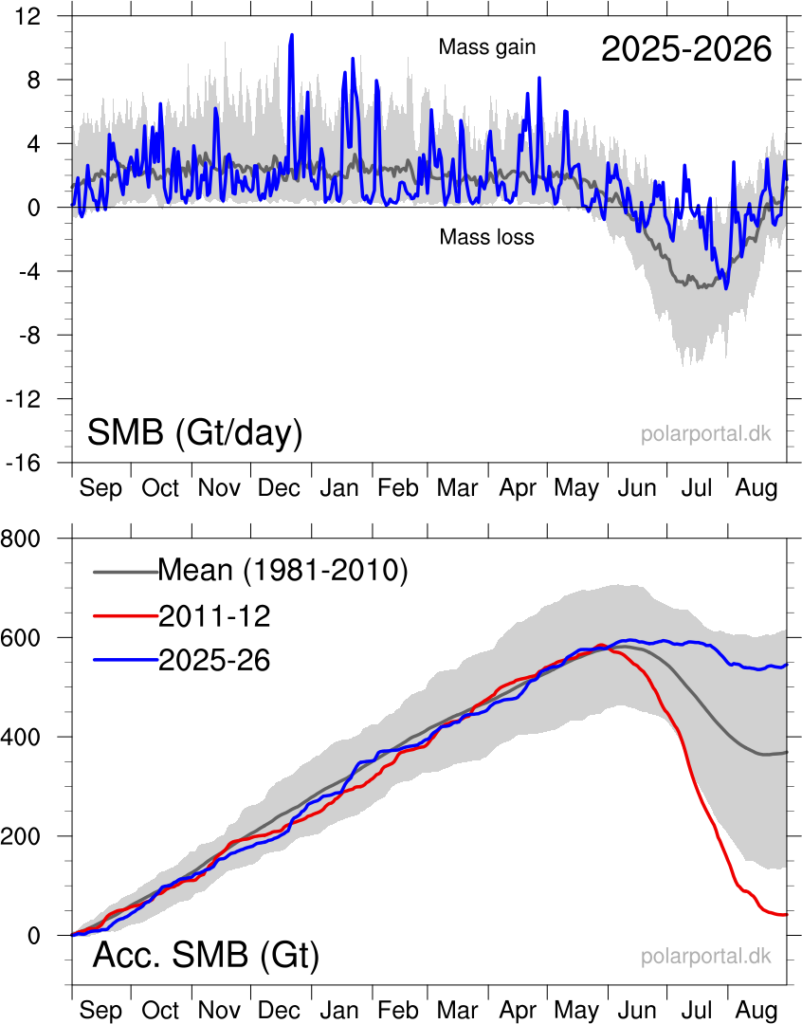
Greenland ended 2025-26 with an overall surface mass balance of 519bn tonnes.
This is the sixth highest in a dataset stretching back 46 years and about 178bn tonnes above the 1981-2010 average of roughly 350bn tonnes.
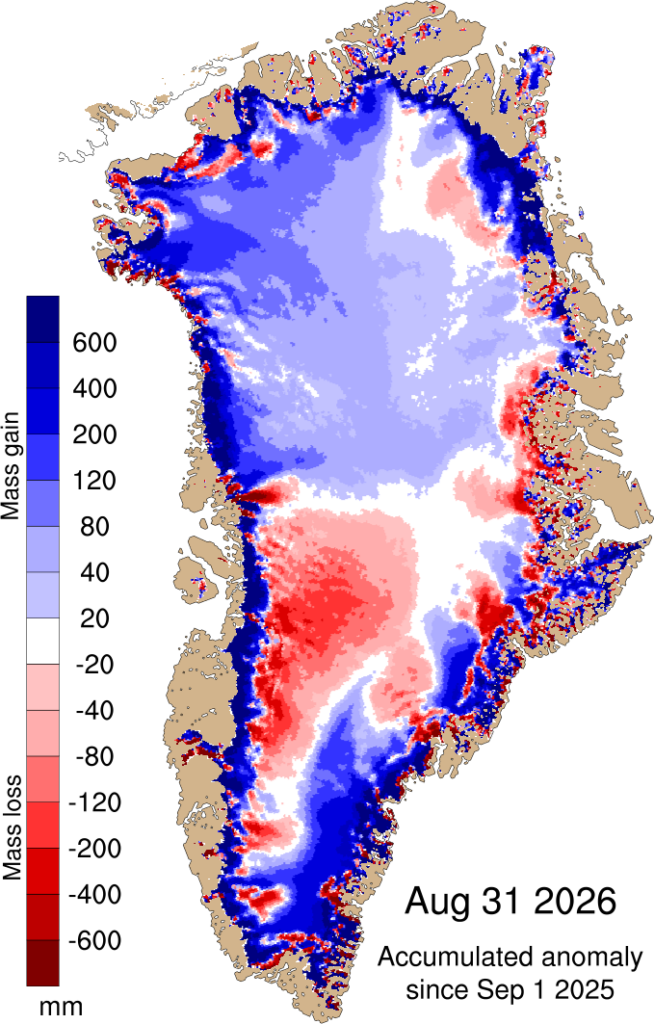
The map below shows the difference between the surface mass balance in 2025-26 and the 1981-2010 average, where blue shows ice gain and red shows ice loss.
The blue lines in the charts below show the surface mass balance throughout 2025-26 for individual days (top) and cumulatively throughout the year (bottom). They highlight how Greenland gained ice between September 2025 and May 2026, before starting to lose ice from June onwards.
Total mass balance
Another way scientists measure the health of the Greenland ice sheet is by looking at its “total mass balance”.
This calculation accounts for ice loss at the surface, as well as the calving of icebergs and the melting of glacier fronts where they meet warm seawater. The latter two components are known as the “marine mass balance”.
It also accounts for a small amount of ice melt at the underside of the ice sheet. This is known as the “basal mass balance”.
In recent decades, Greenland’s total mass balance at the end of the ice cycle year has been negative.
The 12 months to August 2026 were no different. Once all these factors are considered, Greenland lost around 135bn tonnes of ice.
We reached this figure using the same method featured in previous Carbon Brief analyses of Greenland ice cover. This approach is based on an average of three climate models.