Greenhouse Gases
Guest post: The challenges in projecting future global sea levels
It is well understood that human-caused climate change is causing sea levels to rise around the world.
Since 1901, global sea levels have risen by at least 20cm – accelerating from around 1mm a year for much of the 20th century to 4mm a year over 2006-18.
Sea level rise has significant environmental and social consequences, including coastal erosion, damage to buildings and transport infrastructure, loss of livelihoods and ecosystems.
The Intergovernmental Panel on Climate Change (IPCC) has said it is “virtually certain” that sea level will continue to rise during the current century and beyond.
But what is less clear is exactly how quickly sea levels could climb over the coming decades.
This is largely due to challenges in calculating the rate at which land ice in Antarctica – the world’s largest store of frozen freshwater – could melt.
In this article, we unpack some of the reasons why projecting the speed and scale of future sea level rise is difficult.
Drivers of sea level rise
There are three principal components of sea level rise.
First, as the ocean warms, water expands. This process is known as thermal expansion, a comparatively straightforward physical process.
Second, more water gets added to the oceans when the ice contained in glaciers and ice sheets on land melts and flows into the sea.
Third, changes in rainfall and evaporation – as well as the extraction of groundwater for drinking and irrigation, drainage of wetlands and construction of reservoirs – affect how much water is stored on land.
In its sixth assessment cycle (AR6), the IPCC noted that thermal expansion and melting land ice contributed almost equally to sea level rise over the past century. Changes in land water storage, on the other hand, played a minor role.
However, the balance between these three drivers is shifting.
The IPCC projects that the contribution of melting land ice – already the largest contributor to sea level rise – will increase over the coming decade as the world continues to warm.
The lion’s share of the Earth’s remaining land ice – 88% – is in Antarctica, with Greenland accounting for almost all of the rest. (Mountain glaciers in the Himalaya, Alps and other regions collectively account for less than 1% of total land ice.)
However, it is difficult to project exactly how much Antarctic ice will make its way into the sea between now and 2100.
As a result, IPCC projections cover a large range of outcomes for future sea level rise.
In AR6, the IPCC said sea levels would “likely” be between 44-76cm higher by 2100 than the 1995-2014 average under a medium-emissions scenario. However, it noted that sea level rise above this range could not be ruled out due to “deep uncertainty linked to ice sheet processes”.
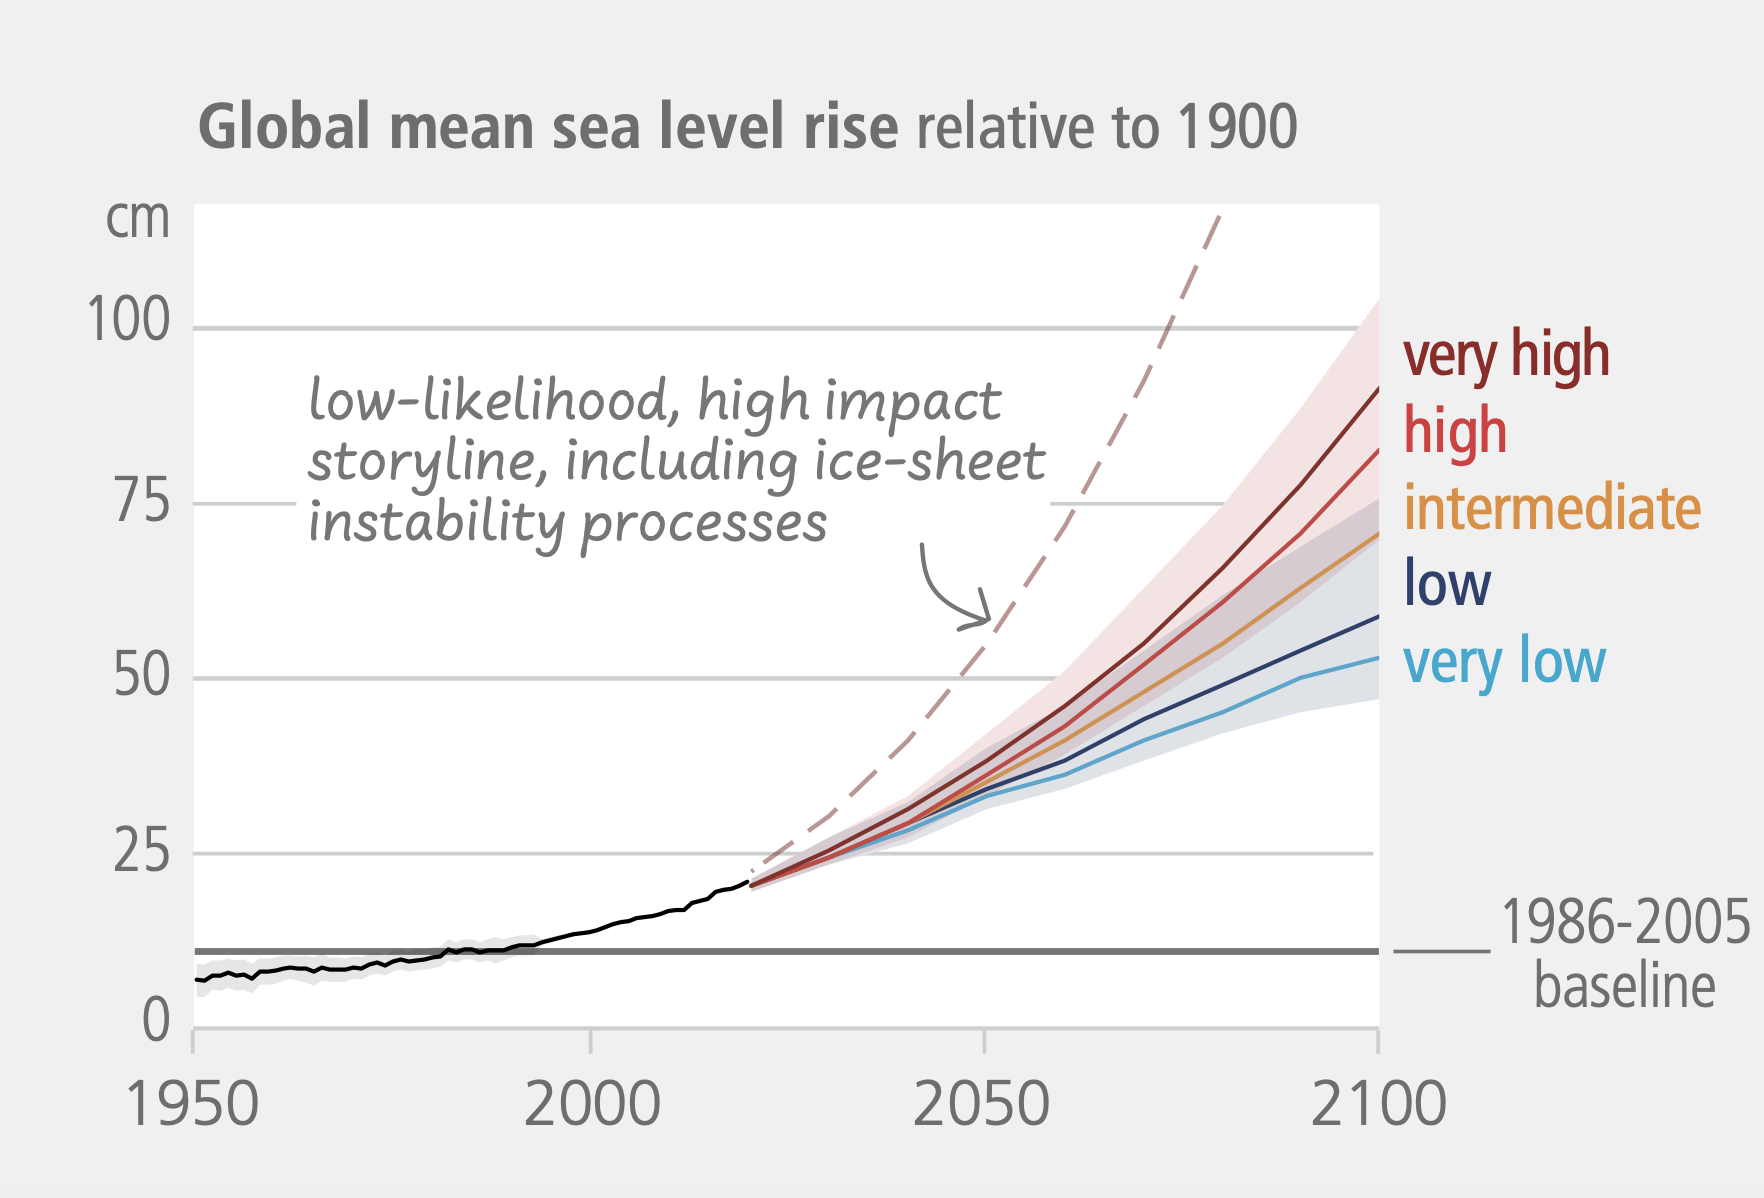
The chart below illustrates the wide range of sea level rise projected by the IPCC under different warming scenarios (coloured lines) as well as a possible – but unlikely – worst-case scenario (dotted line).
The shaded areas represent the “likely range” of sea level rise under each warming scenario, calculated by analysing processes that are already well understood. The worst-case scenario dotted line represents a future where various poorly understood processes combine to lead to a very rapid increase in sea levels.
The graph shows that sea level rise increases with warming – and would climb most sharply under the “low-likelihood, high-impact” pathway.

Retreat of glacier grounding lines
In Antarctica, the melting of ice on the surface of glaciers is limited. In many locations, warmer temperatures are leading to increases in snowfall and greater snow accumulation, which means the surface of the ice is continuously gaining mass.
Most of Antarctica’s contribution to global sea level rise is, therefore, not linked to ice melt at the surface. Instead, it occurs when giant glaciers push from land into the sea, propelled downhill by gravity and their own immense weight.
These huge masses of ice first grind downhill across the land and then along the seafloor. Eventually, they detach from the bedrock and start to float.
These floating ice shelves then largely melt from below, as warm ocean water intrudes into cavities on its underside. This is known as “basal melting”.
The boundary between grounded and floating ice is known as the “grounding line”.
In many regions of Antarctica, grounding lines typically sit at the high point of the bedrock, with the ice sheet deepening inland. This is illustrated in the graphic below.

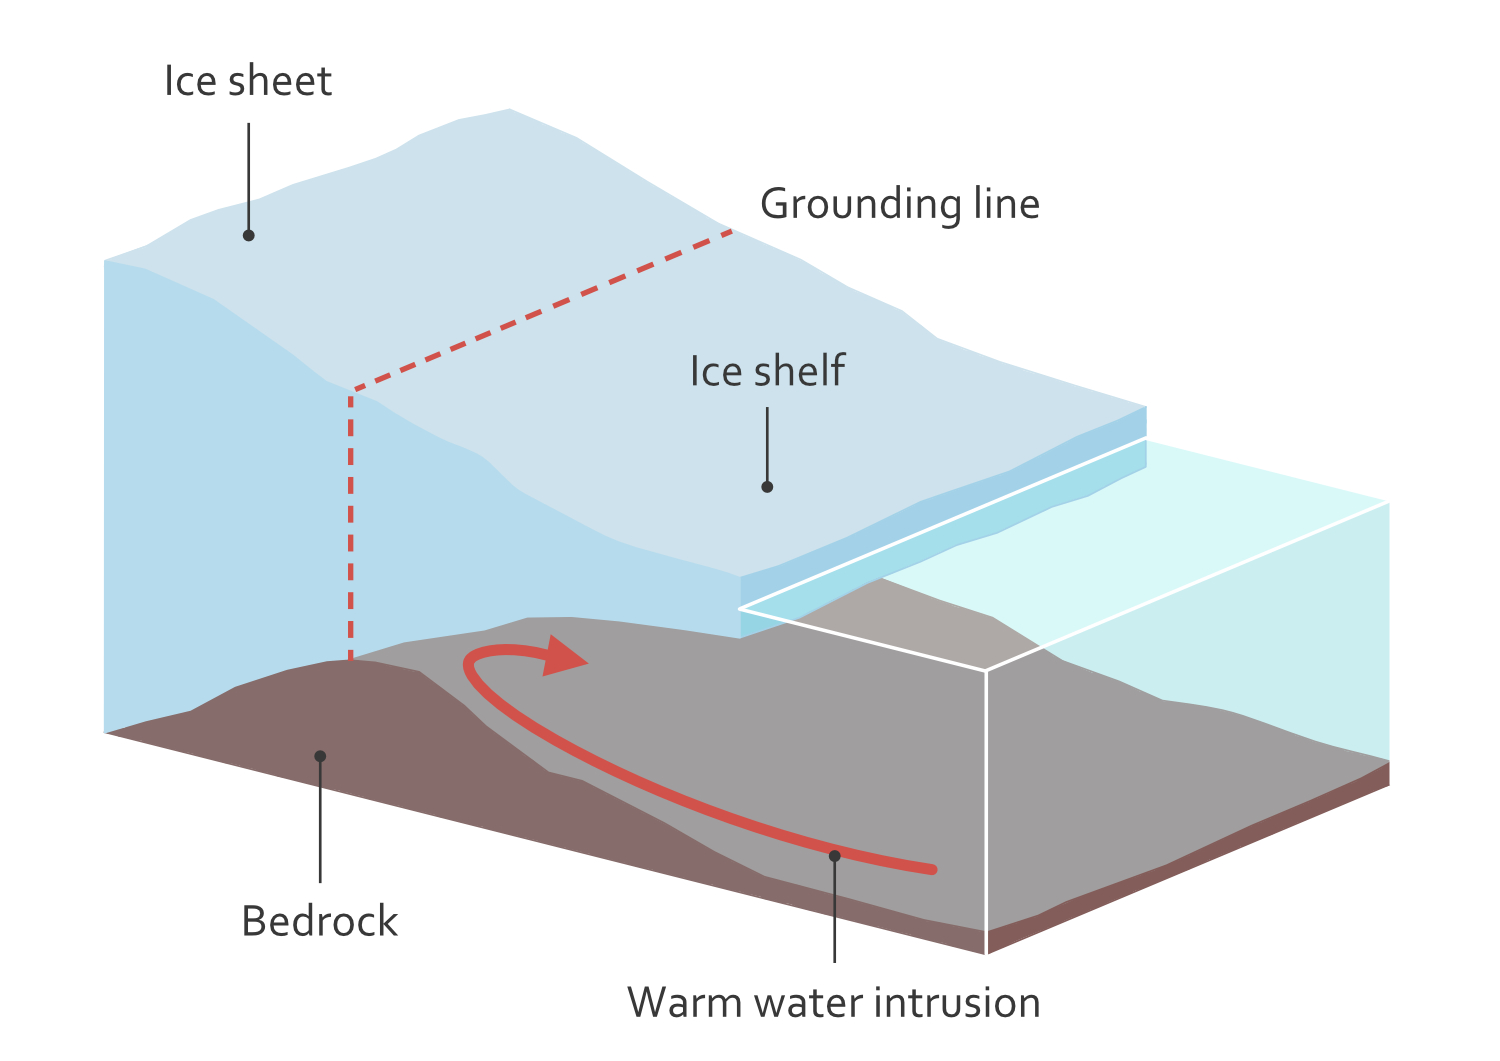
When a grounding line is at a high point of the bedrock, it acts as a block which limits the area of ice exposed to basal melting.
However, if the grounding line retreats further inland, warm water could “spill” over the high point in the bedrock and carve out large cavities below the ice. This could dramatically accelerate the retreat of grounding lines further inland across Antarctica.
There is evidence to suggest that the retreat of grounding lines might cause a runaway effect, in which each successive retreat causes the ice behind the line to detach from the land even more quickly.
Recent climate modelling suggests that many grounding lines are not yet in runaway retreat – but some regions of Antarctica are close enough to thresholds that tiny increases in basal melting push model runs toward very different outcomes.
Whether – and to what extent – grounding lines might retreat will depend on a wide range of factors, including the exact shape of the bedrock beneath the ice. However, the bedrock on the coast of Antarctica has not yet been precisely mapped in many places.
Ice shelves
Once Antarctic ice detaches from the seabed, it floats on the ocean surface. These floating ice shelves slow the flow of ice from land towards the sea, acting as a brake as they wedge between headlands and little hills on the seafloor.
If these ice shelves break apart, the flow of glaciers towards the sea can accelerate.
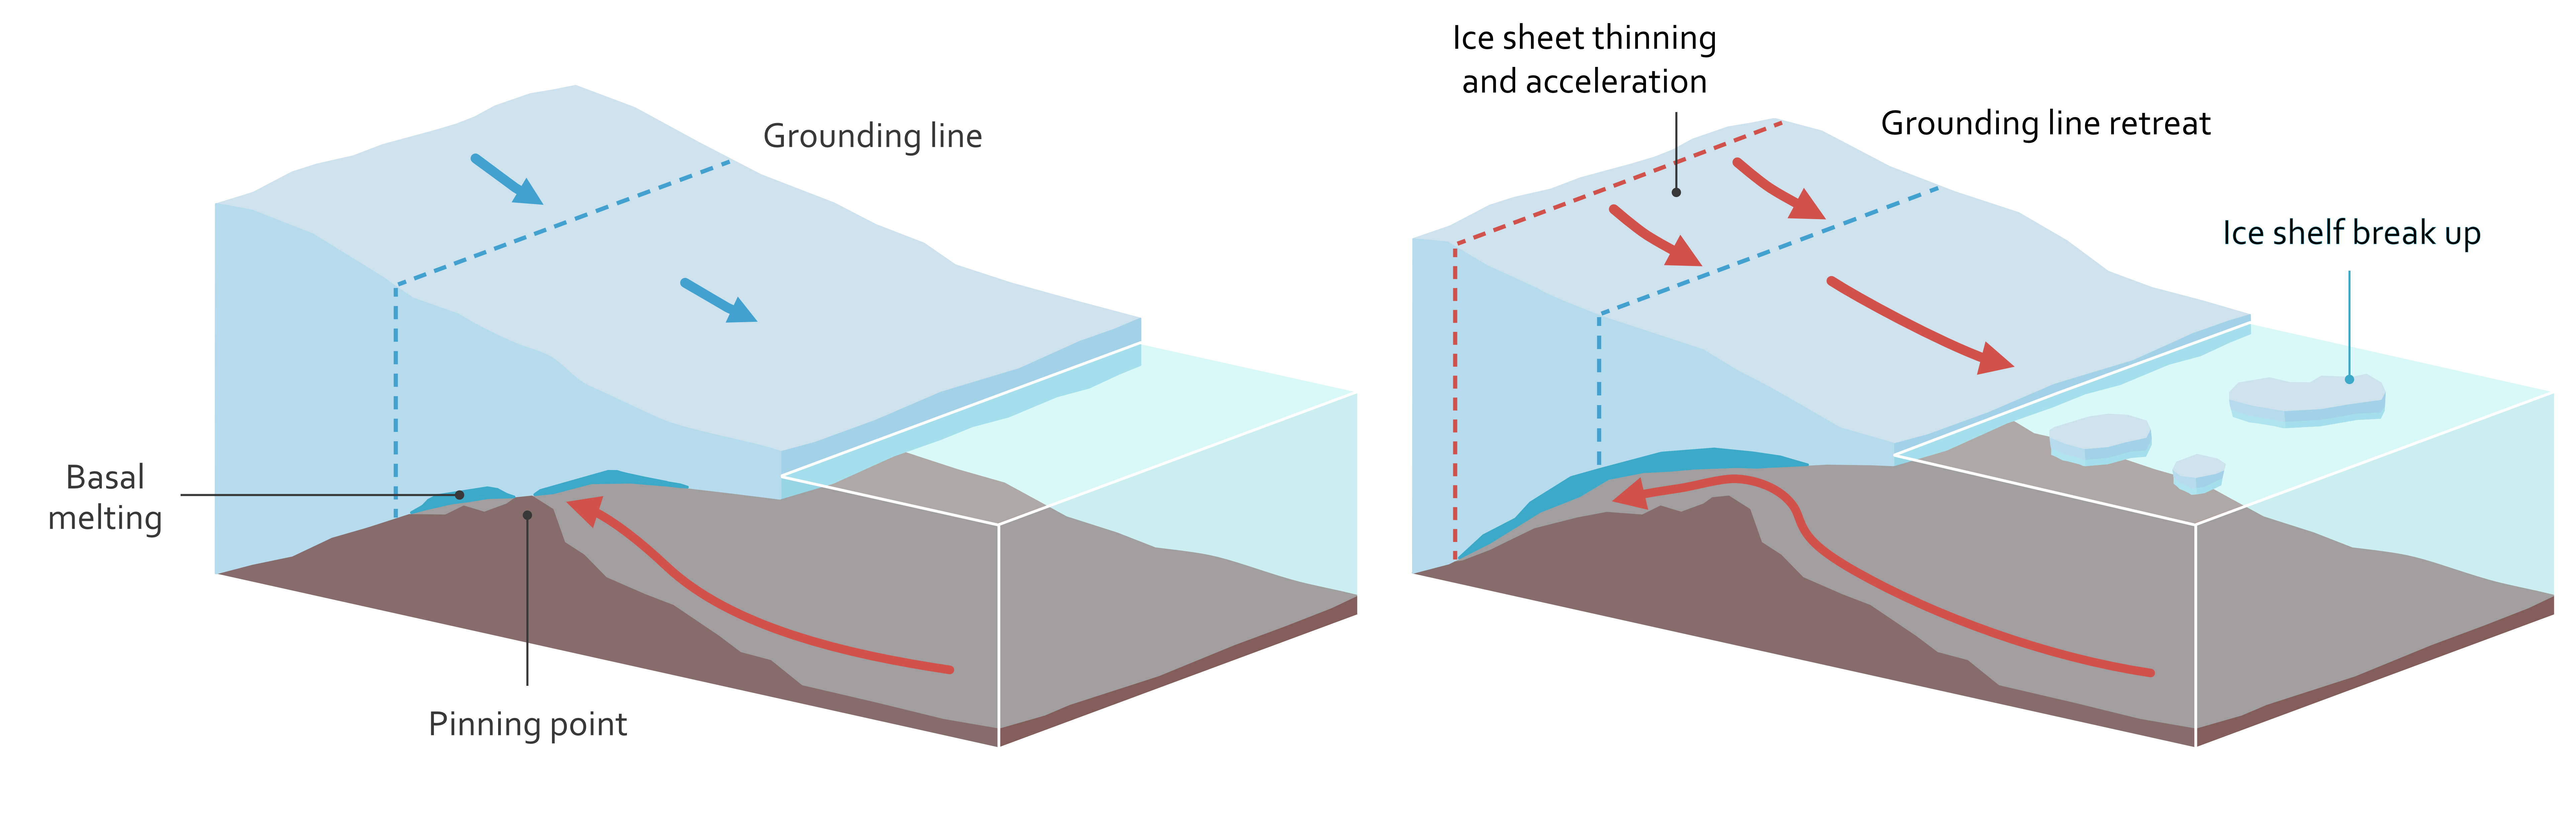
The image below on the left shows a present-day ice shelf that is pinned in place by bedrock, which slows the flow of the ice into the sea.
The image on the right shows a future scenario in which ocean water continues to intrude under the ice, accelerating basal melting on the underside of the floating ice until it completely detaches from the “pinning point” that had previously held it in place.
In this scenario, the bedrock is no longer acting as a break on glaciers pushing to the sea and the ice shelf starts flowing into the sea more quickly and begins breaking up. Ice masses inland then begin to push more rapidly towards the sea.

This dynamic was directly observed during the collapse of the Larsen-B ice shelf on the Antarctic Peninsula in 2002, which led to accelerated glacial ice flow and is believed to have contributed to a dramatic glacial retreat two decades later.
However, the factors affecting the stability of the floating ice shelves around Antarctica’s coast are complex. The strength of ice shelves depends on their thickness, how and where they are pinned to the seafloor, how cracks grow, as well as air and sea temperatures and levels of snow and rainfall. For example, meltwater at the surface can lever cracks further apart, in a process known as hydrofracturing.
A 2024 review of the stability of ice shelves found big gaps in scientific understanding of these processes. There is currently no scientific consensus on how rapidly various ice shelves might collapse – the pace is likely to vary greatly from one ice shelf to the next.
Ice-cliff collapse
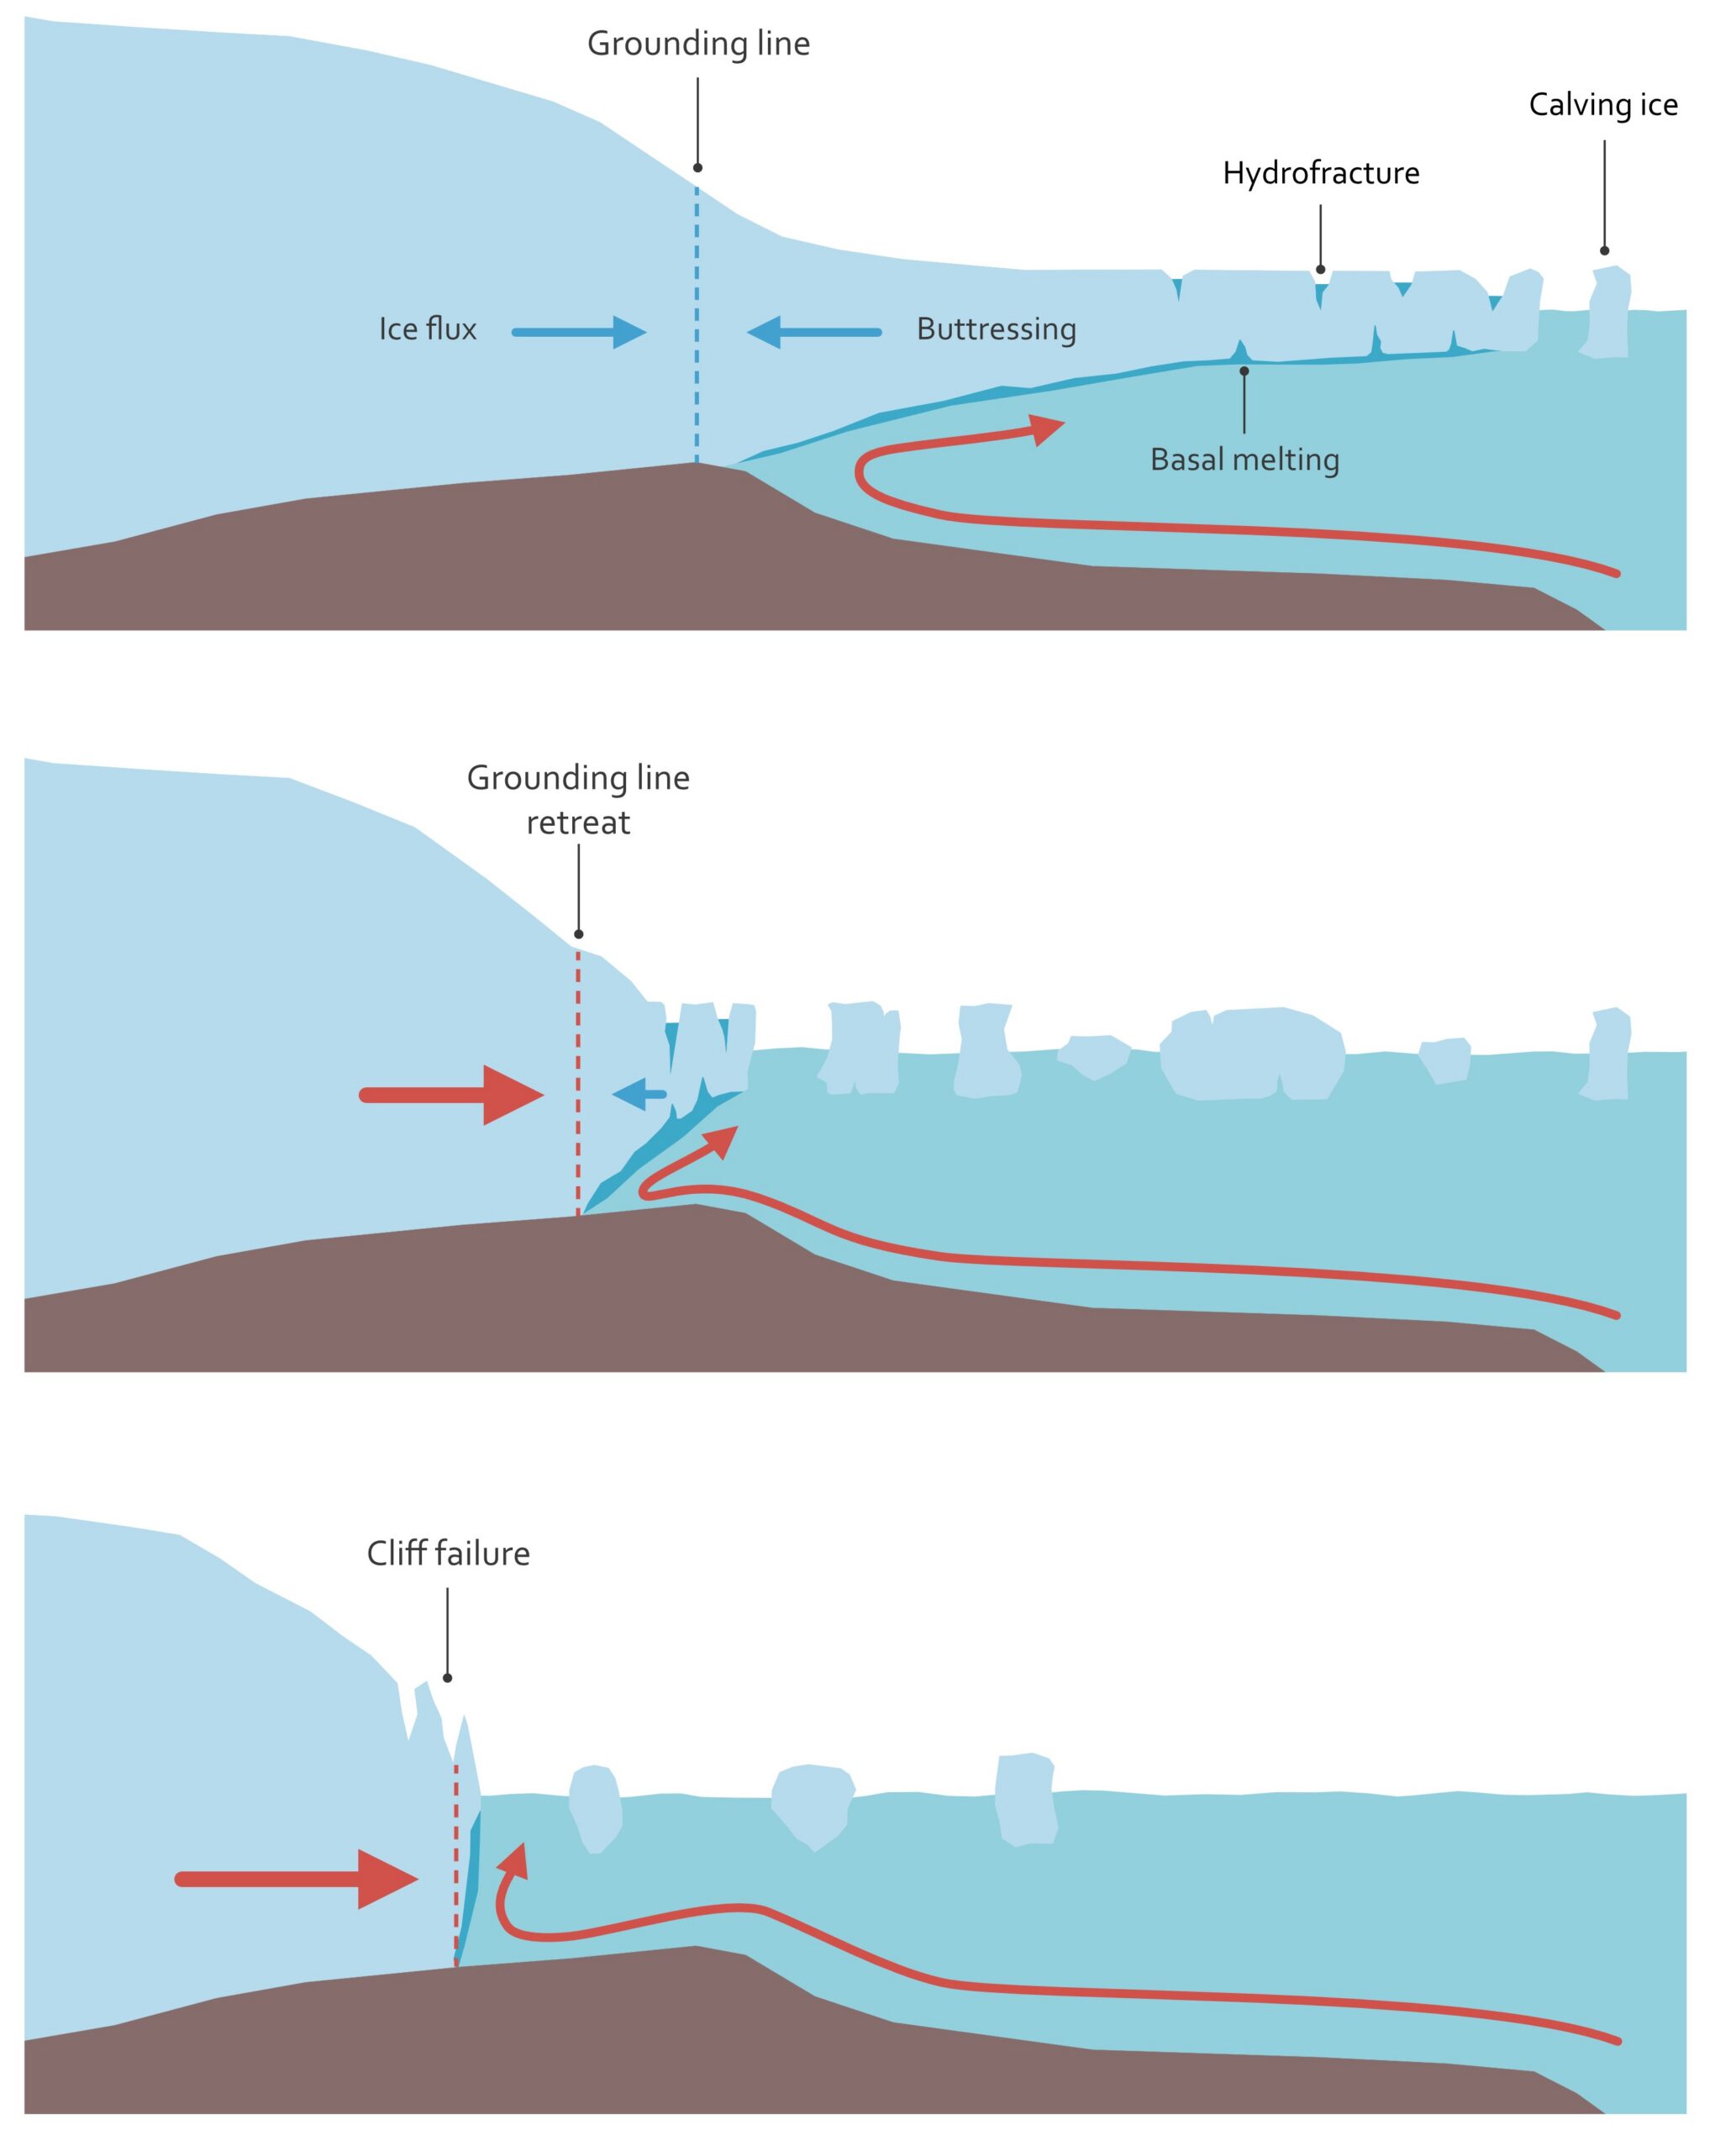
If, and when, ice shelves collapse and drift away from the coast, they will expose the towering ice cliffs that loom behind them directly to the sea. These ice cliffs can be more than 100 metres tall.
This exposure could potentially lead to those cliffs to become structurally unstable and collapse in a runaway process – further accelerating the advance of the glaciers pushing towards the sea.
The images below illustrate how such a collapse might unfold. In the top image, a floating ice shelf buttresses the ice masses behind it. In the middle image, the ice shelf has largely broken apart and melted into the sea. In the bottom image, the ice shelf has completely disappeared, leaving a steep wall of ice towering over the sea. At this point, the exposed cliffs might collapse and crash into the water below.

Researchers are still debating whether or not this “marine ice cliff instability” is likely to happen this century.
Modelling ocean dynamics
The speed at which grounding lines retreat, ice shelves collapse and ice cliffs cascade into the sea partially depends on complex ocean dynamics.
The temperature and speed of water intrusion underneath the ice depends on multiple factors, including ocean currents, winds, sea ice, underwater ridges and eddies. These factors vary from one location to the next and can vary by season and by year.
Once water reaches a given cavity, the ways in which turbulent flows and fresh meltwater plumes meet the ice can significantly affect melt levels – further complicating the picture.
In other words, predicting future melt depends on models that integrate macro-level ocean circulation with local-level turbulence. This remains a major modelling challenge that, despite ongoing progress, is unlikely to be conclusively resolved any time soon.
Planning for future sea level rise
Scientists agree that human-caused climate change is causing sea levels to rise and that the oceans will continue to rise during the current century and far beyond.
However, the combination of the complexity of modelling ice-ocean interactions and the threat of potential runaway processes means that, for the foreseeable future, there is considerable uncertainty about the magnitude of future sea level rise.
(While this article focuses on Antarctica, it is worth noting that Greenland’s contribution to future sea level rise is also highly uncertain.)
To complicate matters further, the ocean does not rise like water in a bathtub, creeping up equally on all sides. Instead the Earth’s surface is highly dynamic.
For example, during the last ice age, the immense mass of the glaciers that covered much of northern Europe pressed the Earth’s surface downwards. Even though most of that ice disappeared millennia ago, much of Scandinavia is still rebounding today, causing the land to rise gradually.
In contrast, the city of Jakarta in Indonesia is sinking at a rapid pace of 10cm per year due to sprawling urbanisation and extraction of groundwater for household and industrial uses. That rate may increase or decrease over the coming decades, depending on urban planning and water management decisions.
This mix of natural and human-driven factors means that, even if researchers could perfectly predict average global sea level rise, calculating how much the sea will rise in any given location will remain challenging.
Another key unknown is around future levels of human-caused greenhouse gas emissions which drive climate change.
The scientific community is working to better understand the dynamics driving sea level rise and improve predictions, including through Antarctic sea bed mapping, field observations and improved models. Those advances in knowledge will not erase uncertainty, but they could reduce the range of possible outcomes.
Nevertheless, while that range may narrow, it will not completely disappear.
Plans drawn up by policymakers and engineers to prepare society for future sea level rise should never be based on a single point estimate.
Instead, they should take into account a range of possible “likely” outcomes – and include contingency plans for less likely, but entirely possible, scenarios in which the oceans rise far faster than currently expected.
The post Guest post: The challenges in projecting future global sea levels appeared first on Carbon Brief.
Guest post: The challenges in projecting future global sea levels