Ocean Acidification
Color Science and Ocean Cores

Color Theory
Look at this core below (figure 1) and describe the colors and values you see.
Fig. 1) A small section of core: 401-U1611B-41R-2W from expedition 401
Some dark gray stripes, some light gray stripes, maybe some yellowish tones in the lightest stripes. Congratulations! You are applying color theory. Color theory is about describing the behavior of colors, such as mixing, color contrast, and color harmony. How colors look together and how they’re made is the basics of color theory application. It is often used by painters, but color theory is not just applicable for artists. It is necessary for the scientific world, including analysis of the ocean floor. Color theory is used as an aid for the functional applications of color as a science. To practice color science we need to first understand the international standards and practices for imaging.
In color science, we use CIELAB which stands for Commission International de l’Eclairage, or the International Commission on Illumination. They provide the recommendations for lighting, vision, color, and imaging. L*a*b* (pronounced “L star”, “a star”, and “b star”) stands for the coordinates that define a color numerically. The a* and b* signals relate to color, or chromaticity. A is related to redness or greenness. This means that a positive “a*” value (+a*) is more red, and a negative “a*” value (-a*) is more green. B is related to yellowness or blueness, so +b* is more yellow, and -b* is more blue. The values of a* and b* range from -128 to 128. The L* is the lightness channel and represents a value (black to white). L* is on a scale from 0-100, 0 being the whitest white we perceive, and 100 being the blackest black. The color of something can be found in this represented 3-axis model (figure 2).
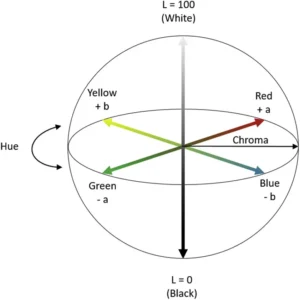

Fig. 2) model of the CIELAB color space using 3-axis
CIELAB is designed to approximate human vision and is great for perceiving small differences in color. Unlike RGB or CMYK, the colors CIELAB defines are not defined by a monitor or printer, but instead relate to the CIE standard observer. The standard observer is an averaging of the results of color matching experiments under that particular laboratory’s conditions to create a set base value for future reflectance recordings. For ocean coring, machines like the Section Half Multisensor Logger (SHMSL) use the CIELAB system for imaging cores.
The SHMSL


Fig 3.) photo of the Section Half Multisensor Logger on the JOIDES Resolution scanning an ocean core.
The SHMSL measures two things, spectral reflectance and magnetic susceptibility. These are used to create core descriptions. Since the SHMSL uses CIELAB, it requires a standard observer to set the “base” values. To set the standard observer, the SHMSL has a color reflectance control set (figure 4). The reflectance control set is similar to the ColorChecker used in professional photography (figure 5). These color patches have a known spectral reflectance value and are designed to mimic the values of natural objects, or in this case potential sediment and hard rock colors. The SHMSL is calibrated using this control set and a white standard. It then uses this recorded reflectance value to adjust future values.

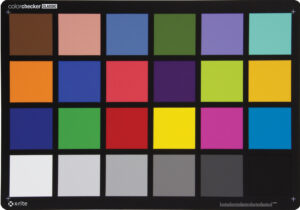


Fig. 4) A photo of the SHMSL color reflectance control set (left). Fig. 5) A photo of the Macbeth ColorChecker commonly used in photography (right).
Once calibrated and properly set up, the SHMSL is ready to read a core! Below is a finished reading of a core (figure 6). The three graphs at the bottom show the L*, a*, and b* values along the length of the core.
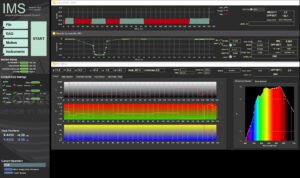

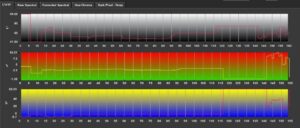

Fig. 6.1) Main IMS- SHMSL Data Acquisition Display (top). Fig 6.2) A zoomed in photo of the Main IMS- SHMSL Data Acquisition Display focusing only on the L*a*b* graph (bottom).
The numbers at the bottom of each L*, a*, and b* graphs match with the length of the core in cm. For example, at 20cm this reading shows that the core had a L* value above 80, an a* value around -30, and a b* value of around 47. This means the color was lighter in value, more green than red and more yellow than blue. A color with these values looks roughly like this (figure 7):
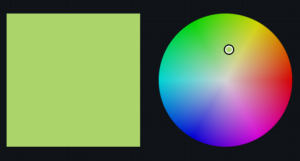

Fig. 7) A photo of a pale, yellow-greenish color.
Machines like the SHMSL are important for identifying colors on ocean cores. As we humans age, the differences in color vision grow wider due to the yellowing of our lens over time. A person in their 50s will see colors in a more yellow tint than someone in their teens due to aging. The SHMSL sets a standard for the lighting and imaging in the laboratory, narrowing the divide to provide the most accurate reading of color on the core possible.
Applying to the core
So now we know how to read the machine, but what does the color of an ocean core actually tell us? Color differences are used to quantify how an object’s color can change over time from light exposure, heat, and humidity. In the case of ocean cores, “spectral data can be used to estimate the abundances of certain compounds,” (TAMU). This means, the light values of a core may tell us about potential organic content. For example, green cores may be an indication of glauconite (depending on location and geological time) which could indicate an ancient shallow marine environment. Look back at figure one. Based on what we know of this area of the ocean floor, this type of color contrast and coloration is a clear example of a dolomotisation sequence (the formation of dolomite). Colors are powerful tools used for studying our oceans, and our oceans are full of colorful knowledge waiting for those with eyes to see it.
Sources:
- Berns, R. S. (2016). Color science and the visual arts a guide for conservators, curators, and the curious. Los Angeles Getty Conservation Institute.
- TAMU. (2026). GCR Section Half Multisensor Core Logger (SHMSL) User Guide. Atlassian.net; Texas A&M University. https://tamu-eas.atlassian.net/wiki/spaces/LMUG/pages/7341017839/SHMSL+User+Guide. Updated 06 March 2026
- Erick Bravo, Imaging Specialist for X401 aboard the JOIDES Resolution. Accessed 28 June 2026.
- Ly, Bao & Dyer, Ethan & Feig, Jessica & Chien, Anna & Bino, Sandra. (2020). Research Techniques Made Simple: Cutaneous Colorimetry: A Reliable Technique for Objective Skin Color Measurement. The Journal of investigative dermatology. 140. 3-12.e1. 10.1016/j.jid.2019.11.003.
- Macbeth ColorChecker. (2026). Imatest.com. https://www.imatest.com/wp-content/uploads/2022/01/msccc_colorchecker_classic_front.jpg
- Banaś, W. (2024). Convert LAB to RGB – colordesigner.io. Colordesigner.io. https://colordesigner.io/convert/labtorgb
Image sources:
Figure 1: Source 3
Figure 2: Source 4
Figure 3-4,6: Source 2
Figure 5: Source 5
Figure 7: Source 6
Written by OCA 2026 Mentor, Kellan Moss