Greenhouse Gases
Analysis: UK renewables enjoy record year in 2025 – but gas power still rises
The UK’s fleet of wind, solar and biomass power plants all set new records in 2025, Carbon Brief analysis shows, but electricity generation from gas still went up.
The rise in gas power was due to the end of UK coal generation in late 2024 and nuclear power hitting its lowest level in half a century, while electricity exports grew and imports fell.
In addition, there was a 1% rise in UK electricity demand – after years of decline – as electric vehicles (EVs), heat pumps and data centres connected to the grid in larger numbers.
Other key insights from the data include:
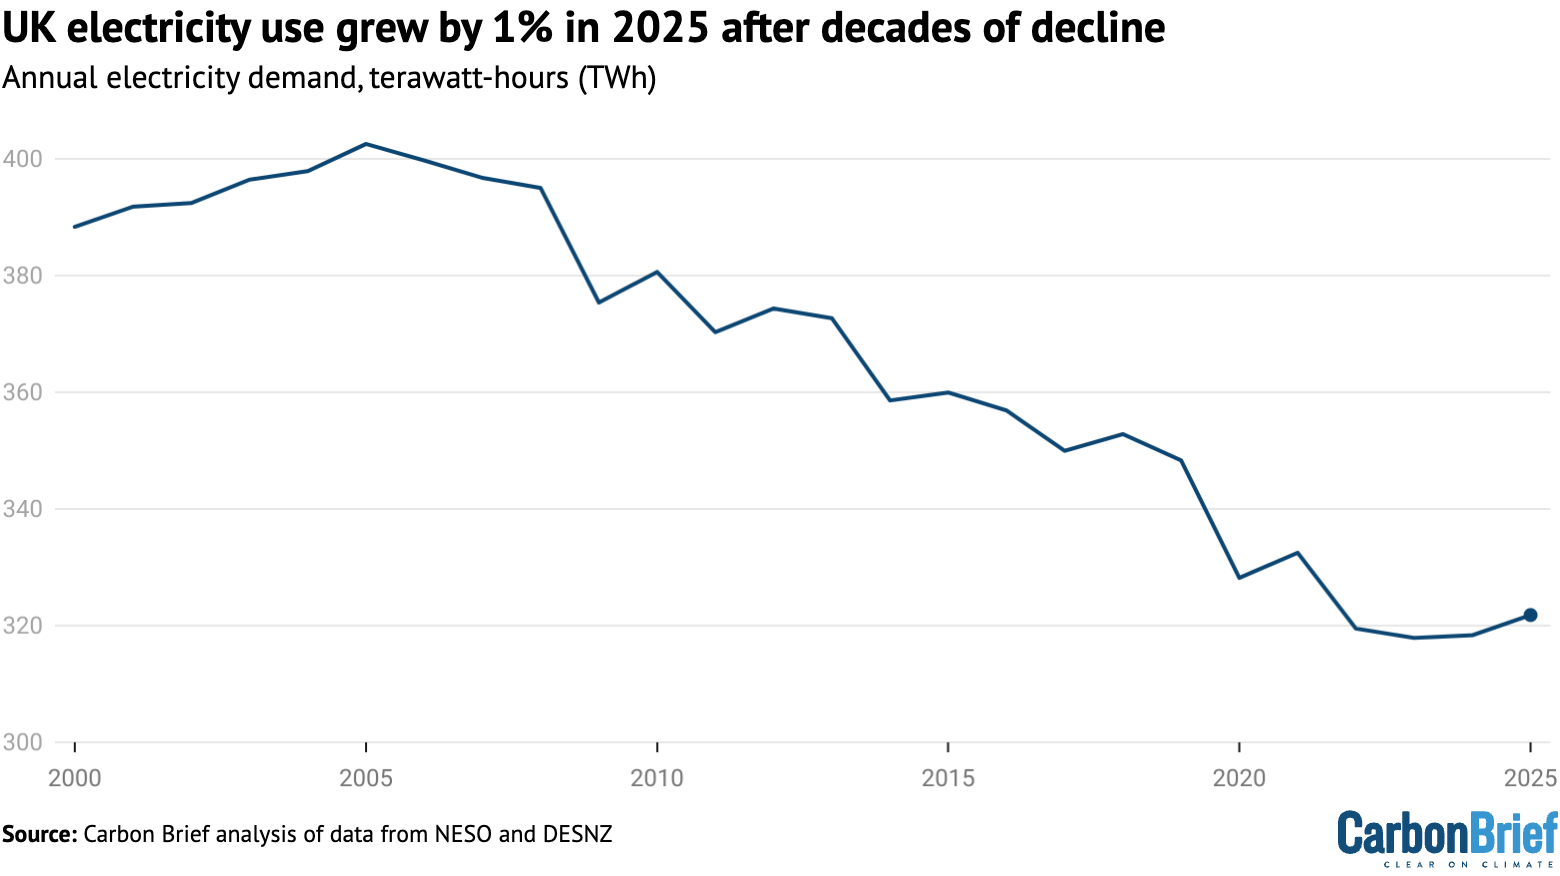
- Electricity demand grew for the second year in a row to 322 terawatt hours (TWh), rising by 4TWh (1%) and hinting at a shift towards steady increases, as the UK electrifies.
- Renewables supplied more of the UK’s electricity than any other source, making up 47% of the total, followed by gas (28%), nuclear (11%) and net imports (10%).
- The UK set new records for electricity generation from wind (87TWh, +5%), solar (19TWh, +31%) and biomass (41TWh, +2%), as well as for renewables overall (152TWh, +6%).
- The UK had its first full year without any coal power, compared with 2TWh of generation in 2024, ahead of the closure of the nation’s last coal plant in September of that year.
- Nuclear power was at its lowest level in half a century, generating just 36TWh (-12%), as most of the remaining fleet paused for refuelling or outages.
Overall, UK electricity became slightly more polluting in 2025, with each kilowatt hour linked to 126g of carbon dioxide (gCO2/kWh), up 2% from the record low of 124gCO2/kWh, set last year.
The National Energy System Operator (NESO) set a new record for the use of low-carbon sources – known as “zero-carbon operation” – reaching 97.7% for half an hour on 1 April 2025.
However, NESO missed its target of running the electricity network for at least 30 minutes in 2025 without any fossil fuels.
The UK inched towards separate targets set by the government, for 95% of electricity generation to come from low-carbon sources by 2030 and for this to cover 100% of domestic demand.
However, much more rapid progress will be needed to meet these goals.
Carbon Brief has published an annual analysis of the UK’s electricity generation in 2024, 2023, 2021, 2019, 2018, 2017 and 2016.
Record renewables
The UK’s fleet of renewable power plants enjoyed a record year in 2025, with their combined electricity generation reaching 152TWh, a 6% rise from a year earlier.
Renewables made up 47% of UK electricity supplies, another record high. The rise of renewables is shown in the figure below, which also highlights the end of UK coal power.
While the chart makes clear that gas-fired electricity generation has also declined over the past 15 years, there was a small rise in 2025, with output from the fuel reaching 91TWh. This was an increase of 5TWh (5%) and means gas made up 28% of electricity supplies overall.
The rise in gas-fired generation was the result of rising demand and another fall in nuclear power output, which reached the lowest level in half a century, while net imports and coal also declined.


The year began with the UK’s sunniest spring and by mid-December had already become the sunniest year on record. This contributed to a 5TWh (31%) surge in electricity generation from solar power, helped by a jump of roughly one-fifth in installed generating capacity.
The new record for solar power generation of 19TWh in 2025 comes after years of stagnation, with electricity output from the technology having climbed just 15% in five years.
The UK’s solar capacity reached 21GW in the third quarter of 2025. This is a substantial increase of 3 gigawatts (GW) or 18% year-on-year.
These are the latest figures available from the Department for Energy Security and Net Zero (DESNZ). The DESNZ timeseries has been revised to reflect previously missing data.
UK wind power also set a new record in 2025, reaching 87TWh, up 4TWh (5%). Wind conditions in 2025 were broadly similar to those in 2024, with the uptick in generation due to additional capacity.
The UK’s wind capacity reached 33GW in the third quarter of 2025, up 1GW (4%) from a year earlier. The 1.2GW Dogger Bank A in the North Sea has been ramping up since autumn 2025 and will be joined by the 1.2GW Dogger Bank B in 2026, as well as the 1.4GW Sofia project.
These sites were all awarded contracts during the government’s third “contracts for difference” (CfD) auction round and will be paid around £53 per megawatt hour (MWh) for the electricity they generate. This is well below current market prices, which currently sit at around £80/MWh.
Results from the seventh auction round, which is currently underway, will be announced in January and February 2026. Prices are expected to be significantly higher than in the third round, as a result of cost inflation.
Nevertheless, new offshore wind capacity is expected to be deliverable at “no additional cost to the billpayer”, according to consultancy Aurora Energy Research.
The UK’s biomass energy sites also had a record year in 2025, with output nudging up by 1TWh (2%) to 41TWh. Approximately two-thirds (roughly 27TWh) of this total is from wood-fired power plants, most notably the Drax former coal plant in Yorkshire, which generated 15TWh in 2024.
The government recently awarded new contracts to Drax that will apply from 2027 onwards and will see the amount of electricity it generates each year roughly halve, to around 6TWh. The government is also consulting on how to tighten sustainability rules for biomass sourcing.
Rising demand
The UK’s electricity demand has been falling for decades due to a combination of more efficient appliances and lightbulbs, as well as ongoing structural shifts in the economy.
Experts have been saying for years that at some point this trend would be reversed, as the UK shifts to electrified heat and transport supplies using EVs and heat pumps.
Indeed, the Climate Change Committee (CCC) has said that demand would more than double by 2050, with electrification forming a key plank of the UK’s efforts to reach net-zero.
Yet there has been little sign of this effect to date, with electricity demand continuing to fall outside single-year rebounds after economic shocks, such as the 2020 Covid lockdowns.
The data for 2025 shows hints that this turning point for electricity demand may finally be taking place. UK demand increased by 4TWh (1%) to 322TWh in 2025, after a 1TWh rise in 2024.
After declining for more than two decades since a peak in 2005, this is the first time in 20 years that UK demand has gone up for two years in a row, as shown in the figure below.
While detailed data on underlying electricity demand is not available, it is clear that the shift to EVs and heat pumps is playing an important role in the recent uptick.
There are now around 1.8m EVs on the UK’s roads and another 1m plug-in hybrids. Of this total, some 0.6m new EVs and plug-in hybrids were bought in 2025 alone. In addition, around 100,000 heat pumps are being installed each year. Sales of both technologies are rising fast.
Estimates from the NESO “future energy scenarios” point to an additional 2.0TWh of demand from new EVs in 2025, compared with 2024. They also suggest that newly installed heat pumps added around 0.2TWh of additional demand, while data centres added 0.4TWh.
By 2030, NESO’s scenarios suggest that electricity use for these three sources alone will rise by around 30TWh, equivalent to around 10% of total demand in 2025.
EVs would have the biggest impact, adding 17TWh to demand by 2030, NESO says, with heat pumps adding another 3TWh. Data-centre growth is highly uncertain, but could add 12TWh.
Gas growth
At the same time as UK electricity demand was growing by 4TWh in 2025, the country also lost a total of 10TWh of supply as a result of a series of small changes.
First, 2025 was the UK’s first full year without coal power since 1881, resulting in the loss of 2TWh of generation. Second, the UK’s nuclear fleet saw output falling to the lowest level in half a century, after a series of refuelling breaks and outages, which cut generation by 5TWh.
Third, after a big jump in imports in 2024, the UK saw a small decline in 2025, as well as a more notable increase in the amount of electricity exported to other countries. This pushed the country’s net imports down by 1TWh (4%).
The scale of cross-border trade in electricity is expected to increase as the UK has significantly expanded the number of interconnections with other markets.
However, the government’s clean-power targets for 2030 imply that the UK would become a net exporter, sending more electricity overseas than it receives from other countries. At present, it remains a significant net importer, with these contributions accounting for 109% of supplies.
Finally, other sources of generation – including oil – also declined in 2025, reducing UK supplies by another 2TWh, as shown in the figure below.

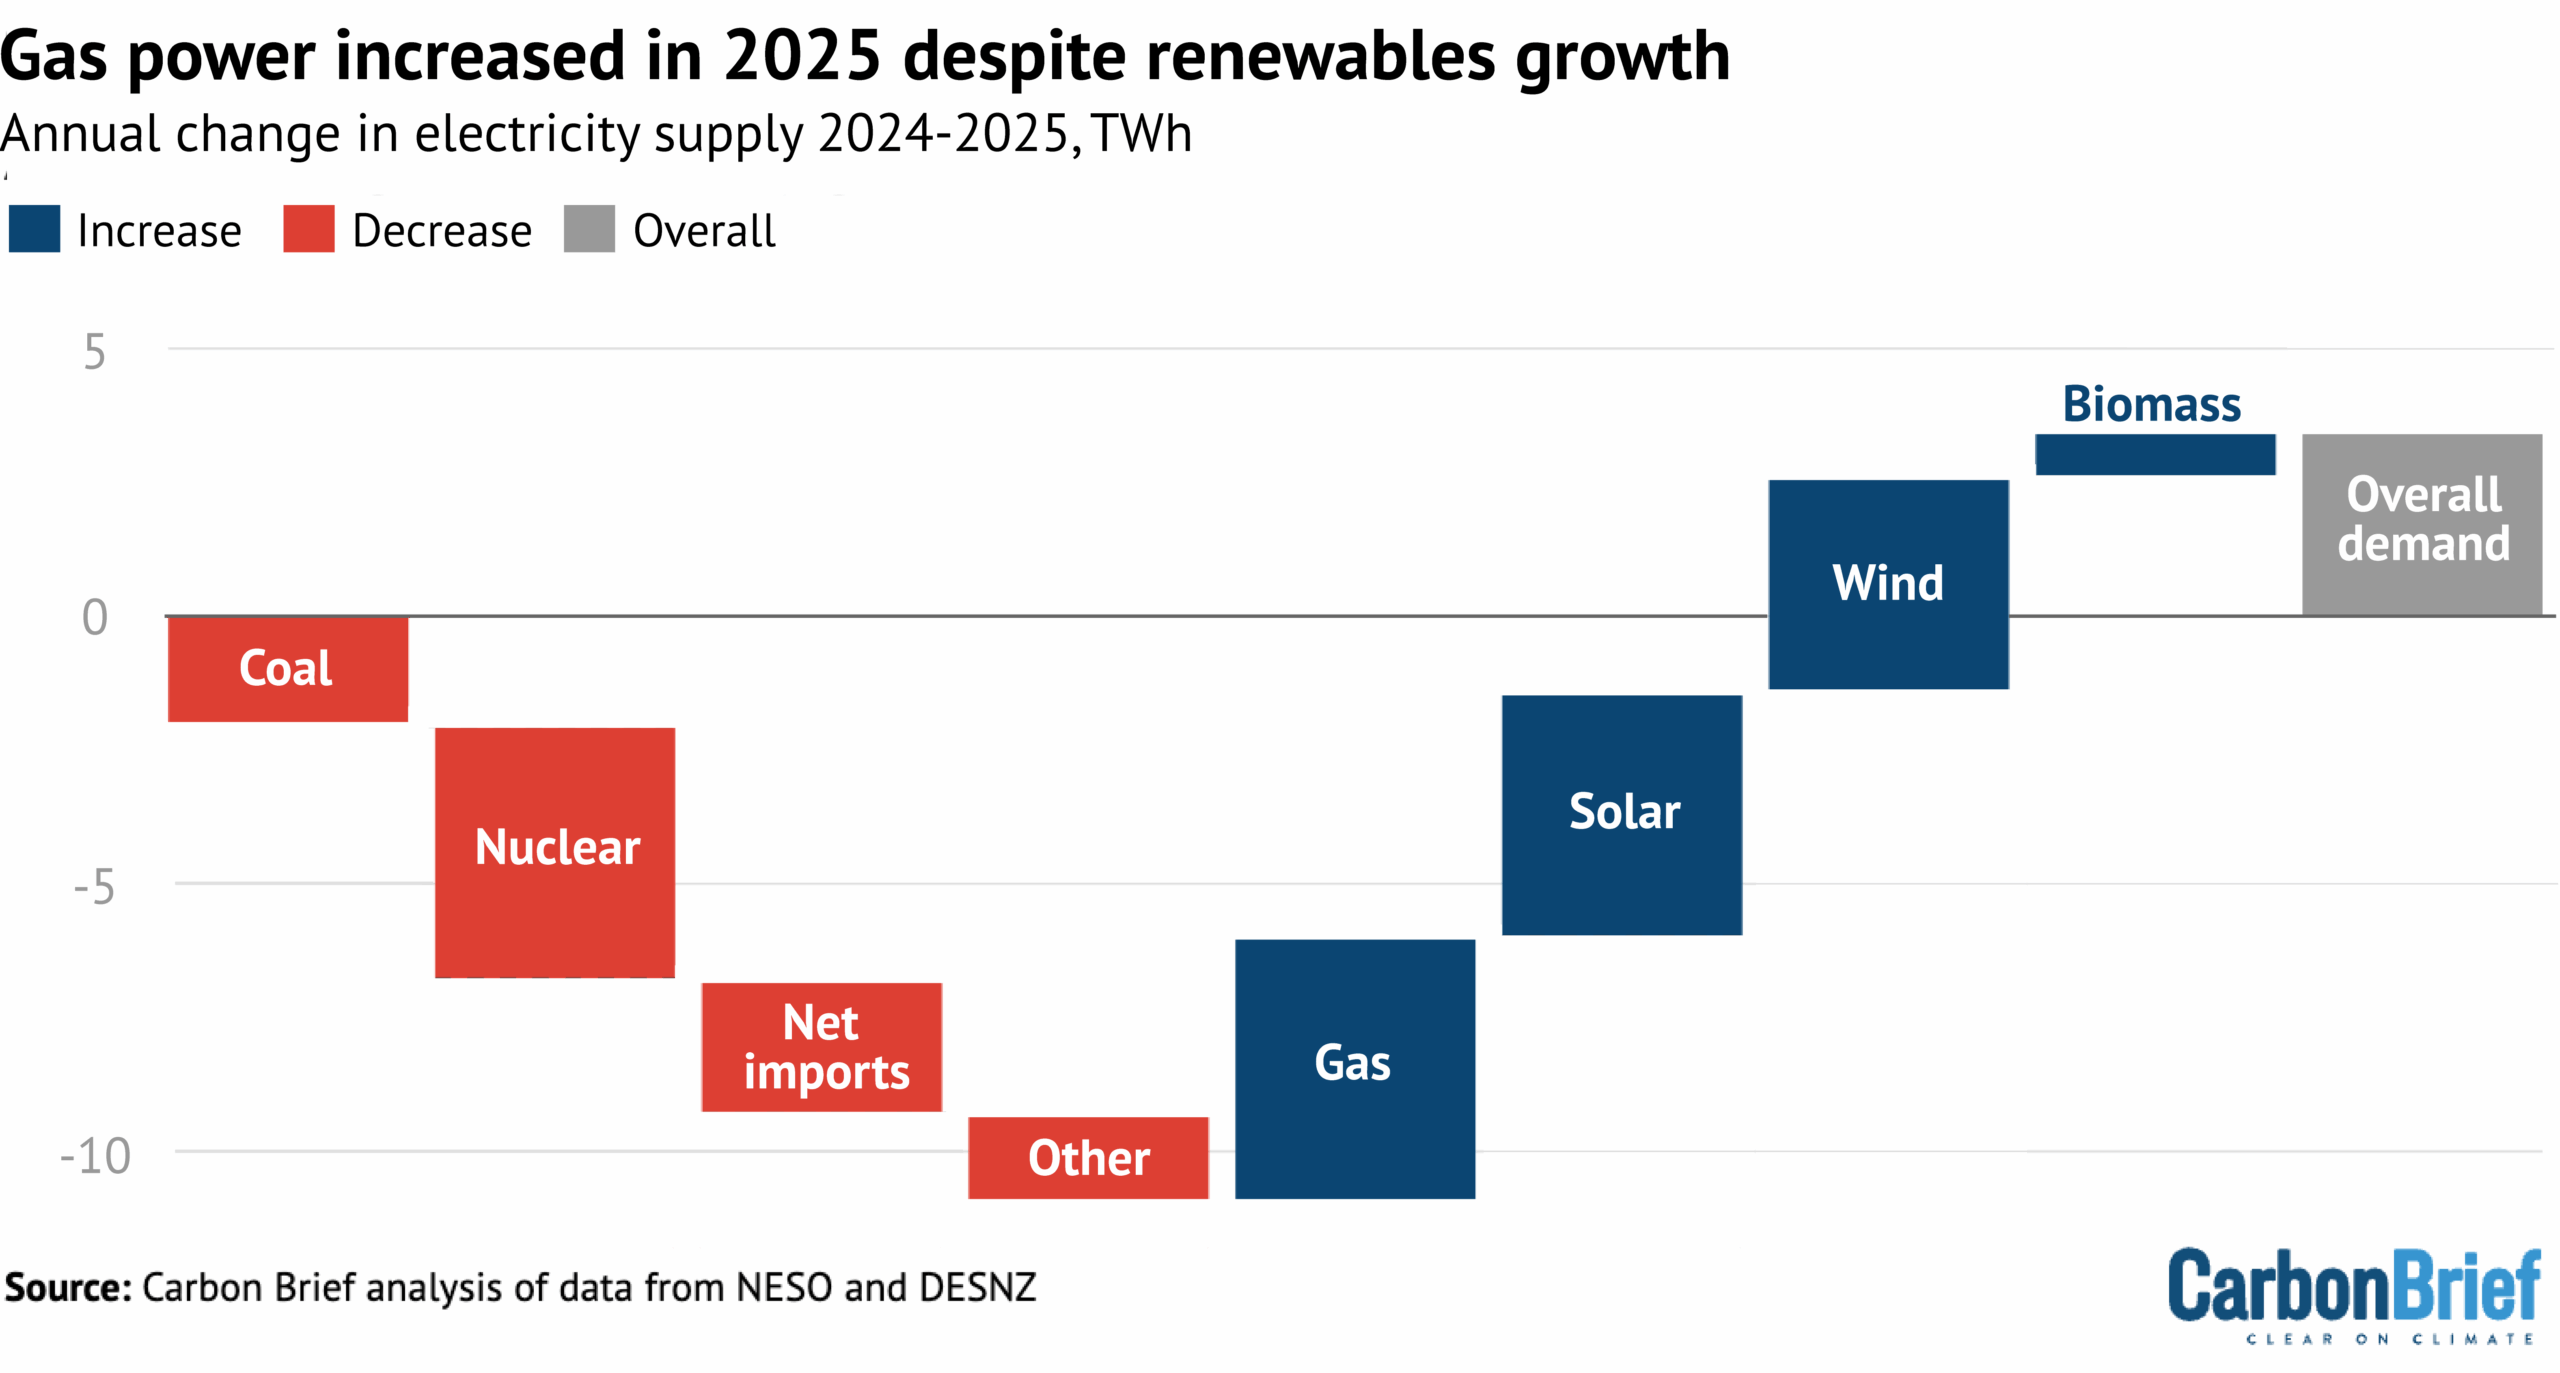
These losses in UK electricity supply were met by the already-mentioned increases in generation from gas, solar, wind and biomass, as shown in the figure above.
The government’s targets for decarbonising the UK’s electricity supplies will face similar challenges in the years to come as electrification – and, potentially, data centres – continue to push up demand.
All but one of the UK’s existing nuclear power plants are set to retire by 2030, meaning the loss of another 27TWh of nuclear generation.
This will be replaced by new nuclear capacity, but only slowly. The 3.2GW Hinkley Point C plant in Somerset is set to start operating in 2030 at the earliest and its sister plant, Sizewell C in Suffolk, not until at least another five years later.
Despite backing from ministers for small modular reactors, the timeline for any buildout is uncertain, with the latest government release referring to the “mid-2030s”.
Meanwhile, biomass generation is likely to decline as the output of Drax is scaled back from 2027.
Stalling progress
Taken together, the various changes in the UK’s electricity supplies in 2025 mean that efforts to decarbonise the grid stalled, with a small increase in emissions per unit of generation.
The 2% increase in carbon intensity to 126gCO2/kWh is illustrated in the figure below and comes after electricity was the “cleanest ever” in 2024, at 124gCO2/kWh.

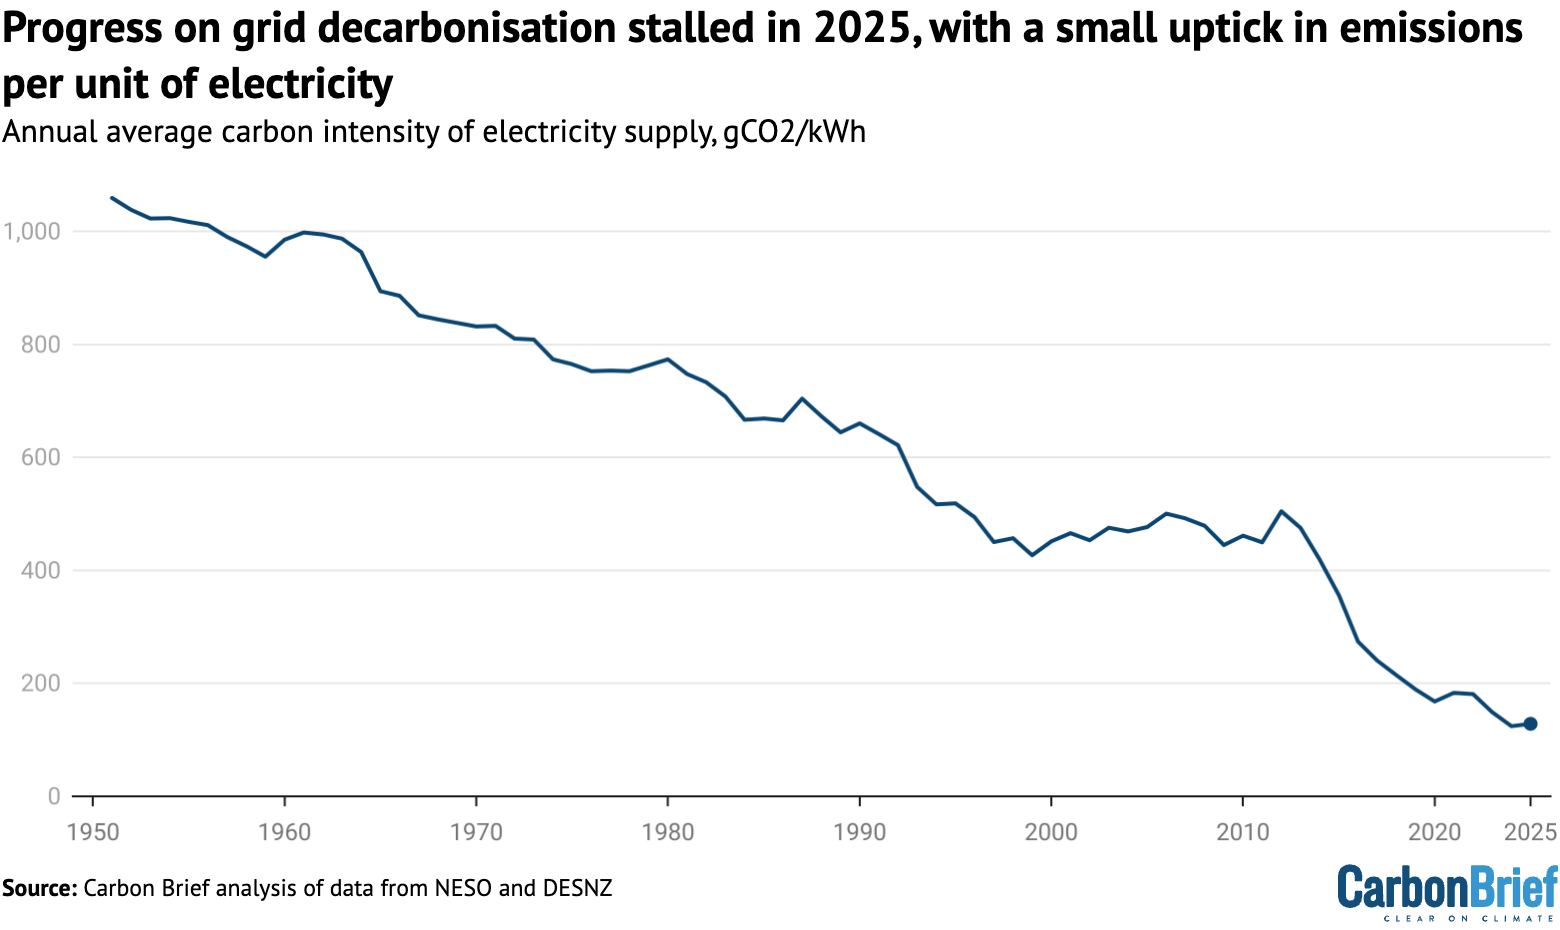
The stalling progress on cleaning up the UK’s grid reflects the balance of record renewables, rising demand and rising gas generation, along with poor output from nuclear power.
Nevertheless, a series of other new records were set during 2025.
NESO ran the transmission grid on the island of Great Britain (GB; namely, England, Wales and Scotland) with a record 97.7% “zero-carbon operation” (ZCO) on 1 April 2025.
Note that this measure excludes gas plants that also generate heat – known as combined heat and power, or CHP – as well as waste incinerators and all other generators that do not connect to the transmission network, which means that it does not include most solar or onshore wind.
NESO was unable to meet its target – first set in 2019 – for 100% ZCO during 2025, meaning it did not succeed in running the transmission grid without any fossil fuels for half an hour.
Other records set in 2025 include:
- GB ran on 100% clean power, after accounting for exports, for a record 87 hours in 2025, up from 64.5 hours in 2024.
- Total GB renewable generation from wind, solar, biomass and hydro reached a record 31.3GW from 13:30-14:00 on 4 July 2025, meeting 84% of demand.
- GB wind generation reached a record 23.8GW for half an hour on 5 December 2025, when it met 52% of GB demand.
- GB solar reached a record 14.0GW at 13:00 on 8 July 2025, when it met 40% of demand.
The government has separate targets for at least 95% of electricity generation and 100% of demand on the island of Great Britain to come from low-carbon sources by 2030.
These goals, similar to the NESO target, exclude Northern Ireland, CHP and waste incinerators. However, they include distributed renewables, such as solar and onshore wind.
These definitions mean it is hard to measure progress independently. The most recent government figures show that 74% of qualifying generation in GB was from low-carbon sources in 2024.
Carbon Brief’s figures for the whole UK show that low-carbon sources made up a record 58% of electricity supplies overall in 2025, up marginally from a year earlier.
Similarly, low-carbon sources made up 65% of electricity generation in the UK overall. This was unchanged from a year earlier.
Methodology
The figures in the article are from Carbon Brief analysis of data from DESNZ Energy Trends, chapter 5 and chapter 6, as well as from NESO. The figures from NESO are for electricity supplied to the grid in Great Britain only and are adjusted here to include Northern Ireland.
In Carbon Brief’s analysis, the NESO numbers are also adjusted to account for electricity used by power plants on site and for generation by plants not connected to the high-voltage national grid.
NESO already includes estimates for onshore windfarms, but does not cover industrial gas combined heat and power plants and those burning landfill gas, waste or sewage gas.
Carbon intensity figures from 2009 onwards are taken directly from NESO. Pre-2009 estimates are based on the NESO methodology, taking account of fuel use efficiency for earlier years.
The carbon intensity methodology accounts for lifecycle emissions from biomass. It includes emissions for imported electricity, based on the daily electricity mix in the country of origin.
DESNZ historical electricity data, including years before 2009, is adjusted to align with other figures and combined with data on imports from a separate DESNZ dataset. Note that the data prior to 1951 only includes “major” power producers.
The post Analysis: UK renewables enjoy record year in 2025 – but gas power still rises appeared first on Carbon Brief.
Analysis: UK renewables enjoy record year in 2025 – but gas power still rises