Climate Change
Analysis: ‘Super El Niño’ reaches ‘remarkable’ all-time record
This year’s so-called “super El Niño” is entering into record-breaking territory.
Sea surface temperatures in the tropical Pacific now equal the previous daily record set in 2015 and will likely keep rising in the days ahead.
El Niño is a naturally occurring climate phenomenon in the Pacific that reshapes weather patterns around the world and temporarily boosts global temperatures.
The current El Niño event – which has been underway since June and is expected to last until next year – has been developing faster than any previous event on record.
The strength of an event is tracked using the “Niño 3.4 anomaly”, which measures how much warmer sea surface temperatures in a section of the central Pacific are than average.
As of 19 September, the daily anomaly in the Niño 3.4 region stands at 3.07C, putting it in a statistical tie with the previous record of 3.08C.
Some scientists, using a different baseline for calculating the anomaly, have already called the new record.
Either way, this is remarkable, in part because of how early in the calendar year it is occurring. El Niño typically peaks in the winter months, most commonly in November or December.
Every strong El Niño on record has continued to strengthen after mid-September – and there is every reason to think that this one will as well.
(For more on El Niño, see Carbon Brief’s recent interactive explainer.)
Record territory
El Niño events are typically classed as “weak” when the Niño 3.4 anomaly reaches 0.5C, “moderate” above 1C, “strong” above 1.5C and “very strong” above 2.0C.
For this year’s event, the Niño 3.4 anomaly has now reached 3.07C, which puts it in a statistical tie with the record set on 18 November 2015, set during a “very strong” El Nino event.
The chart below shows how the strength of the current El Niño (red line) is dramatically outpacing both 2015-16 (blue) and another “very strong” event in 1997-98 (light blue).

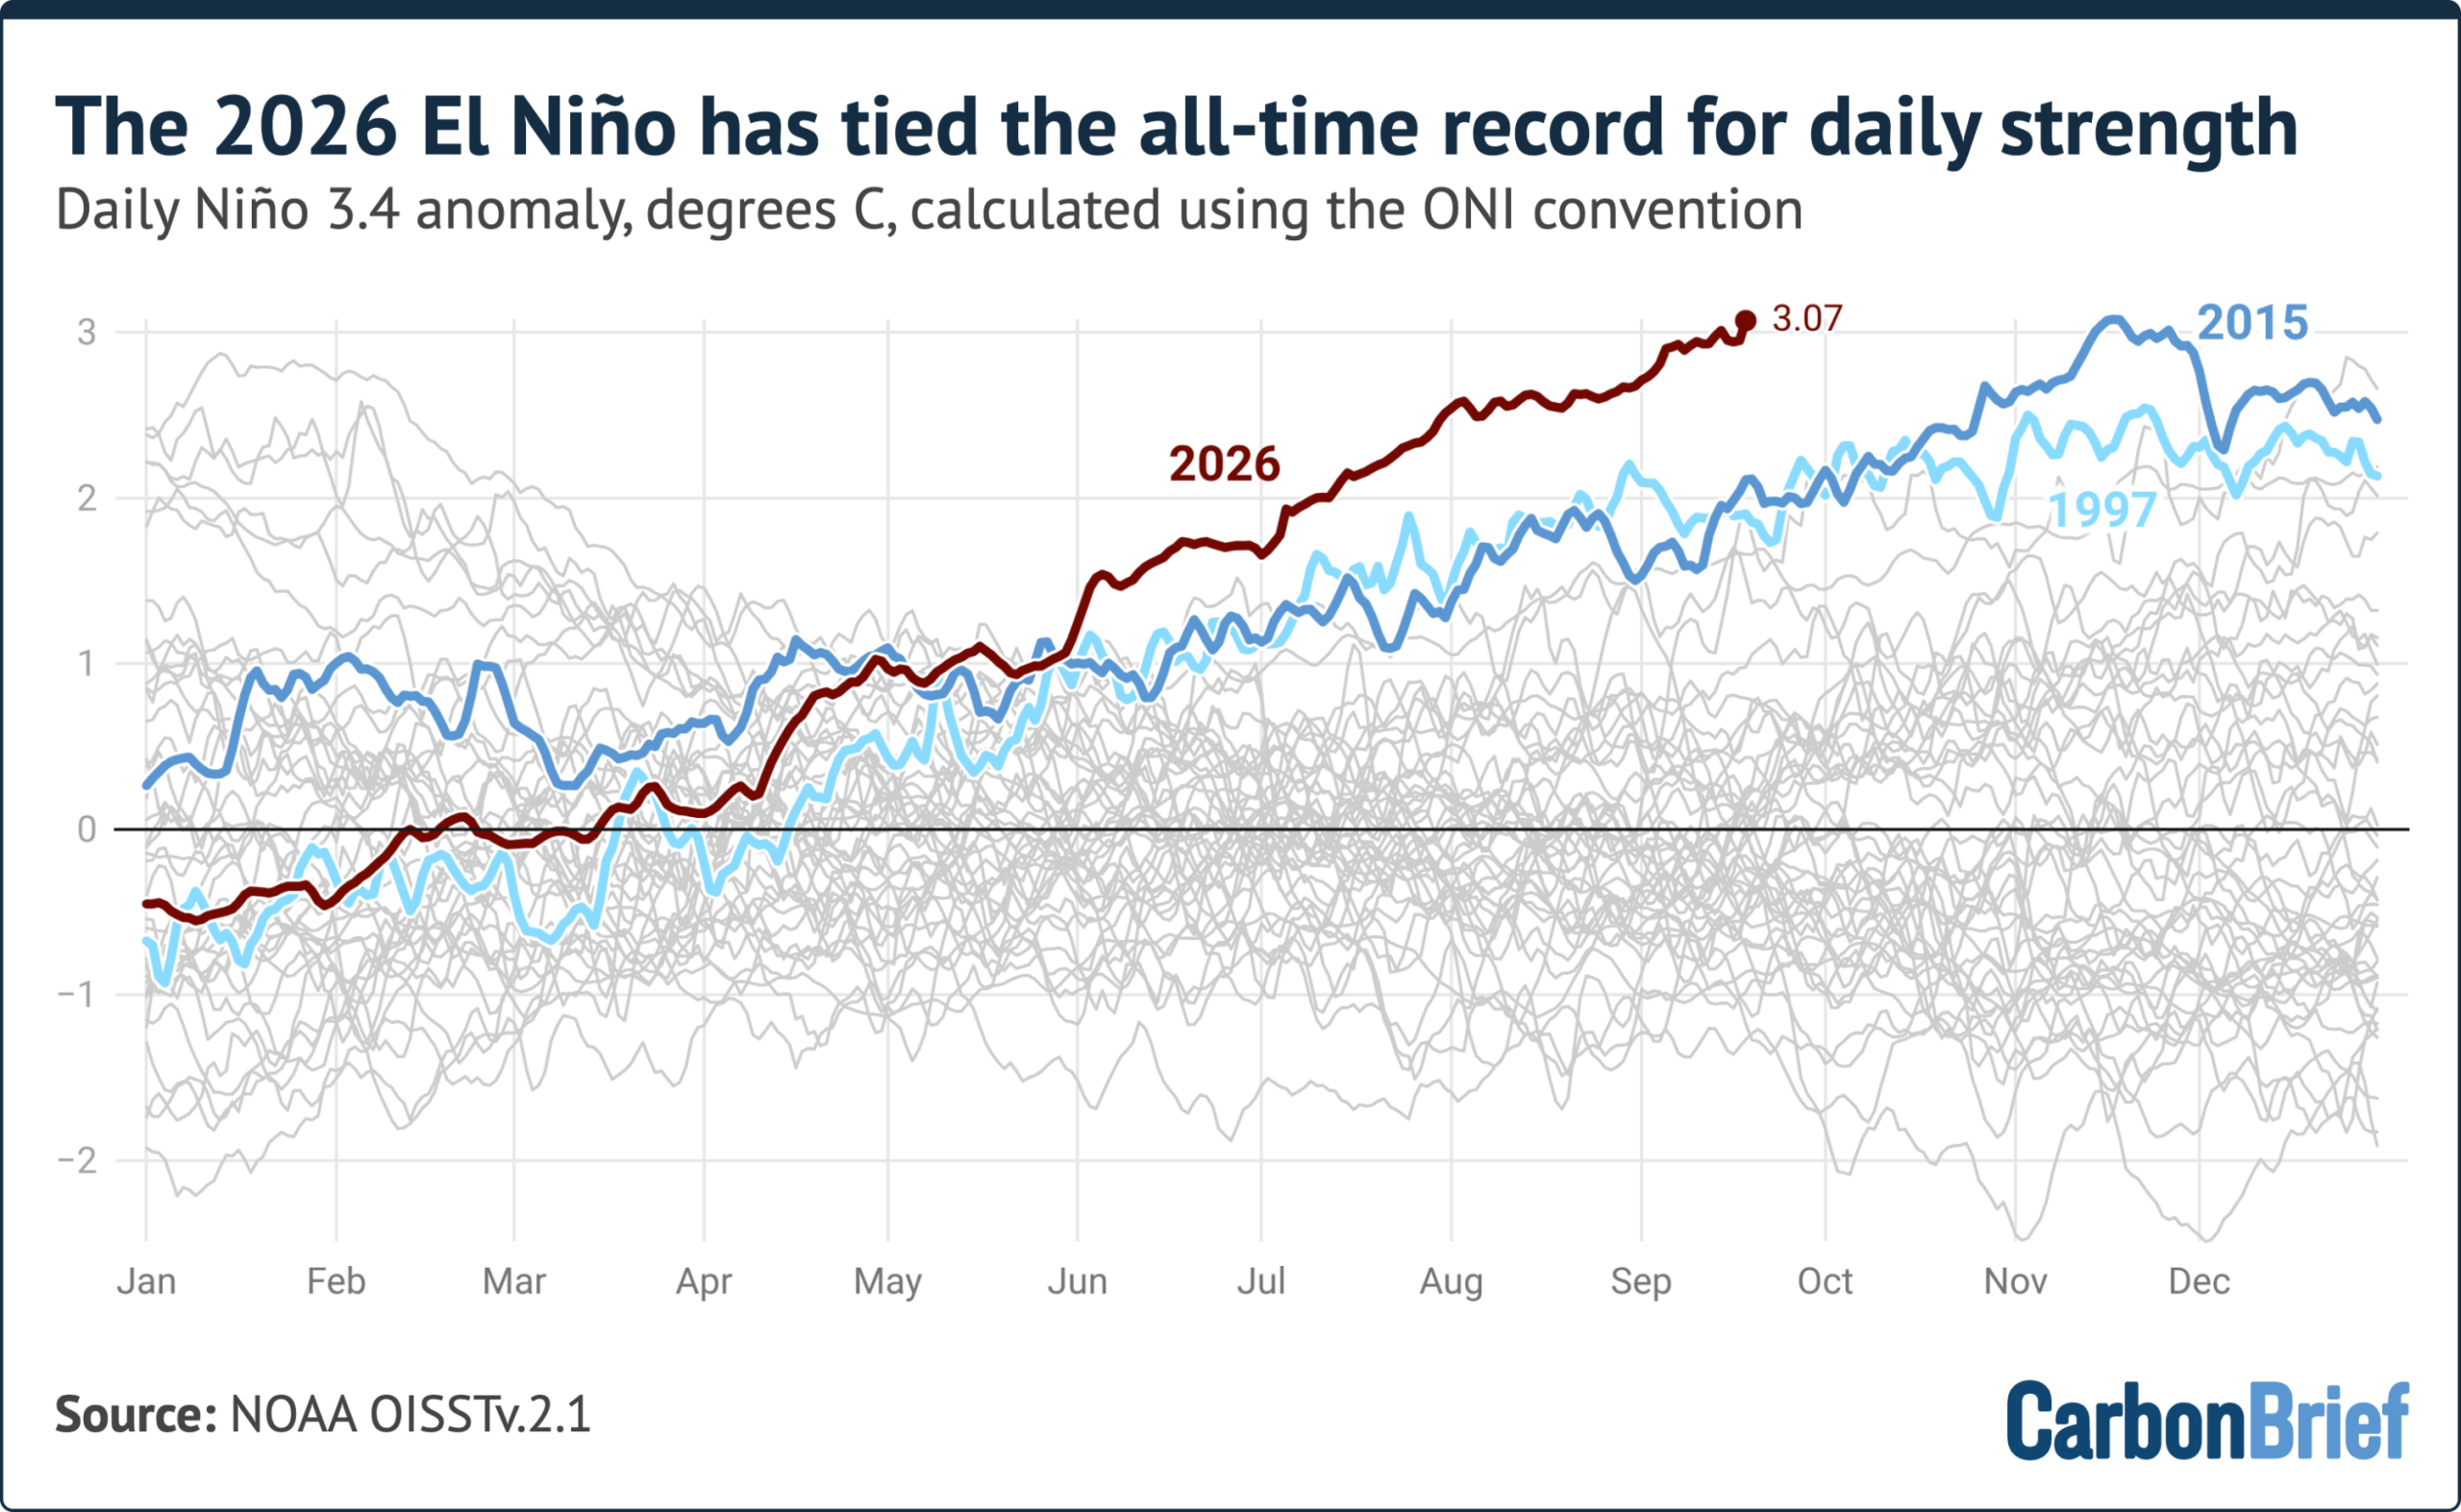
To analyse the developing El Niño, Carbon Brief followed the convention of the US National Oceanic and Atmospheric Administration’s (NOAA) Oceanic Niño index (ONI).
ONI is calculated by subtracting the latest 30-year average temperature in the Nino 3.4 region from daily sea surface temperatures. This approach allows for the most recent years to be compared against the most recent 30-year period. It removes much of the influence of longer-term, human-driven warming from the index.
(While meteorological organisations typically track changes to ONI on a three-month rolling average basis, Carbon Brief’s analysis looked at how the metric is changing on a daily basis.)
If ONI is calculated using a baseline of 1991-2020 then the current El Niño has already set a new record.
Since the start of June, El Niño’s strength has been greater than any other year. In early September in both 1997 and 2015, anomalies were around 1.9C – more than one degree below where they are this year.
An alternative index
There is another commonly used metric – the relative Oceanic Niño index (RONI) – used to study El Niño.
Introduced by NOAA in 2024, the RONI index adjusts for tropical ocean warming linked to human-caused climate change. To do this, it takes sea surface averages in the Nino 3.4 region and subtracts out temperature anomalies observed across the tropical oceans (between the latitudes of 20 degrees north and south).
This approach may better remove the influence of climate change in this specific region, but can also diminish the apparent strength of strong El Niño events, such as the current one, which extend well outside the Niño 3.4 region.
The chart below shows daily RONI values, which are record setting for this time of year, but remain below an all-time daily record set during the 1982-83 El Niño event.

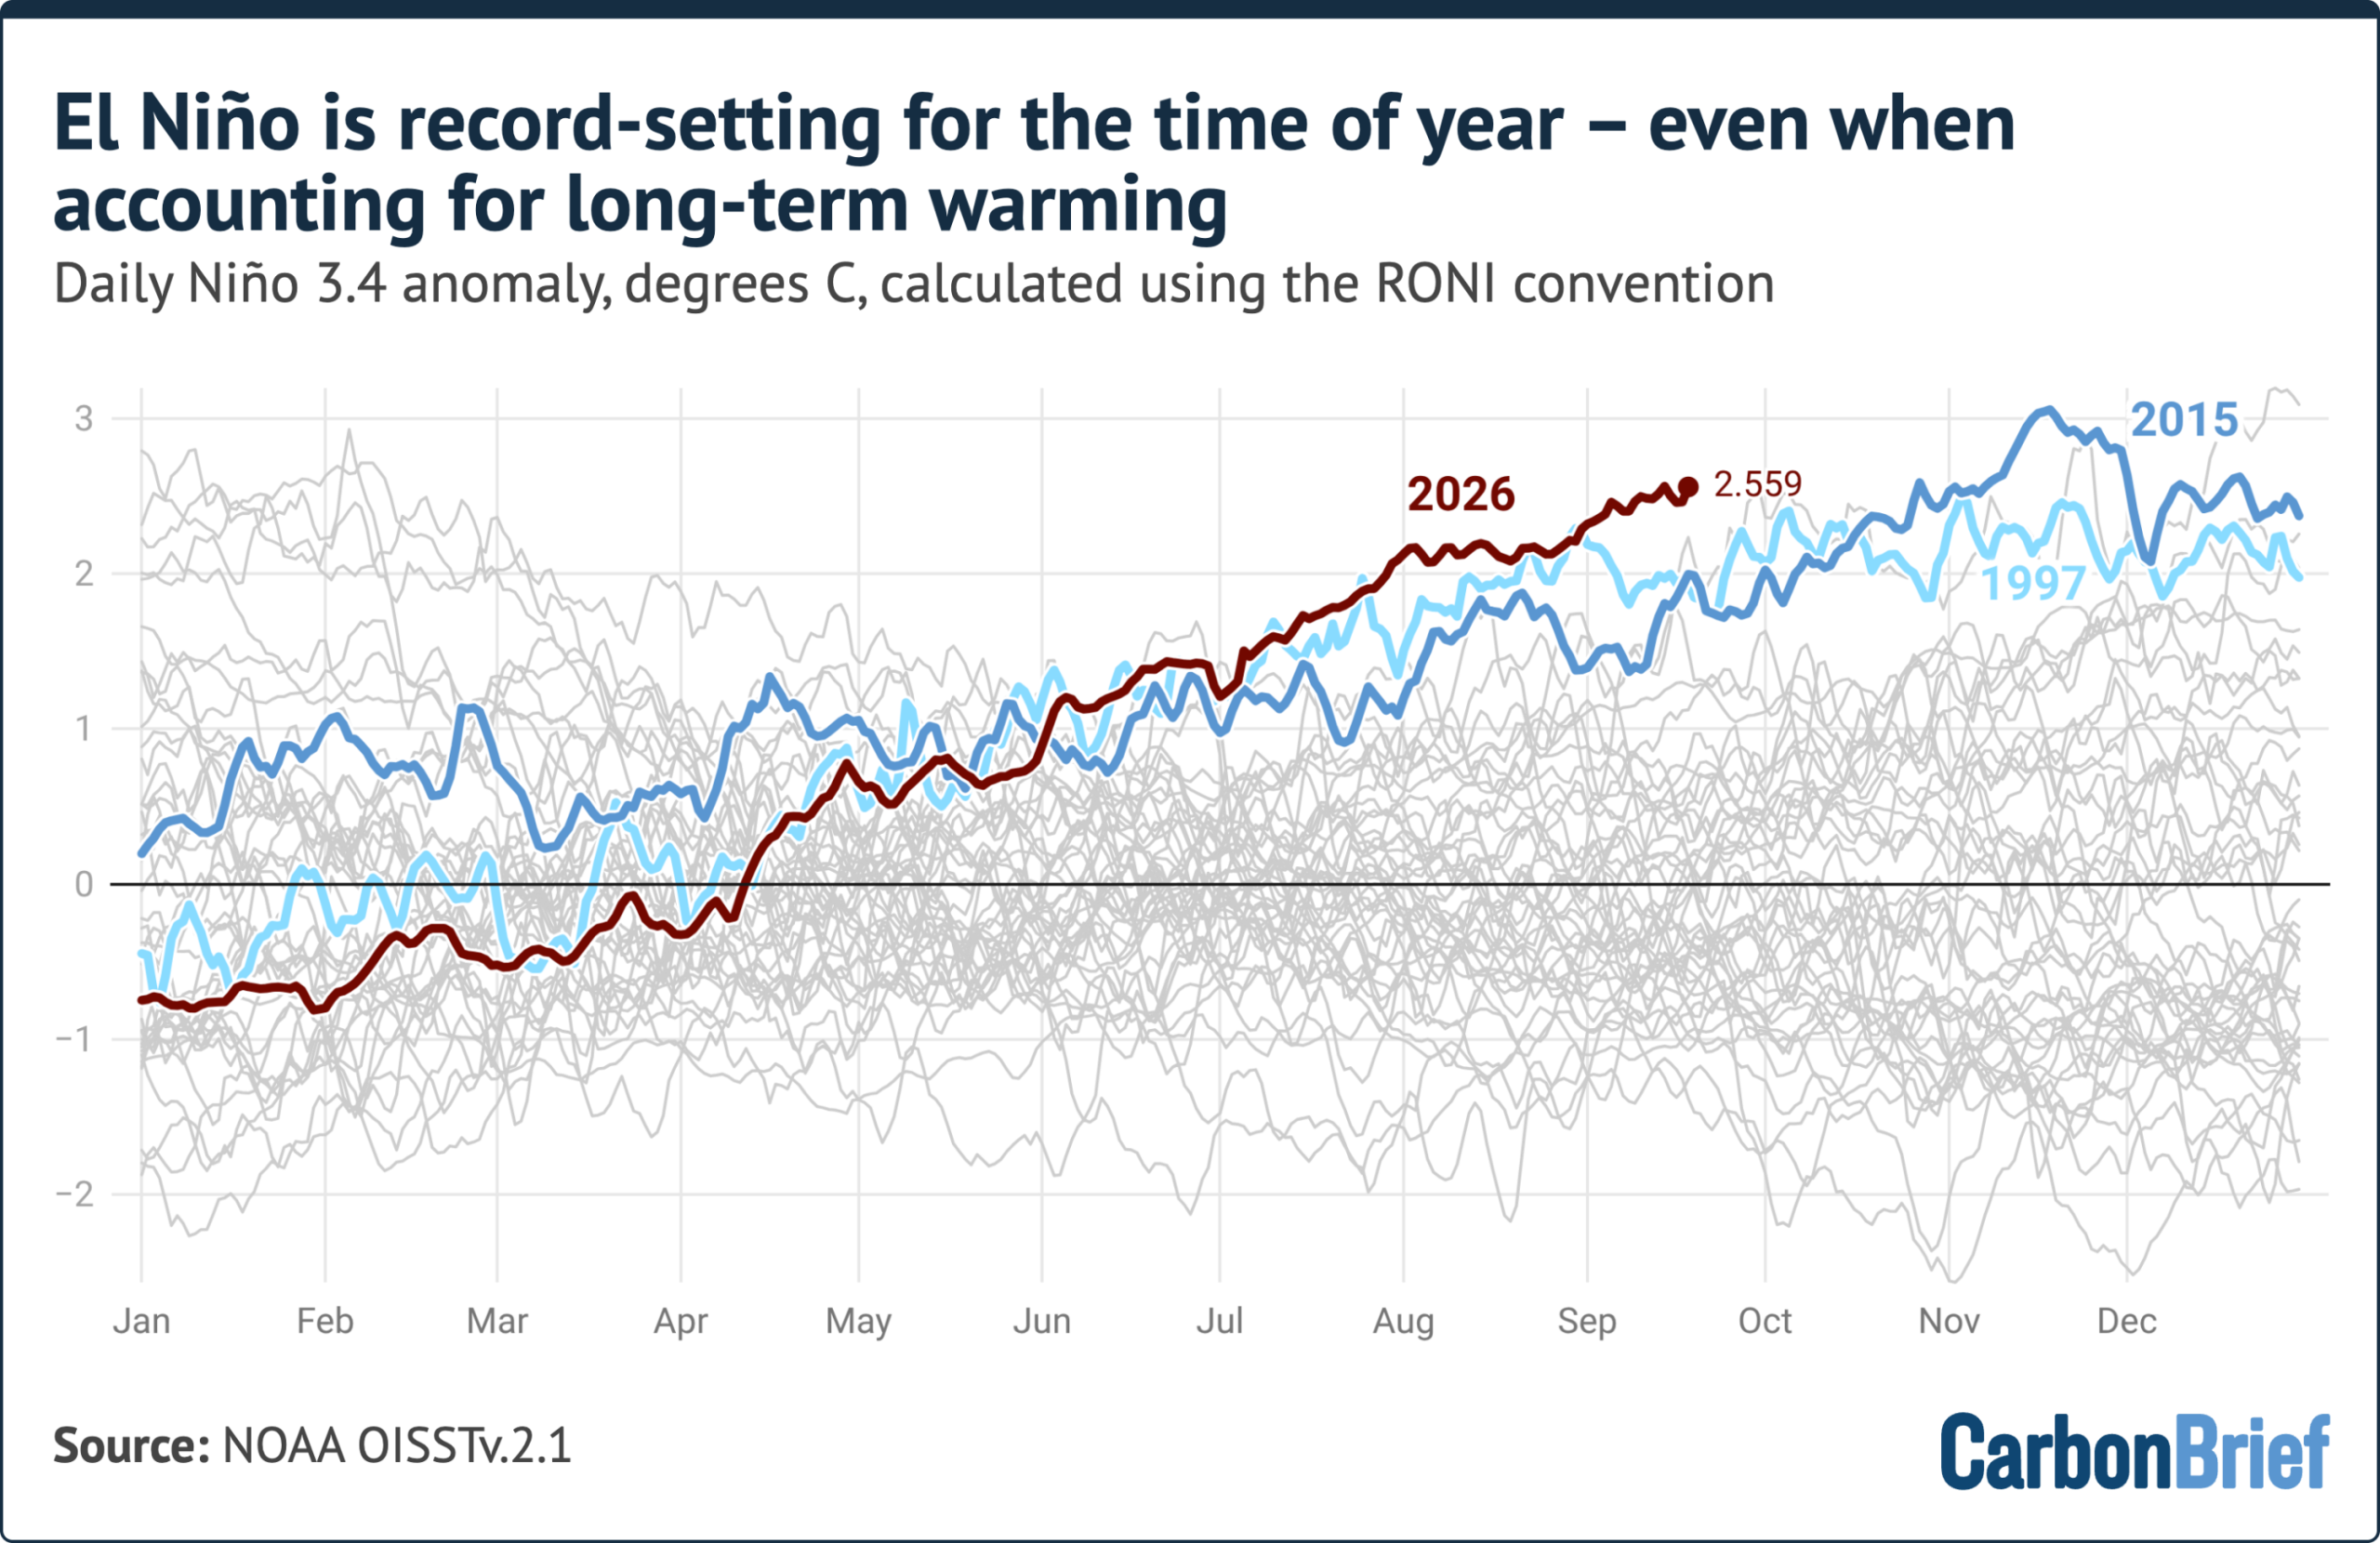
RONI stood at around 2.5C in mid-September, some 0.7C below the 1982 record.
However, that record was set in late December, at the peak of the event.
The 1982-83, 1997-98 and 2015-16 events added between 0.5C and 1.9C to their RONI values between mid-September and their peaks.
On track to smash monthly and seasonal records
Because daily El Niño values are noisy, scientists typically turn to monthly or seasonal averages to compare El Niño events.
The latest full calendar month for which data is available – August 2026 – had a Niño 3.4 anomaly of around 2.45C. This is higher than the peak of every prior El Niño event on record except 2015-16 – where the anomaly reached 2.75C – and 1877-78, when the anomaly sat at around 2.7C, based on a reconstruction of sea surface temperatures using sparse ship data.
The figure below shows the monthly evolution of the five strongest El Niño events on record alongside 2026, as well the current forecast from 14 seasonal forecast models.

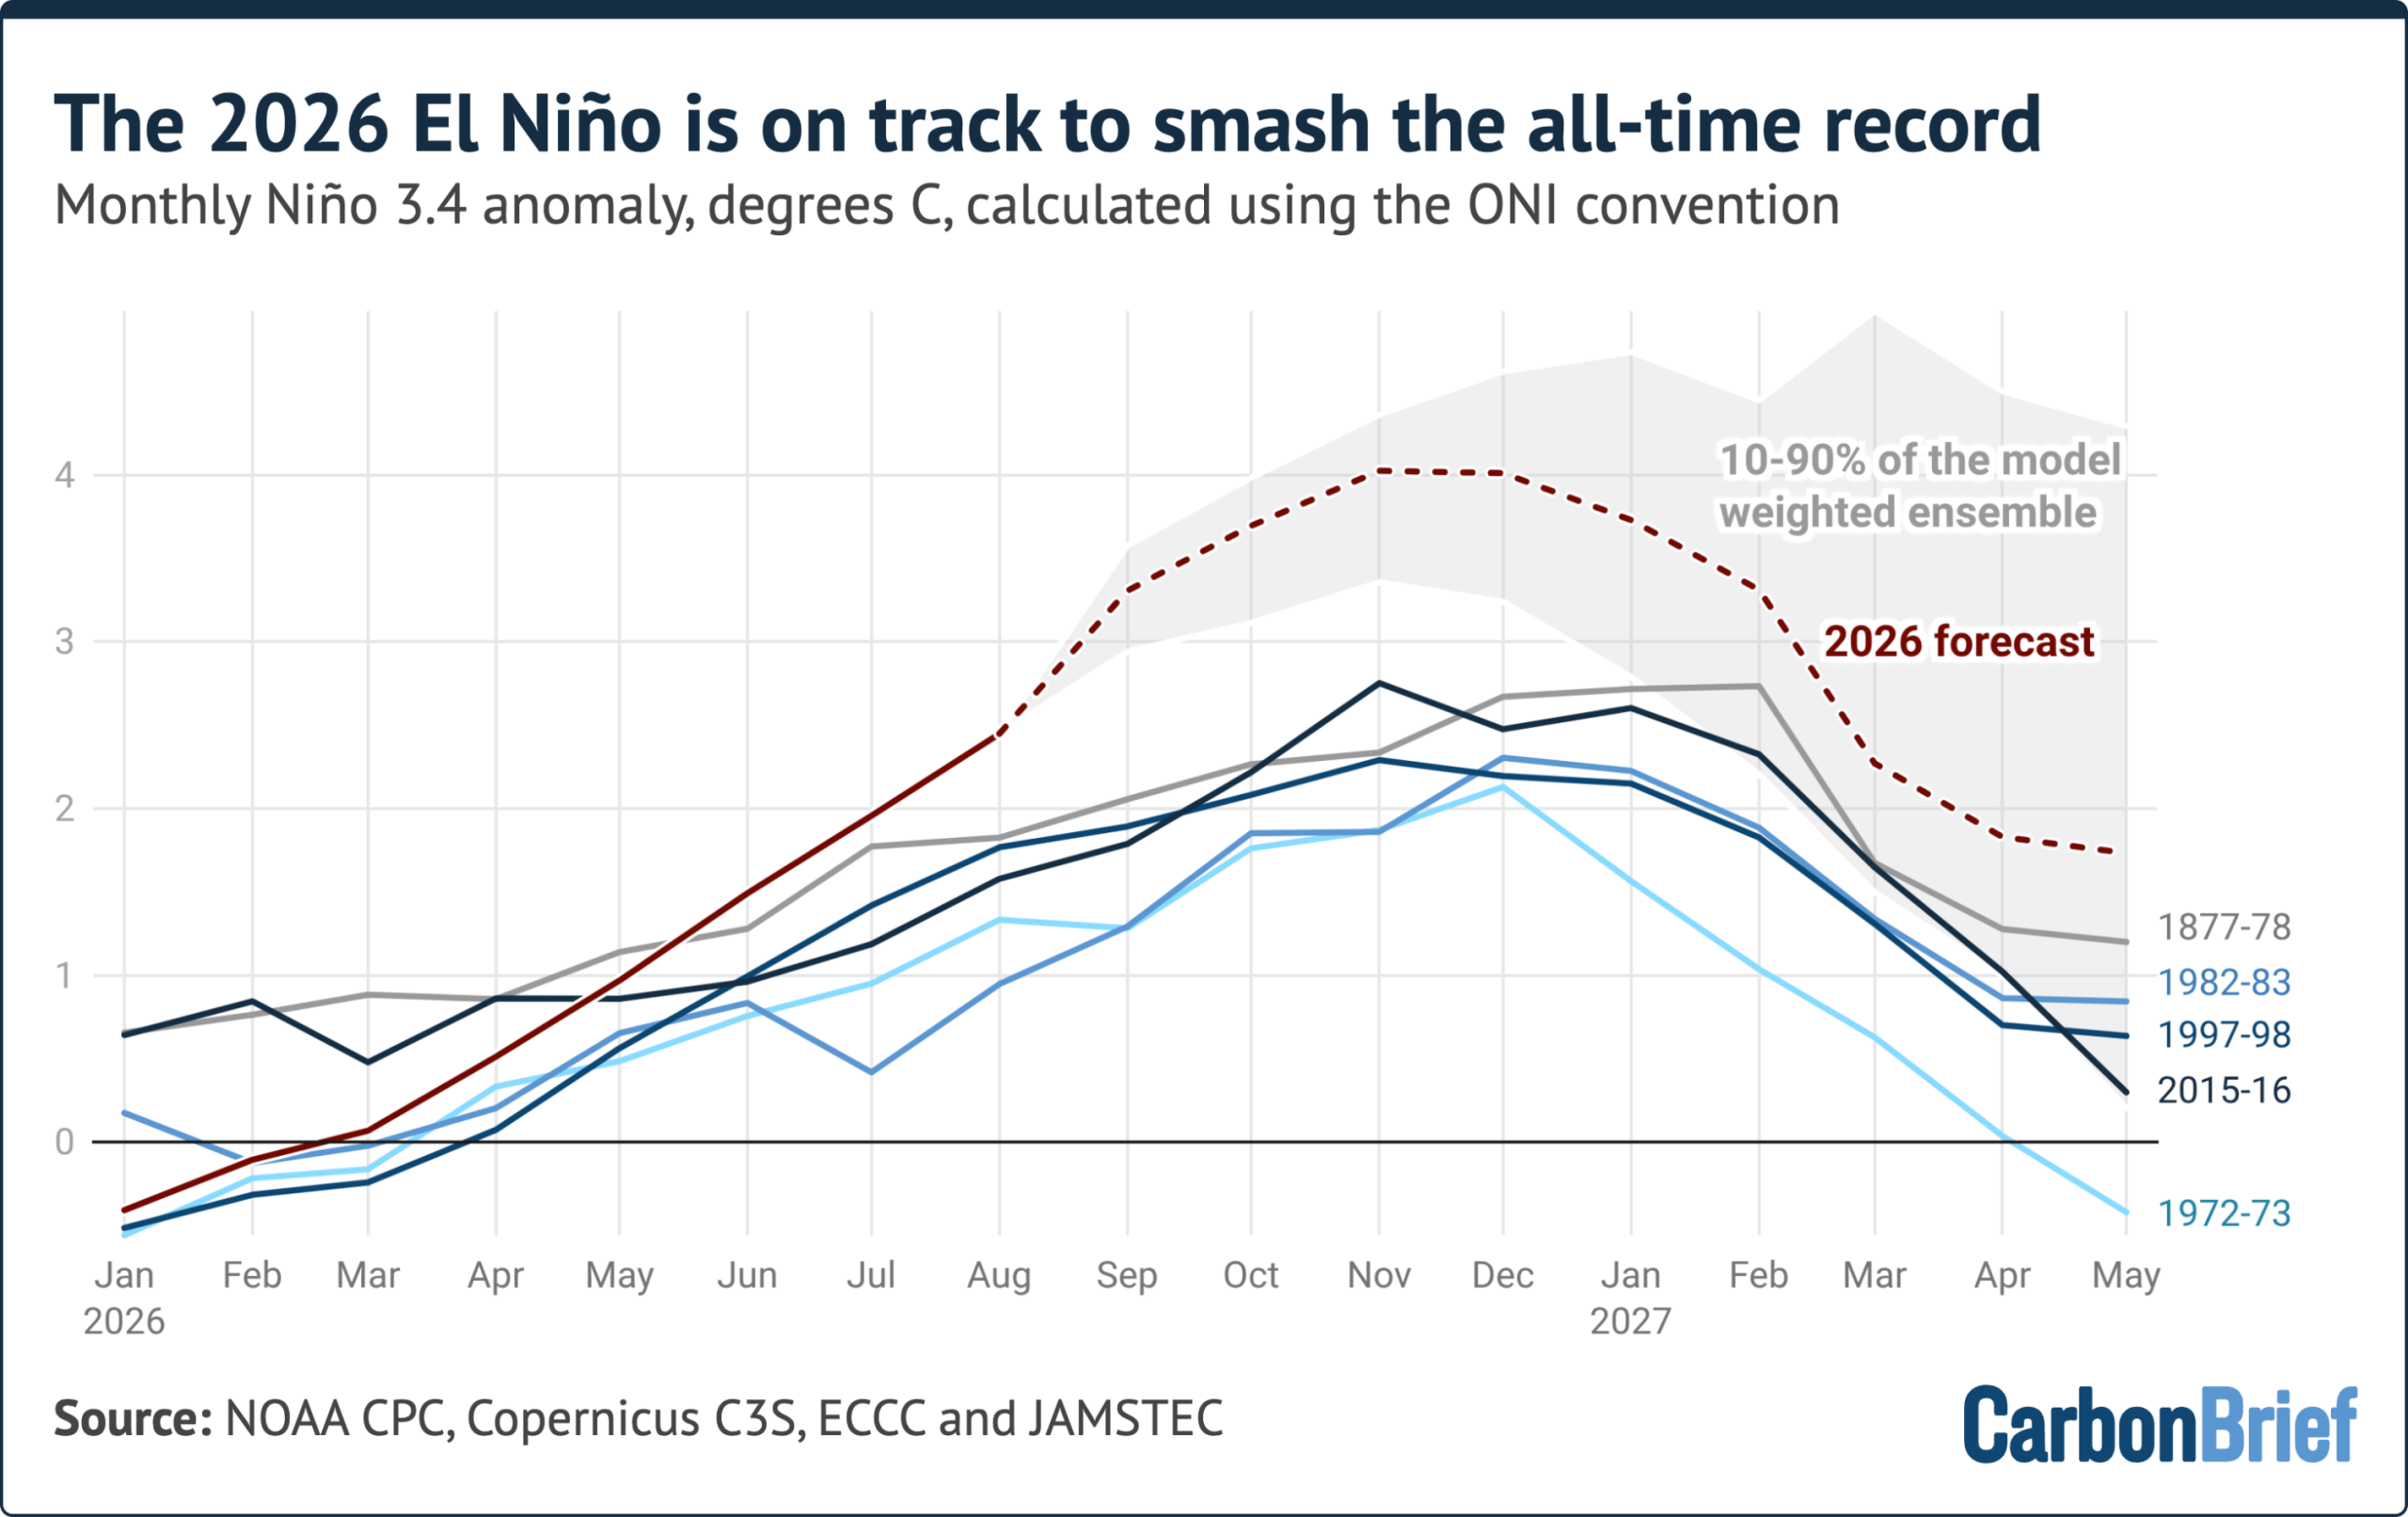
Taken together, the models project a peak monthly anomaly later this year of around 4.1C, with 80% of the 674 individual model runs falling between 3.4C and 4.6C.
Every single model run peaks above the 2015-16 record. The projected margin over that record, some 1.3C, is larger than the entire gap between the strongest and fifth-strongest El Niño of the past 150 years.
Some caution here is warranted, however. No seasonal forecast system has ever been verified against an event of this size, because none has ever occurred. The models also predicted temperatures slightly warmer than observed this summer, with real-world observations for August coming in around 0.3C below forecasts.
However, all strong El Niño events on record have continued to strengthen well into the winter – and the models are in near-unanimous agreement that this one will, too. If the forecast holds, the current event will peak between November and January at a level far beyond any event previously observed in the instrumental record.
El Nino’s effect on global temperatures typically lags rising ocean temperatures in the Pacific by several months, so most of the impact will be felt in 2027 rather than 2026.
Carbon Brief’s most recent “state of the climate” quarterly analysis found 2026 on track to be the warmest or second-warmest year on record. The next update in early October will examine what a record El Niño means for 2027.




The post Analysis: ‘Super El Niño’ reaches ‘remarkable’ all-time record appeared first on Carbon Brief.
Analysis: ‘Super El Niño’ reaches ‘remarkable’ all-time record